

Bullish candlestick patterns can help traders spot potential changes in buying pressure and price direction. But identifying a pattern on a chart is only the starting point. Its location, surrounding price action, and confirmation can determine how meaningful the signal may be.
From the Hammer and Bullish Engulfing to the Morning Star and Rising Three Methods, different patterns can indicate potential reversals, strong buying momentum, or continuation of an existing uptrend. Understanding these Bullish Candlesticks formations can help traders interpret price action more effectively.
This guide covers 20 bullish candle patterns, explains what each formation indicates, and outlines the key factors to consider before using one in a trading setup.
Want a quick reference while studying these patterns? Use the button above to download the Bullish Candlesticks Pattern PDF Guide, covering all 20 patterns in a convenient, easy-to-reference format.
Bullish patterns in trading are the formations that may indicate increasing buying pressure or a potential upward move in price. Traders identify these formations by studying one or more candlesticks on a price chart.
A candlestick shows four key prices:
When the closing price is above the opening price, the candle is generally considered bullish. However, a single bullish candle is not automatically a bullish candle pattern.
The pattern, its location on the chart, and the surrounding price action all matter.
Candlestick patterns provide a visual representation of the interaction between buyers and sellers.
For example, a long bullish candle may show strong buying during a particular period. A candle with a long lower shadow may show that sellers pushed the price lower but buyers stepped in and drove it back up.
Some patterns consist of one candle. Others require two, three, or more candles.
The meaning also depends on where the pattern forms. A bullish formation near a significant support level may have a different interpretation from the same formation in the middle of a strong uptrend.
For this reason, traders generally combine candlestick analysis with price levels, volume, trend analysis, and other technical tools.
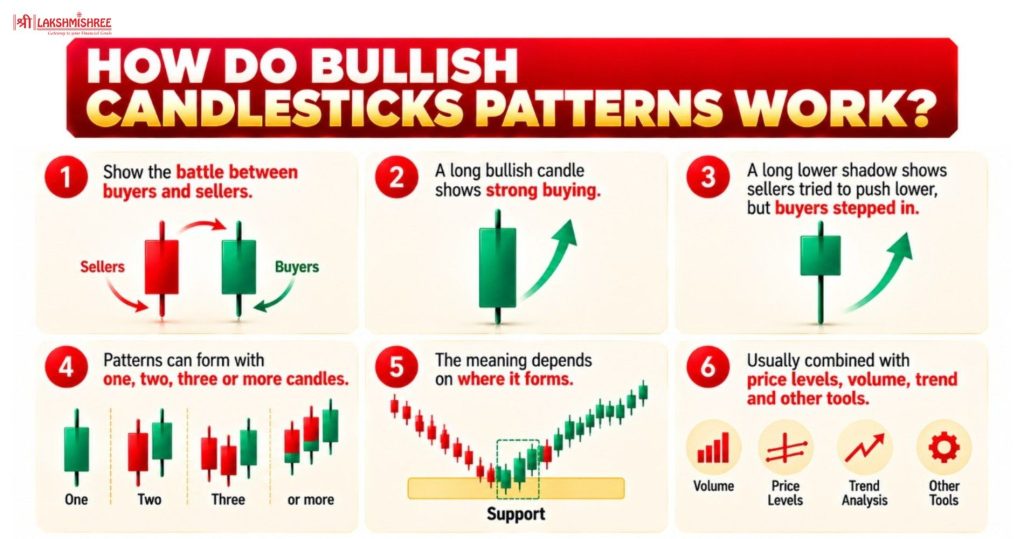
They can provide clues about buying pressure, potential reversals, and trend continuation. Their significance depends on where they appear and how price behaves afterward.
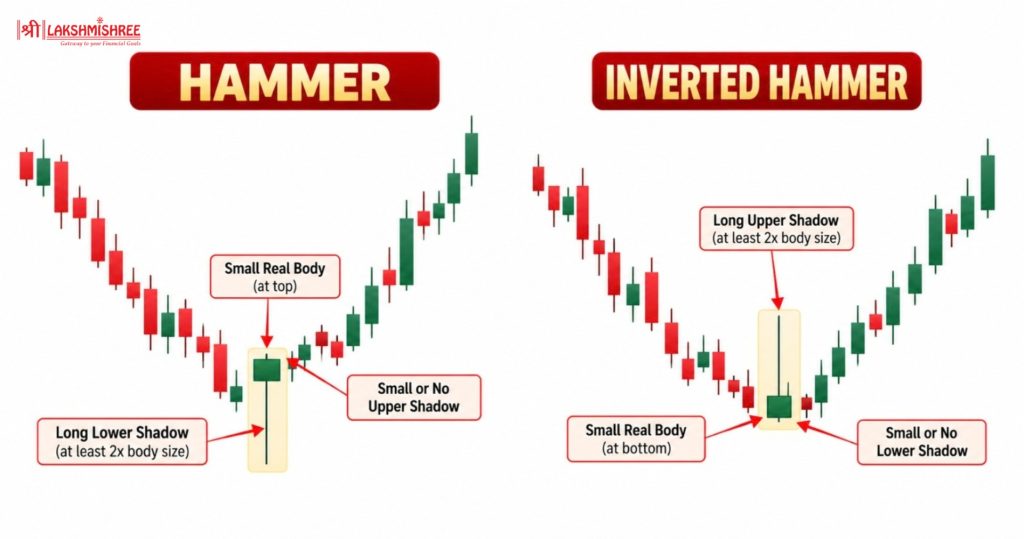
The Hammer and Inverted Hammer are single-candle patterns that can appear after a decline. Both have small real bodies and a prominent shadow, showing rejection of a price move.
The Hammer has a long lower shadow, while the Inverted Hammer has a long upper shadow. The difference helps traders identify how price was rejected during the session.
What Do Hammer and Inverted Hammer Indicate?
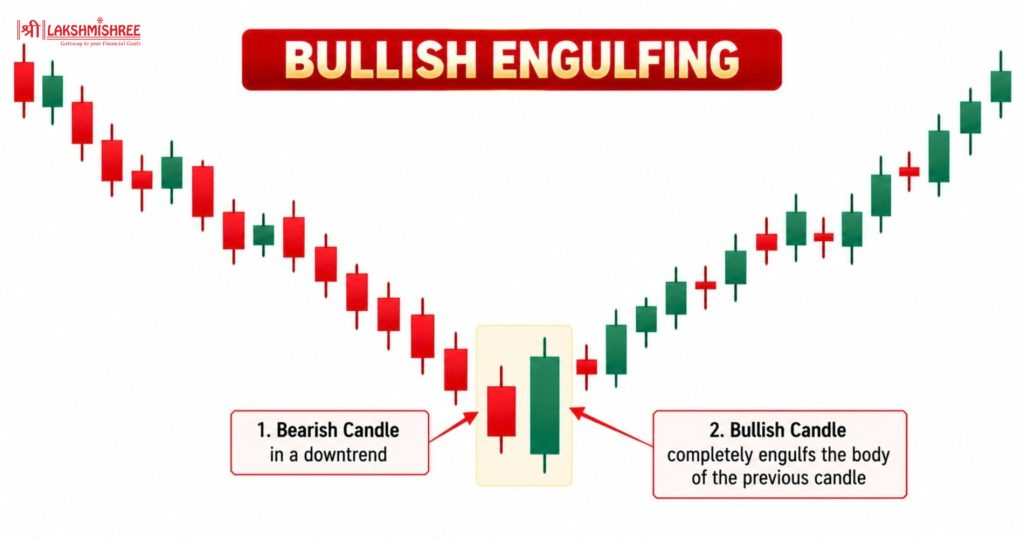
The Bullish Engulfing pattern consists of two candles and usually forms after a decline. A smaller bearish candle is followed by a larger bullish candle that completely engulfs its body.
What Does Bullish Engulfing Indicate?
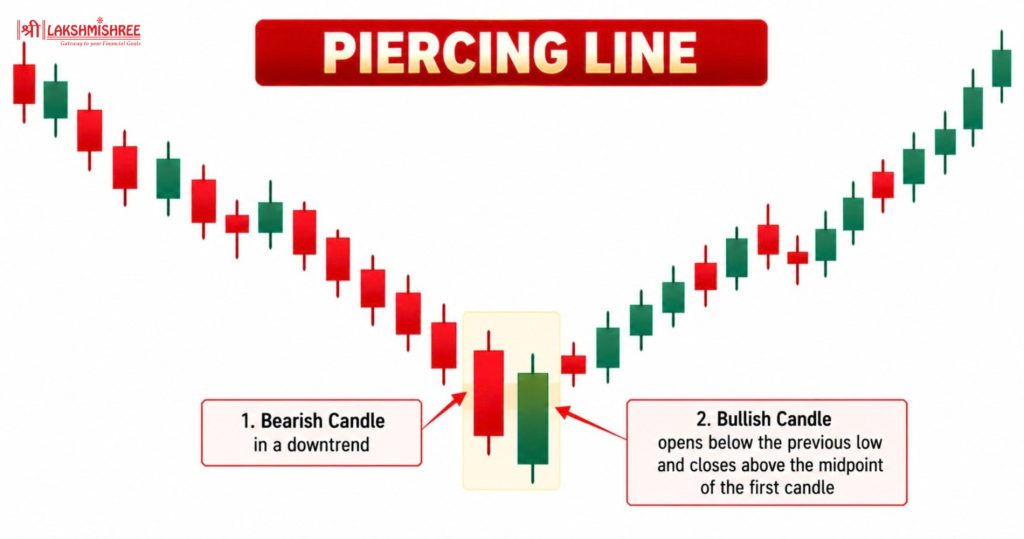
The Piercing Line is a two-candle bullish reversal pattern that generally appears after a decline. A strong bearish candle is followed by a bullish candle that opens below the previous close and closes above the midpoint of the bearish candle's body.
What Does Piercing Line Indicate?
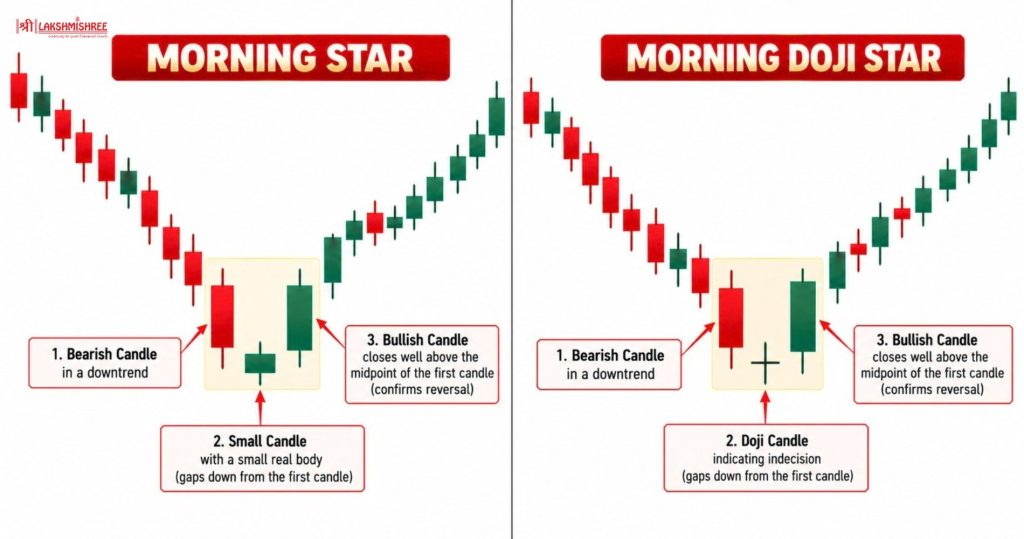
The Morning Star and Morning Doji Star are three-candle patterns that can form after a decline. Both begin with a bearish candle, followed by a small middle candle and a bullish third candle that moves well into the first candle's body.
The main difference is the middle candle. In a Morning Star, it has a small body. In a Morning Doji Star, it is a doji.
What Do Morning Star and Morning Doji Star Indicate?
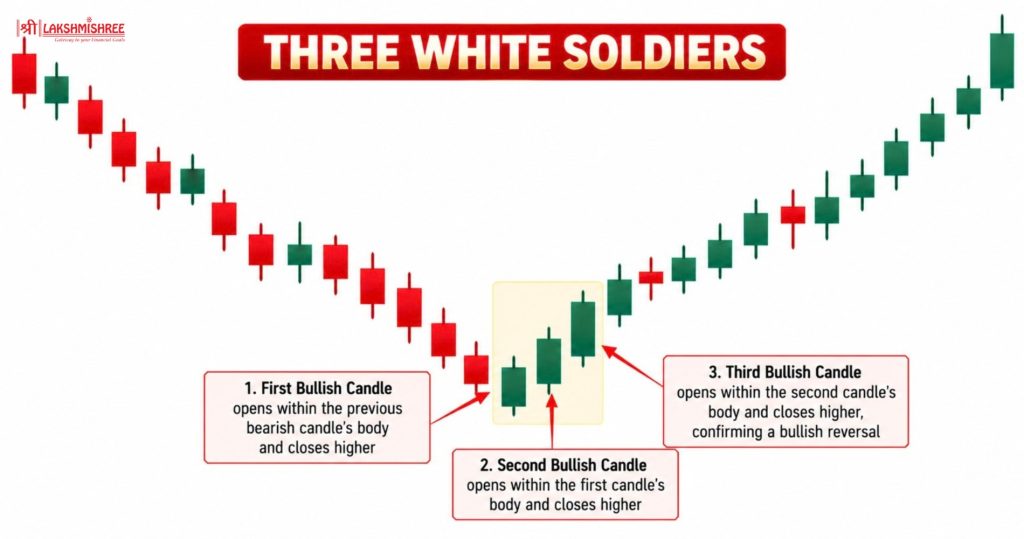
The Three White Soldiers pattern consists of three consecutive bullish candles. It can appear after a decline or during a developing bullish move.
Each candle generally closes higher than the previous one. The candles usually have strong bodies and open within or near the previous candle's body.
What Does Three White Soldiers Indicate?
Get Your Bullish Candlestick Patterns Guide
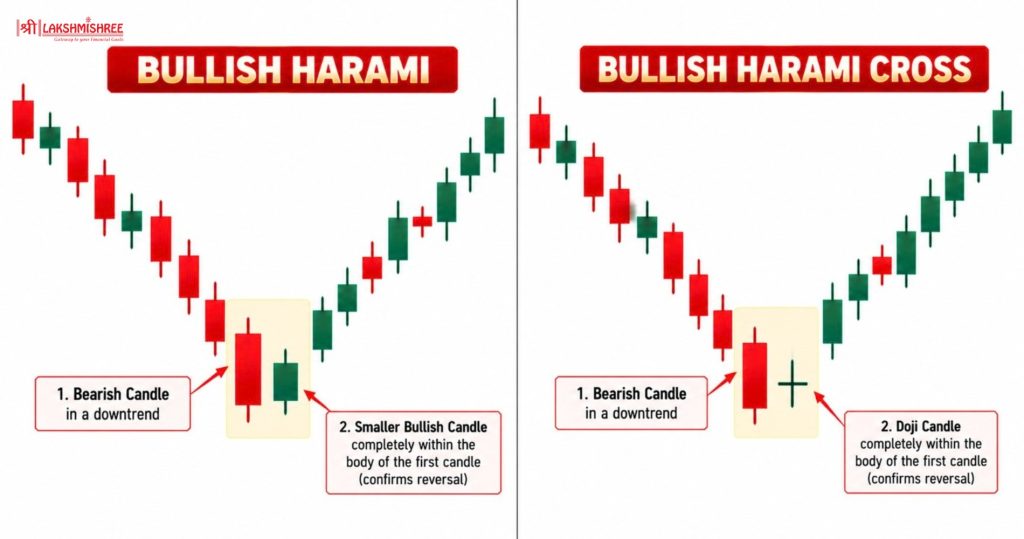
The Bullish Harami and Bullish Harami Cross are two-candle patterns that can appear after a decline. Both begin with a large bearish candle followed by a smaller candle that forms within its body.
The difference is the second candle. A Bullish Harami has a small bullish candle, while a Bullish Harami Cross has a doji.
What Do Bullish Harami and Bullish Harami Cross Indicate?
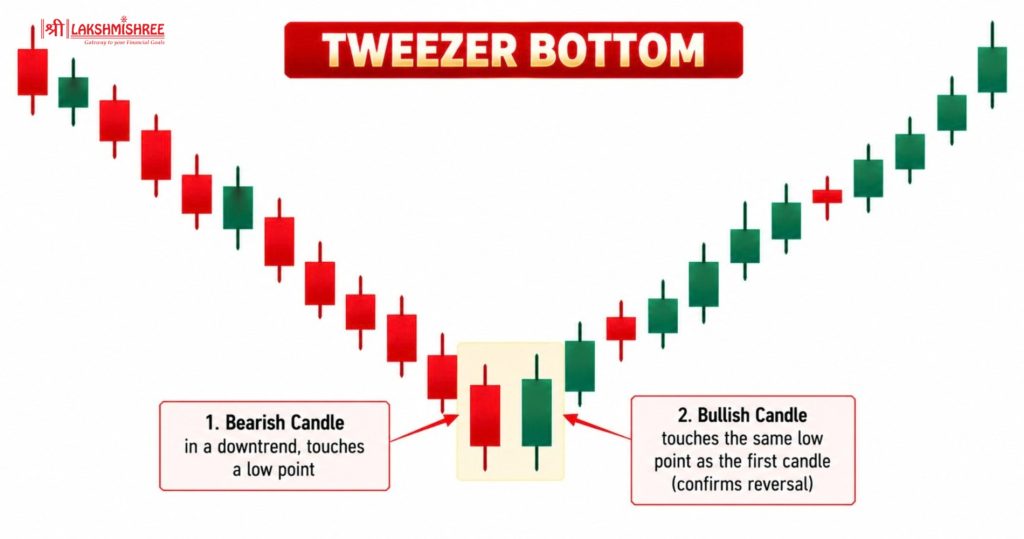
The Tweezer Bottom is a two-candle pattern that can form after a decline. Its defining feature is that both candles have lows at or near the same level.
The candles can differ in color and body size. The repeated low suggests that sellers were unable to push price below that level.
What Does Tweezer Bottom Indicate?
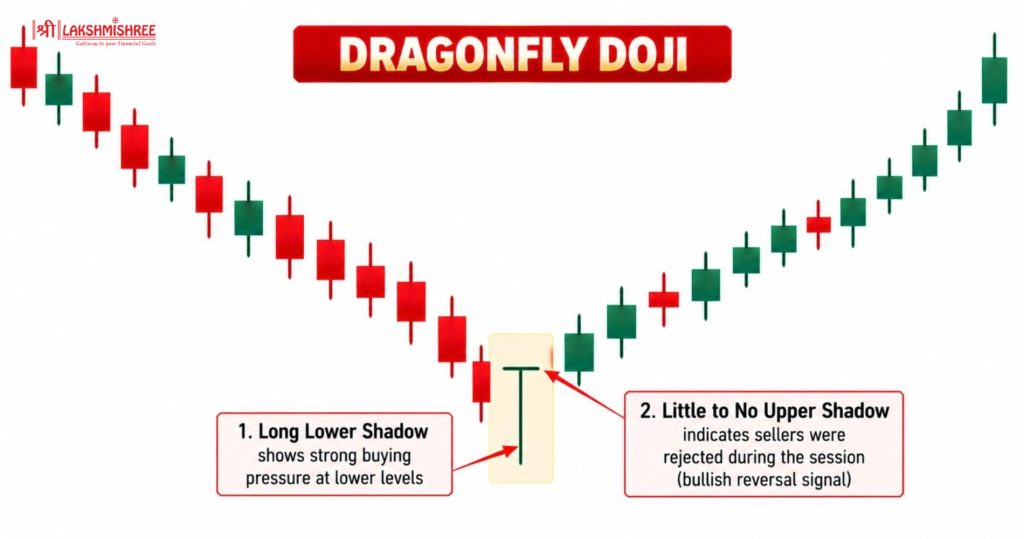
The Dragonfly Doji is a single-candle pattern with little or no real body and a long lower shadow. The open and close are near the high of the candle.
This structure shows that price moved lower during the session but recovered before the close.
What Does Dragonfly Doji Indicate?
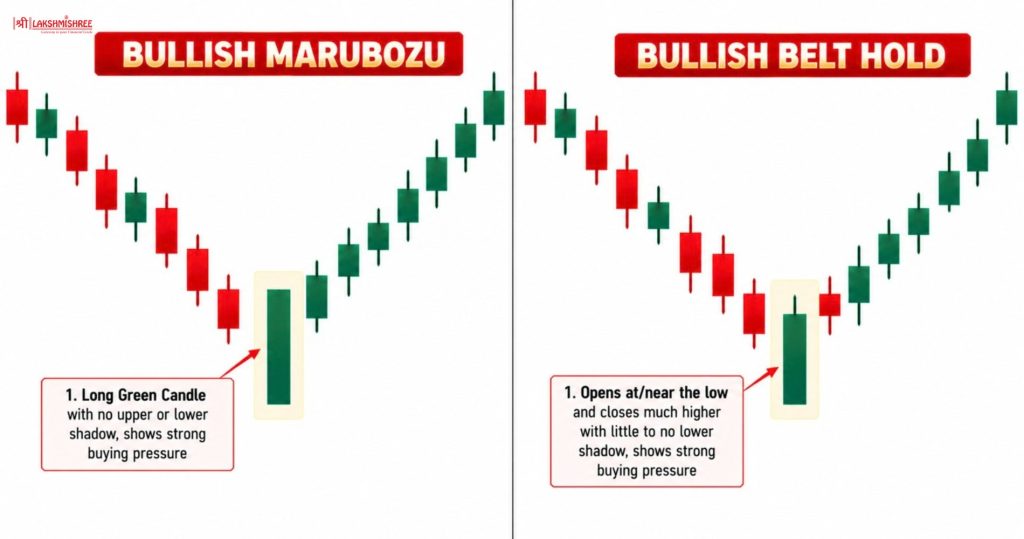
The Bullish Marubozu and Bullish Belt Hold are strong bullish candles. Both open near the low and close well above the opening price.
A Bullish Marubozu usually has little or no upper and lower shadows. A Bullish Belt Hold typically has little or no lower shadow.
What Do Bullish Marubozu and Bullish Belt Hold Indicate?
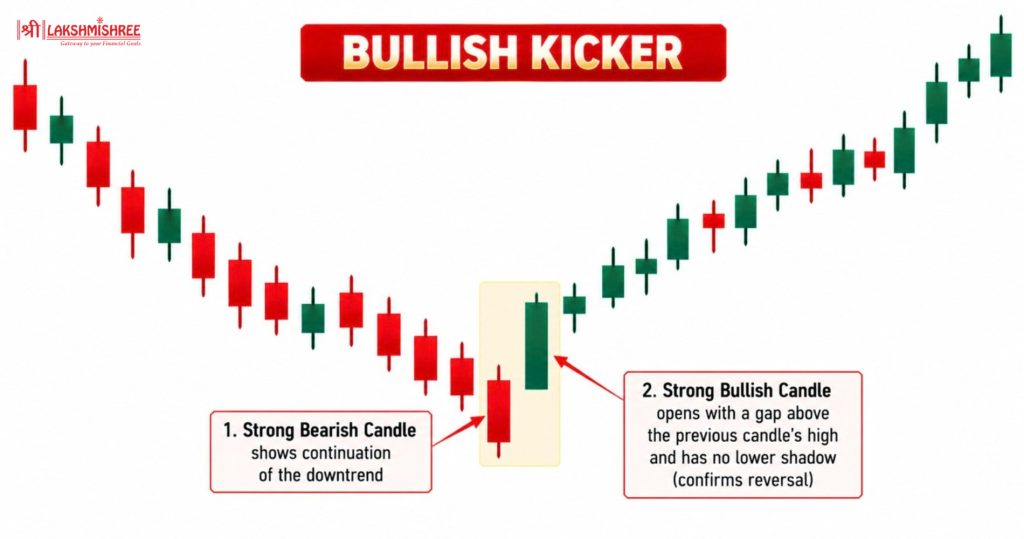
The Bullish Kicker is a two-candle pattern that can signal a sharp change in market sentiment. A bearish candle is followed by a strongly bullish candle that opens significantly higher, creating a gap.
The bullish candle then continues upward with a strong body.
What Does Bullish Kicker Indicate?
Get Your Bullish Candlestick Patterns Guide
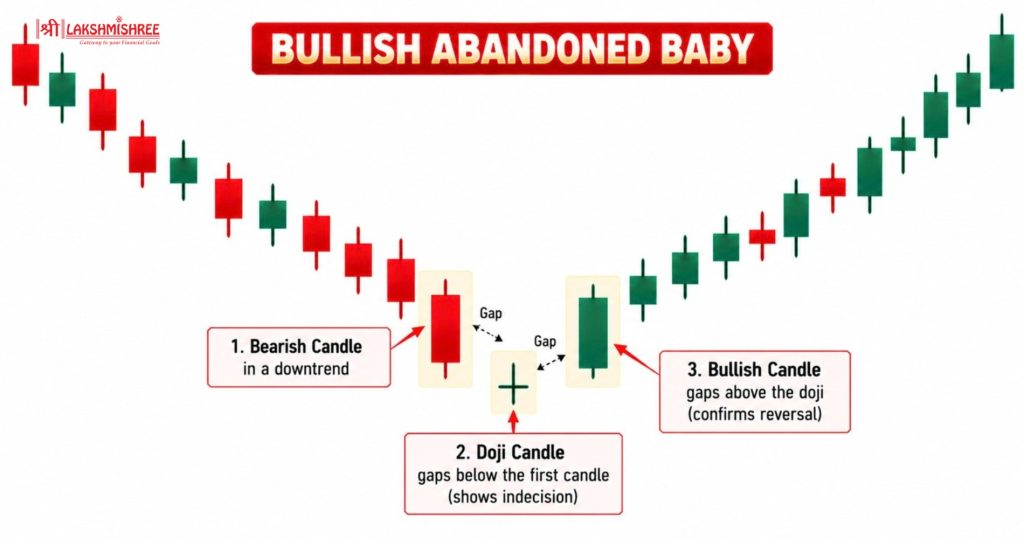
The Bullish Abandoned Baby is a three-candle reversal pattern that can appear after a decline. A bearish candle is followed by a doji, which is separated from the surrounding candles by gaps. A bullish candle then moves higher.
What Does Bullish Abandoned Baby Indicate?
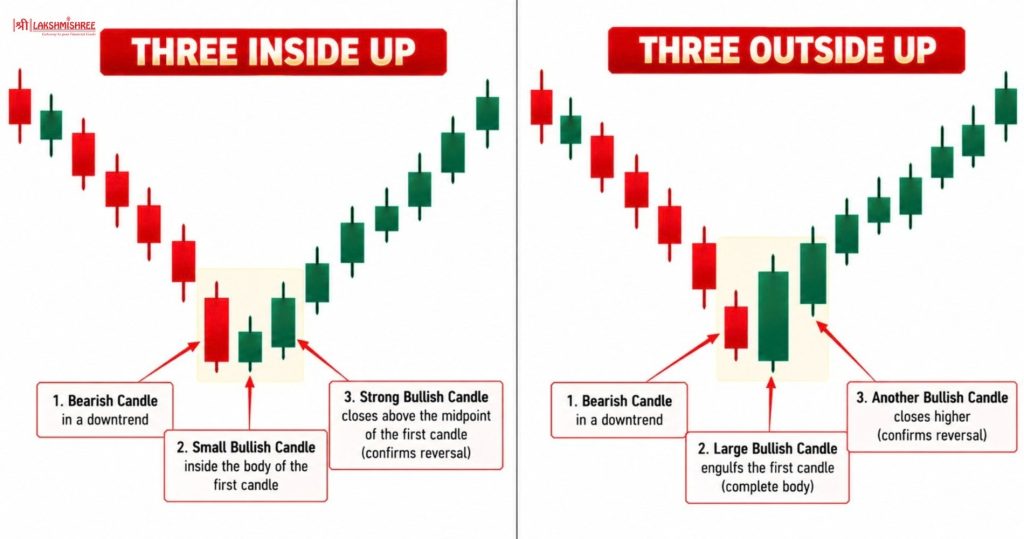
The Three Inside Up and Three Outside Up are three-candle bullish reversal patterns. Both begin with a bearish candle and end with a bullish confirmation candle.
In Three Inside Up, the second candle forms within the first candle's body. In Three Outside Up, the second candle completely engulfs the first candle's body.
What Do Three Inside Up and Three Outside Up Indicate?
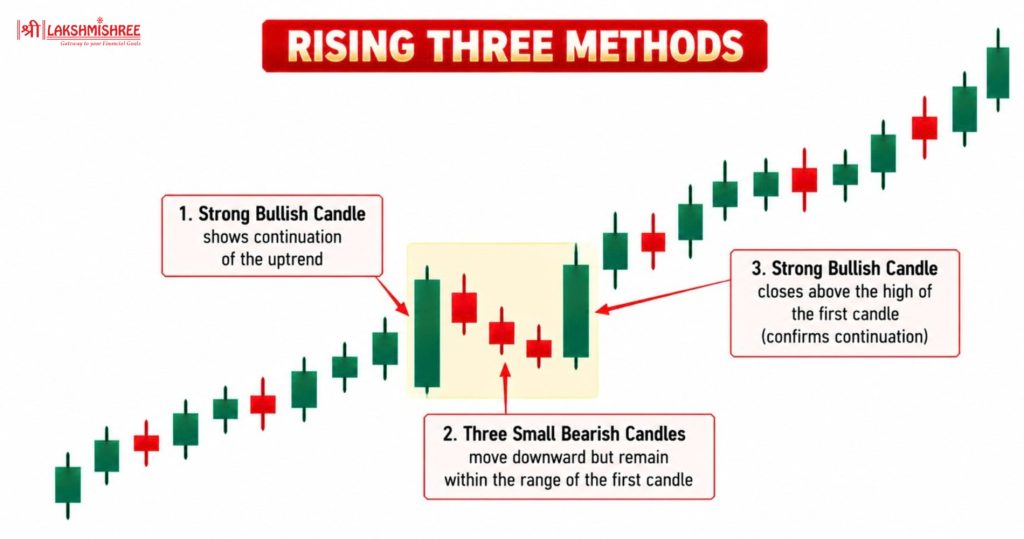
The Rising Three Methods is a bullish continuation pattern that usually forms within an uptrend. It starts with a strong bullish candle, followed by several smaller bearish candles.
The pullback remains within the broader range of the initial move. A final bullish candle then moves above the earlier high.
What Does Rising Three Methods Indicate?
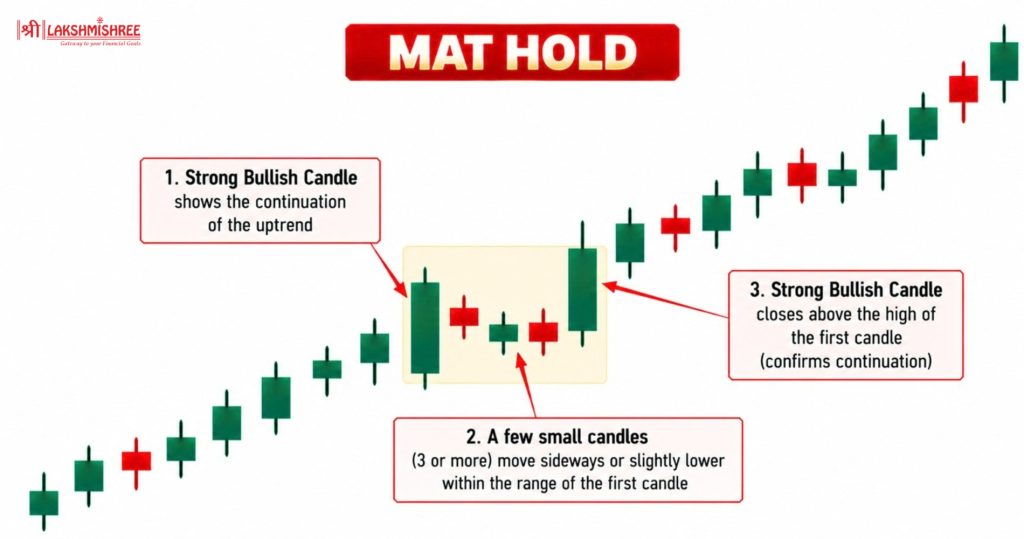
The Mat Hold is a bullish continuation pattern that typically develops within an established uptrend. It begins with a strong bullish candle, followed by several smaller candles that move against the trend.
The final bullish candle resumes the upward movement.
What Does Mat Hold Indicate?
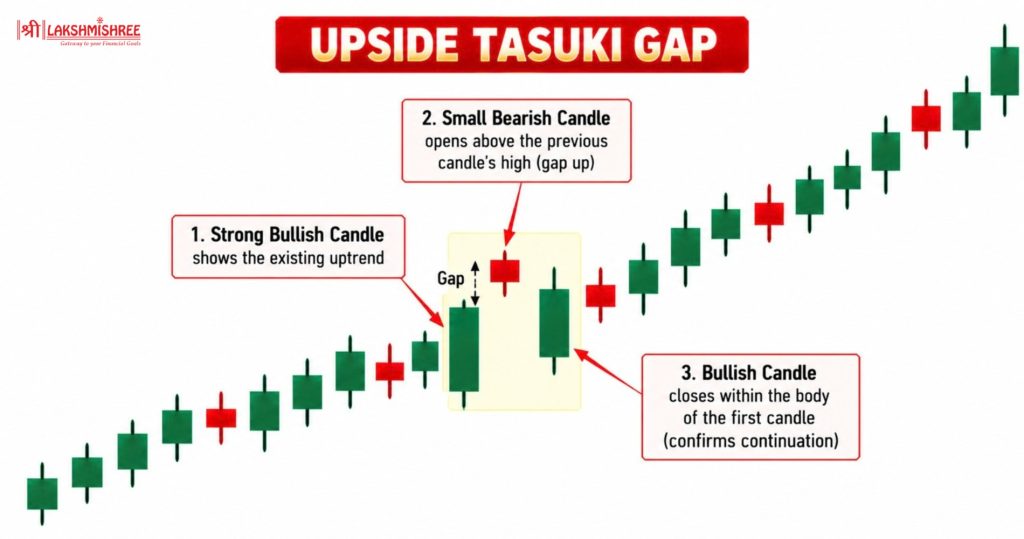
The Upside Tasuki Gap is a bullish continuation pattern that forms during an uptrend. Two bullish candles create an upward gap, followed by a bearish candle that moves into the gap without completely closing it.
What Does Upside Tasuki Gap Indicate?
Looking for a handy reference while analyzing charts? Download the Bullish Candlestick Patterns PDF Guide to review the patterns, market context, confirmation rules, and structural trade considerations in one place.
Learn more about best indicators for swing trading, best indicators for options trading and best indicators for intraday trading.

Related Reading: Candlestick Reversal Patterns: Bullish, Bearish & Trend Shifts | Mastering Price Action Trading: Tools and Patterns
These patterns can help traders understand changes in buying and selling pressure.
The 20 patterns covered in this guide range from simple formations such as the Hammer and Bullish Marubozu to multi-candle formations such as the Morning Star, Rising Three Methods, and Mat Hold.
The key is not to treat any pattern as a guaranteed trading signal.
Instead, consider the pattern's location, the surrounding price action, confirmation, and overall market conditions. Combining candlestick analysis with sound risk management can help traders make more structured decisions.
Keep the key rules within easy reach as you study and practice these setups. Download the above Bullish Candlestick Patterns PDF Guide and use it as a quick reference when reviewing bullish patterns on your charts.
Patterns such as the Hammer, Inverted Hammer, Bullish Engulfing, Piercing Line, Morning Star, Bullish Harami, and Tweezer Bottom can indicate a potential bullish reversal when they appear in an appropriate market context. A confirmation signal is generally needed before treating the formation as an established reversal.
Rising Three Methods, Mat Hold, and Upside Tasuki Gap are commonly associated with bullish continuation. These patterns generally occur within an existing upward trend rather than signaling a reversal from a decline.
Traders typically wait for confirmation before entering a trade. They may use the pattern's high for entry, place a stop-loss below a relevant support or swing low, and set a target near resistance. Position sizing and risk management should also be considered.
Yes. Beginners can learn candlestick patterns as part of their technical-analysis education. It is useful to first understand candlestick anatomy, market trends, support and resistance, and basic risk management before using patterns in live trading.
Disclaimer: This article is intended for educational purposes only. Please note that the data related to the mentioned companies may change over time. The securities referenced are provided as examples and should not be considered as recommendations.