
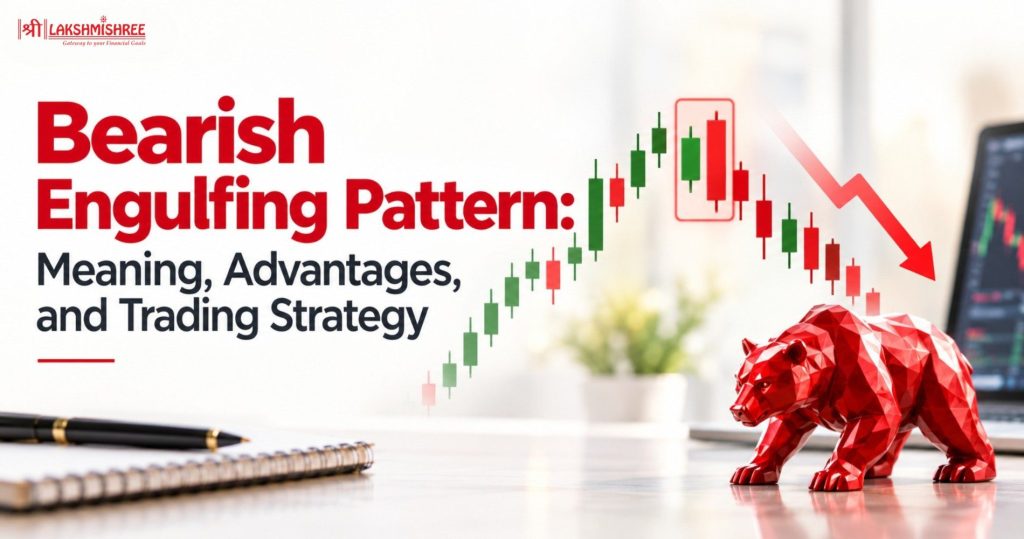
The bearish engulfing pattern is one of popular bearish candlestick patterns that traders use to identify potential downward price reversals. It appears when a bearish candle’s real body completely engulfs the previous bullish candle’s real body. This formation may indicate increasing selling pressure and a possible shift in market sentiment.
Understanding its structure, advantages, limitations, and trading applications can help you interpret price movements more effectively.
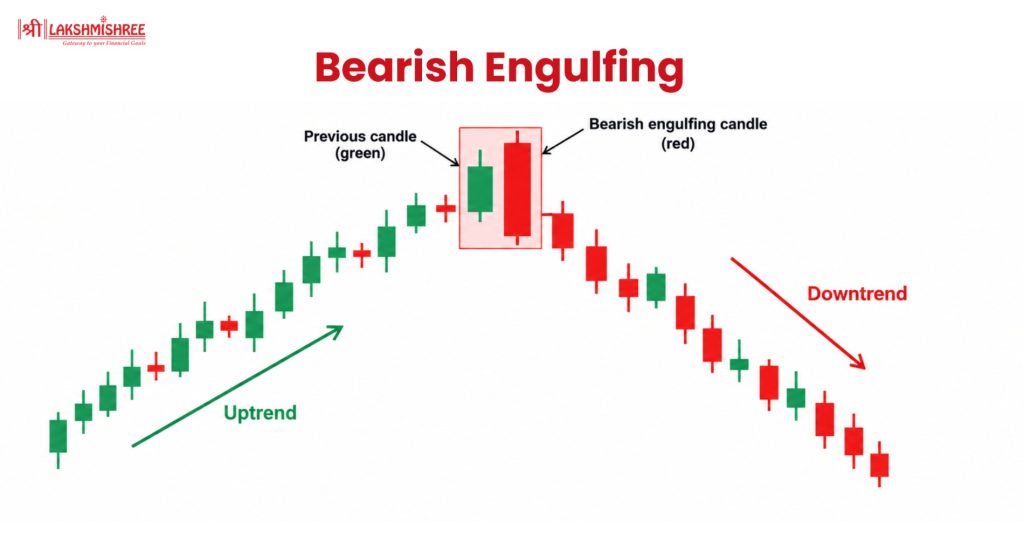
It is a two-candlestick formation in technical analysis that may signal a potential bearish reversal after an uptrend. The first candle is bullish, with a closing price higher than its opening price, while the second is bearish, with a lower closing price, and the real body completely engulfs the first candle’s real body.
This formation suggests a change in market sentiment. Buyers initially maintain control, but sellers subsequently push the price lower with enough strength to erase the previous candle’s real-body gains.
Traders can also use Chartink to create or explore stock scans for the pattern, helping them find potential setups for further analysis.
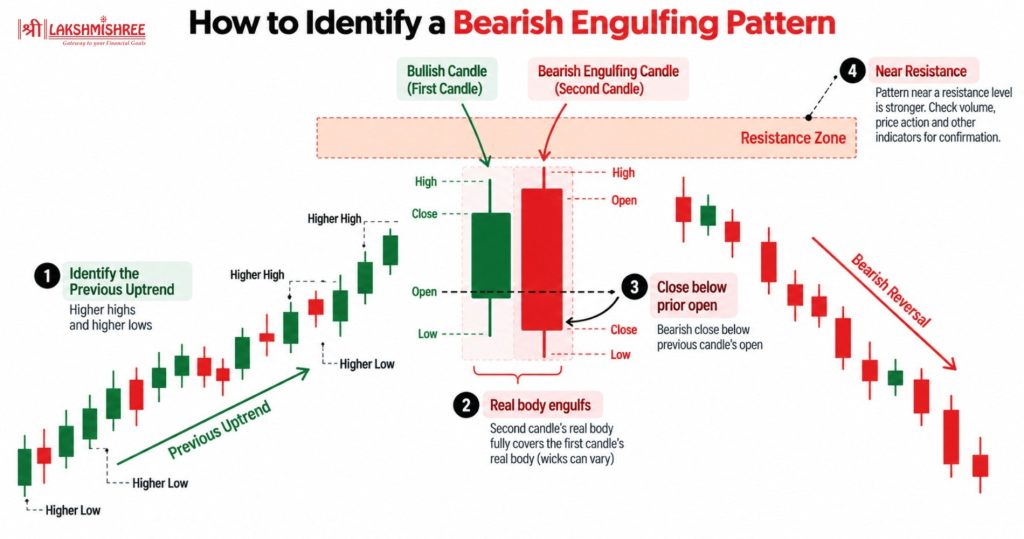
Identifying a bearish engulfing involves examining the candlesticks, preceding trend, and market context. These factors help traders recognize potential bearish reversal signals.
Look for an upward price movement marked by higher highs and higher lows. It is generally more significant when it appears after an uptrend.
The first candle is bullish, while the second is bearish. The second candle’s real body must engulf the first candle’s real body, although their wicks do not need to be covered.
The bearish candle should close below the previous bullish candle’s opening price, indicating increased selling pressure. Opening prices may vary across markets, so focus on the real-body relationship.
The pattern near a resistance level may strengthen its potential as a bearish reversal signal. Check trading volume, price action, and technical analysis indicators to assess confirmation. These candlestick chart patterns are more useful when evaluated alongside the broader market trend.
Related Reading: Candlestick Reversal Patterns: Bullish, Bearish & Trend Shifts | Mastering Price Action Trading: Tools and Patterns | Bearish Patterns: 22 Bearish Candlestick Patterns to Know
| Timeframe | Trading Style | Key Features |
| 5-minute and 15-minute | Intraday trading | Helps identify short-term bearish reversal signals but may produce more false signals. |
| 1-hour | Intraday trading | Offers a broader view of price action while capturing potential intraday reversals. |
| 4-hour | Swing trading | Helps identify potential reversals near resistance levels with less short-term market noise. |
| Daily | Swing or positional trading | Supports analysis of broader trends and potential bearish reversal patterns. |
| Weekly | Long-term trading | Helps assess major market trends and possible long-term changes in sentiment. |
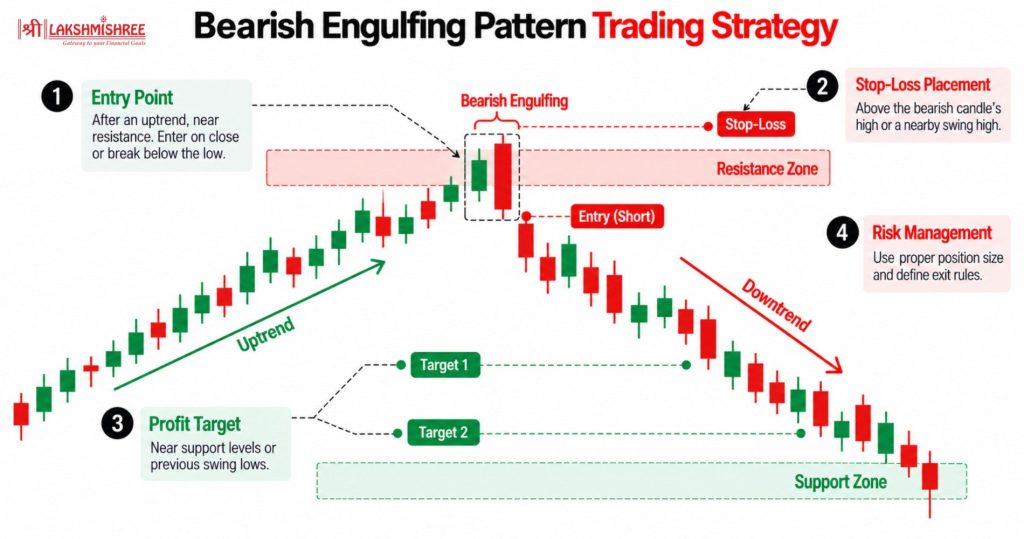
A bearish engulfing candlestick pattern trading strategy combines entry rules, stop-loss placement, profit targets, and risk management to help traders make informed decisions.
Identify the pattern after an uptrend, preferably near a resistance level. Wait for the bearish candlestick to close and engulf the previous bullish candle’s real body. Traders may enter after bearish confirmation or a break below the pattern’s low.
Consider placing a stop-loss above the bearish engulfing candle’s high or a nearby swing high. Adjust the level according to price action and market volatility. Remember that stop-loss orders cannot eliminate all trading risks.
Set targets near support levels, previous swing lows, or a predefined risk-to-reward ratio.
Choose an appropriate position size and define exit rules before entering a trade. Combine candlestick chart patterns with trading volume and technical analysis indicators where relevant. Test your strategy on historical data and avoid risking more than you can afford to lose.
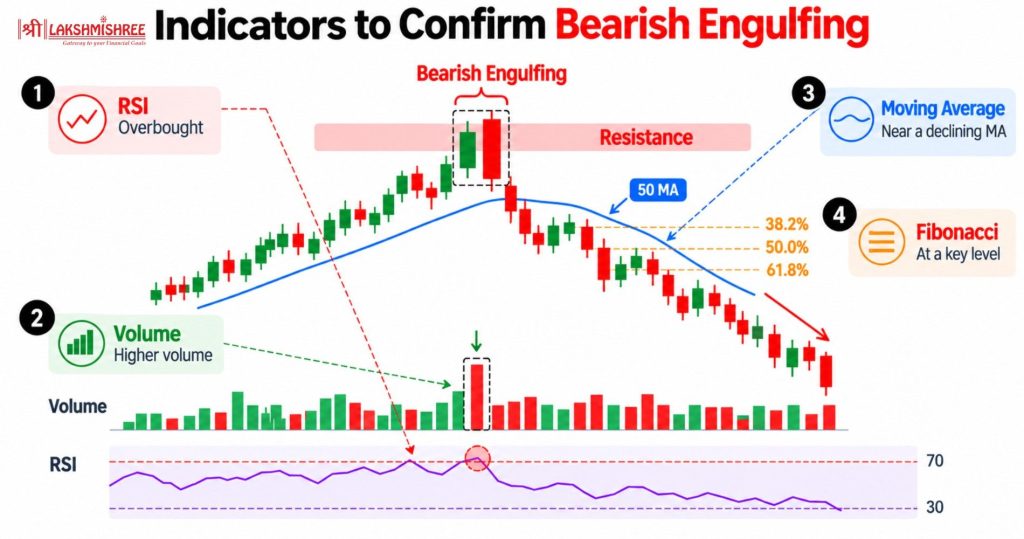
Technical indicators can help traders assess the market conditions surrounding a bearish engulfing candlesticks pattern. However, no indicator guarantees that the price will decline.
The Relative Strength Index measures the speed and magnitude of recent price movements. An elevated RSI reading may suggest strong upward momentum that could be losing strength. However, overbought conditions can persist during a strong uptrend.
Above-average volume during the bearish candle may indicate greater participation in the downward move. Traders can compare the candle’s volume with recent sessions to assess whether selling activity is unusually high.
Moving averages help identify the broader price trend. The pattern near a declining moving average or a resistance area may deserve further examination.
Fibonacci retracement levels help identify potential support and resistance zones during a price movement. If this pattern forms near a key Fibonacci retracement level, it may strengthen the potential reversal setup. Traders should still wait for confirmation rather than relying on the level alone.
Important: Support and resistance are essential concepts in technical analysis, even though they are not technical indicators themselves. If you don't know how to draw these levels, first read support and resistance and learn the basics before risking your money.
Learn more about best indicators for swing trading, best indicators for options trading and best indicators for intraday trading.
| Feature | Bearish Engulfing | Bullish Engulfing |
| Candle sequence | Bullish followed by bearish | Bearish followed by bullish |
| Typical context | After an uptrend | After a downtrend |
| Potential signal | Downside reversal | Upside reversal |
| Sentiment shift | Buyers to sellers | Sellers to buyers |
| Confirmation | Continued downward movement | Continued upward movement |

| Bearish pattern | Features |
| Shooting Star | A small real body near the lower end of the candle range, with a long upper wick, typically appearing after an upward move. |
| Evening Star | A three-candle formation that may signal a bearish reversal after an uptrend. |
| Dark Cloud Cover | A bearish candle closes below the midpoint of the previous bullish candle’s real body. |
| Three Black Crows | Three consecutive bearish candles that may indicate sustained selling pressure. |
| Bearish Harami | A small real body forms within the previous bullish candle’s real body. |
The bearish engulfing pattern is a useful candlestick formation for identifying potential changes in market sentiment.
Its two-candle structure makes it relatively easy to recognize, but its interpretation depends on the preceding trend, surrounding price levels, and confirmation signals.
Understanding its advantages, limitations, and suitable timeframes can help you build a more disciplined approach to technical analysis. Combining the pattern with risk management and a tested trading strategy is essential because no candlestick formation guarantees a profitable outcome.
This pattern can indicate increasing selling pressure, particularly after an uptrend. However, it is not automatically a sell signal. Traders should consider the broader trend, resistance levels, and confirmation from subsequent price action before deciding whether a trade fits their strategy.
Yes. The pattern can appear during a downtrend, but its traditional reversal interpretation is most relevant after an upward price movement. Within an established downtrend, traders may interpret it as a possible continuation of selling pressure rather than a fresh bearish reversal.
The best timeframe depends on the trading approach. Intraday traders may examine 5-minute or 15-minute charts, while swing traders may prefer 4-hour or daily charts. Weekly charts can provide a broader perspective. No timeframe guarantees a more profitable signal.
Yes, traders use this pattern in forex, stock, commodity, and cryptocurrency markets. Its effectiveness depends on market conditions, the timeframe, and confirmation signals such as trading volume, price action, and resistance levels.
Bearish engulfing forms when the second bearish candle’s real body completely engulfs the previous bullish candle’s real body. In contrast, a bearish harami forms when a smaller candle’s real body lies within the previous bullish candle’s real body. Both may signal a potential bearish reversal, but their structures differ.
Disclaimer: This article is intended for educational purposes only. Please note that the data related to the mentioned companies may change over time. The securities referenced are provided as examples and should not be considered as recommendations.