
Bearish patterns can help you spot potential price declines, recognize shifts in market sentiment, and identify possible trading opportunities. However, each pattern tells a different story about the balance between buyers and sellers. Knowing how to read these formations can help you distinguish potential reversals from signals that an existing downtrend may continue.
This guide covers 22 bearish candlestick patterns, explaining what each one looks like, what it may indicate, and how traders can confirm the signal before making a trading decision.
Bearish candlestick patterns are easier to learn when you can see the entry, stop-loss and target rules side by side. Download our free 22-pattern handbook to keep every pattern and its trading setup handy as you read.
Bearish candlestick patterns are formations that signal increasing selling pressure or a potential price decline. Traders analyze candle shapes, price movements, and market context to identify possible shifts in momentum.
A long upper shadow may indicate price rejection, while a strong bearish candle suggests sellers are gaining control. However, no pattern guarantees a decline, so traders should look for confirmation from subsequent price action.
Bearish reversal patterns such as Shooting Star candlestick, Bearish Engulfing, and Evening Star pattern suggest an uptrend may turn downward.
Bearish continuation patterns such as Falling Three Methods indicate that an existing downtrend may resume after a brief pause.
Recognizing the difference between the two can help you interpret bearish patterns in the context of the prevailing trend.
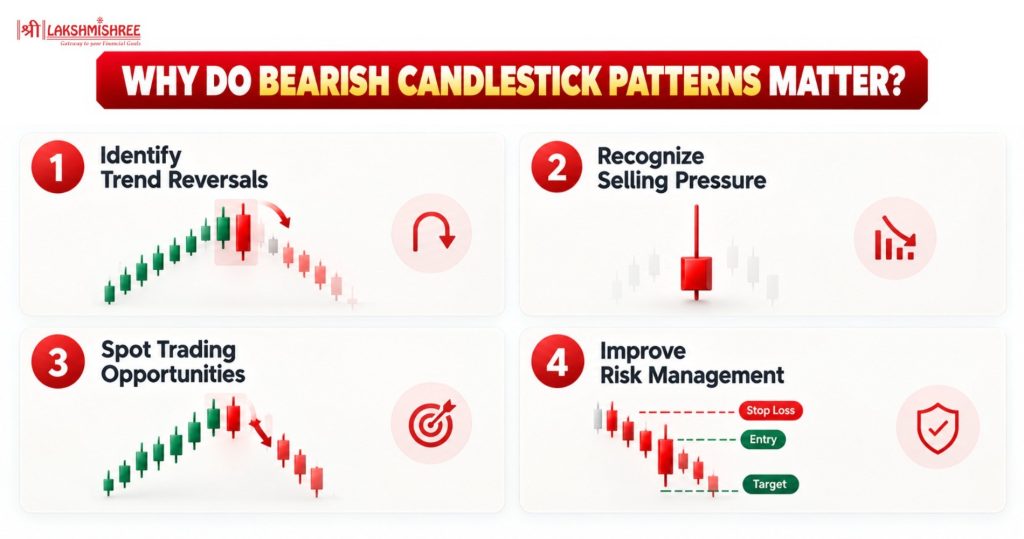
Bearish candlestick patterns vary in appearance and interpretation. Some indicate a possible reversal after an upward move, while others suggest that an existing downtrend may continue.
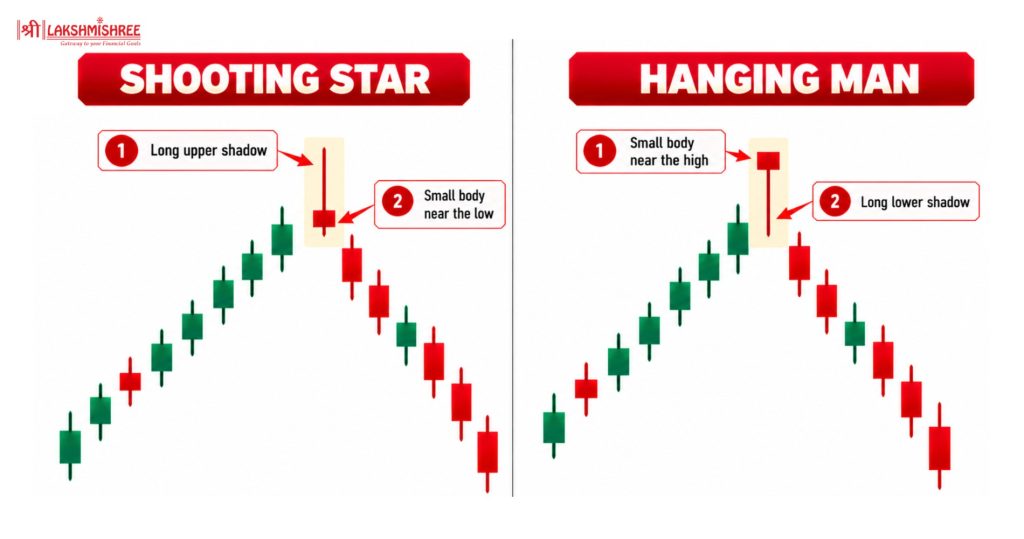
The Shooting Star appears after an uptrend. It has a small body near the bottom and a long upper wick. The Hanging Man candlestick also appears after an uptrend. It has a small body near the top and a long lower wick.
What Do These Patterns Indicate?
You should look for a bearish candle after either pattern to confirm the signal.
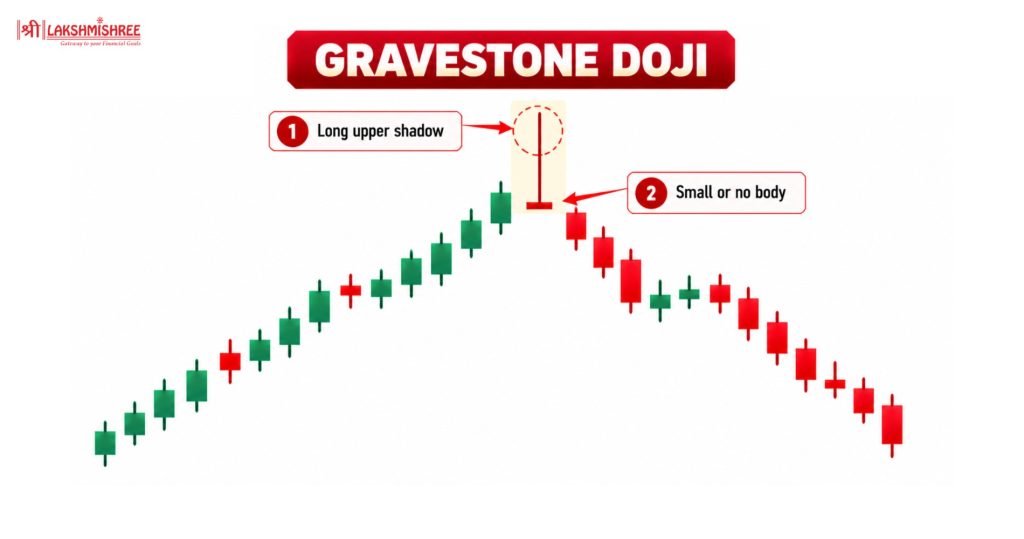
The Gravestone Doji has a long upper wick and little or no body. It shows that prices rose but closed near the opening level.
What Does the Pattern Indicate?
You should look for a bearish candle after the pattern, especially near resistance.
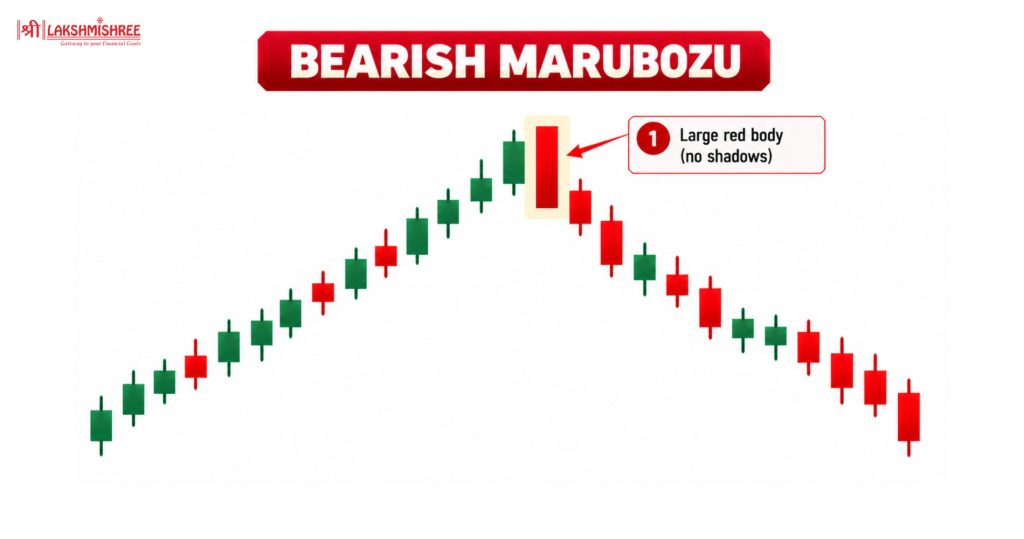
A Bearish Marubozu is a long bearish candle with little or no wicks. It shows strong selling throughout the session.
What Does the Pattern Indicate?
You should check the next candle and trading volume for confirmation.
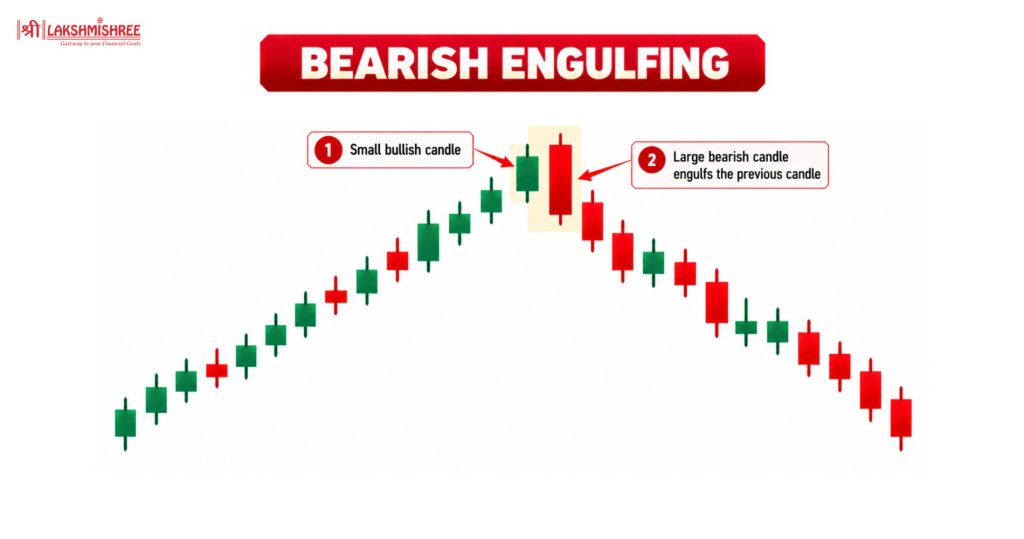
The Bearish Engulfing pattern has two candles. A large bearish candle completely covers the previous bullish candle's body.
What Does the Pattern Indicate?
You should look for further price declines to confirm the signal.
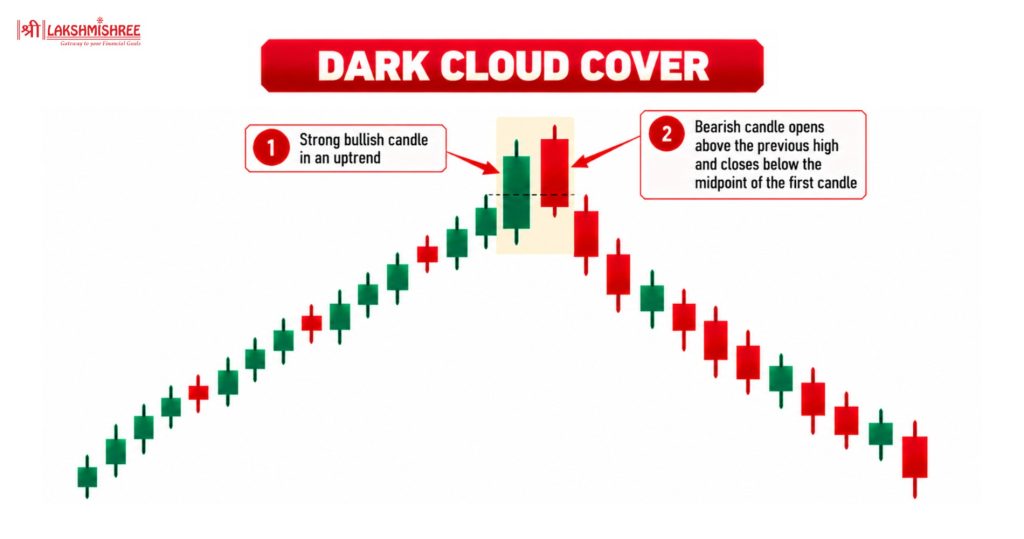
Dark Cloud Cover is a two-candle bearish reversal pattern. A bearish candle opens above the previous bullish candle's high and closes below its midpoint.
What Does the Pattern Indicate?
You should look for a bearish follow-up candle for confirmation.
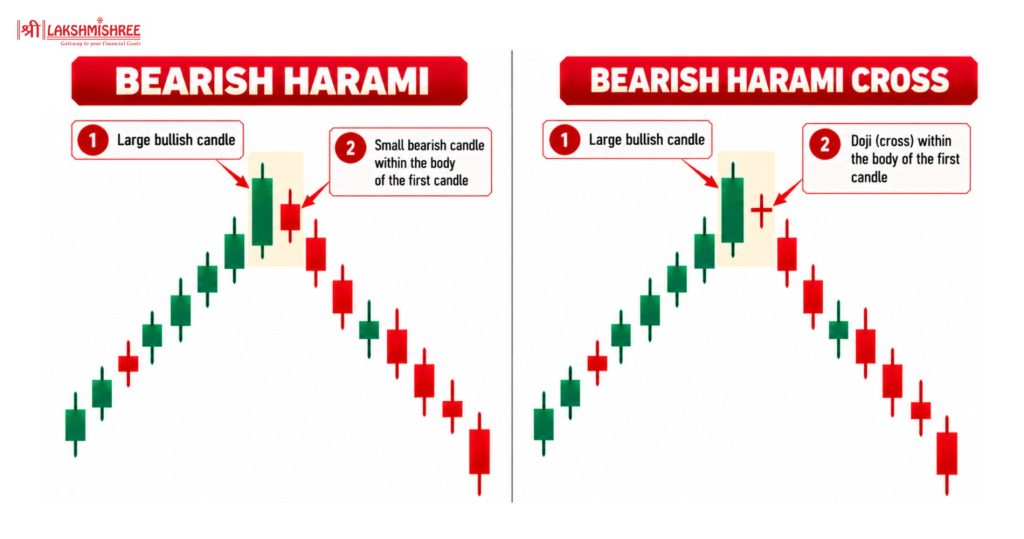
The Bearish Harami consists of a large bullish candle followed by a smaller bearish candle inside its body. The Bearish Harami Cross is similar, but the second candle is a Doji, showing market uncertainty.
What Do These Patterns Indicate?
You should wait for a bearish candle to confirm the signal.
QUICK REFERENCE GUIDE
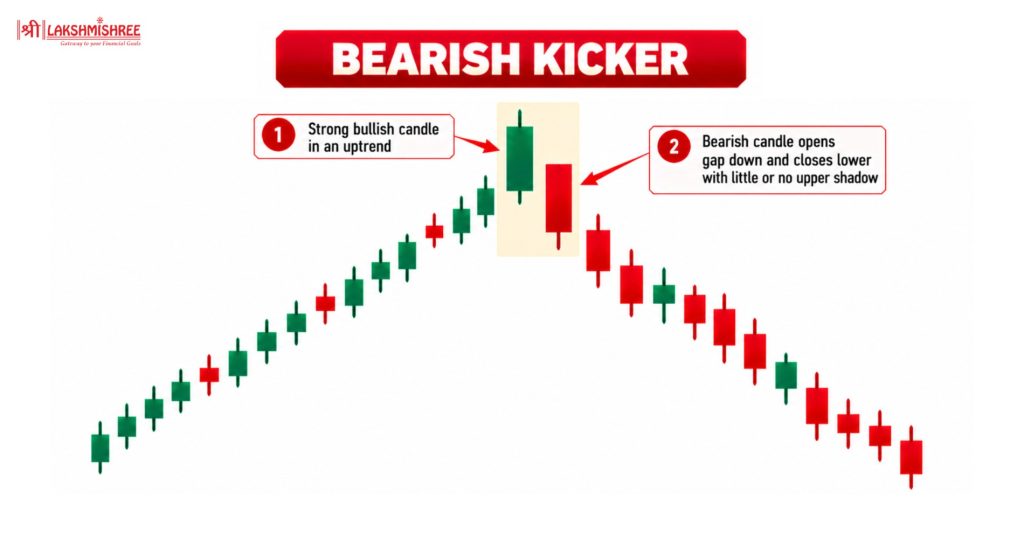
The Bearish Kicker consists of a bullish candle followed by a strong bearish candle that opens lower, often with a gap.
What Does the Pattern Indicate?
You should check price movement and volume to assess the signal.
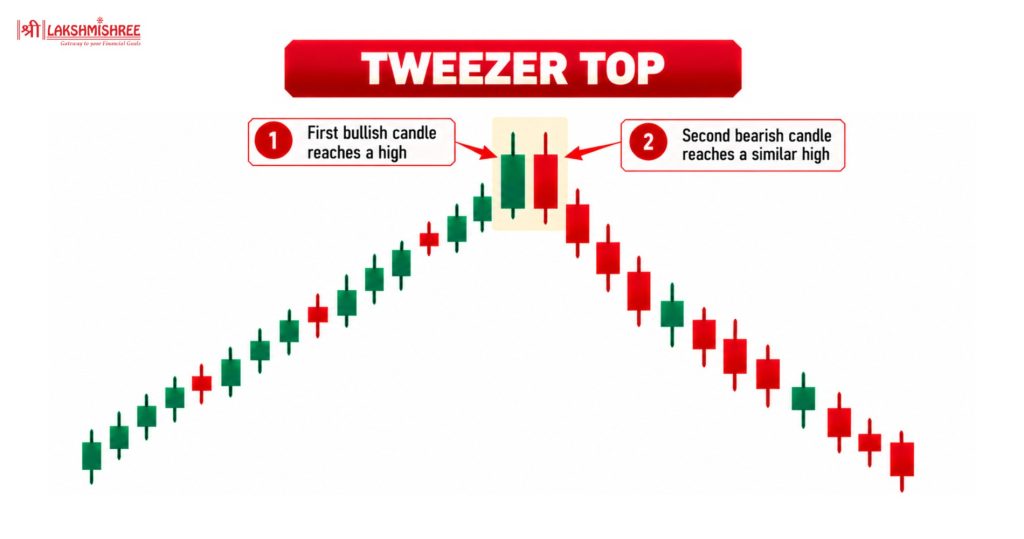
The Tweezer Top forms when two candles reach nearly the same high. It often appears after an uptrend.
What Does the Pattern Indicate?
You should look for a bearish candle after the matching highs.
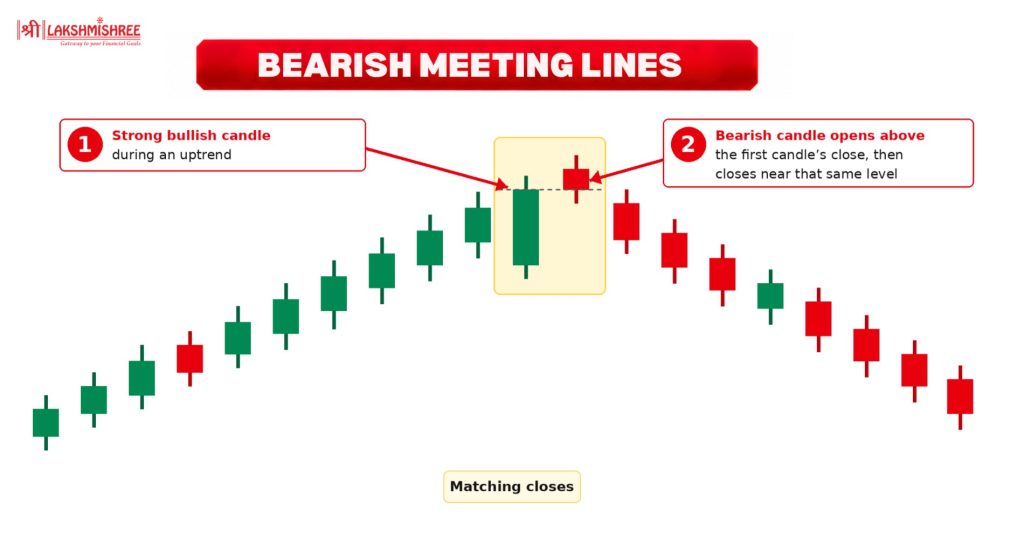
This pattern has a bullish candle followed by a bearish candle. The second candle closes near the first candle's closing price.
What Does the Pattern Indicate?
You should look for further price declines, especially near resistance.
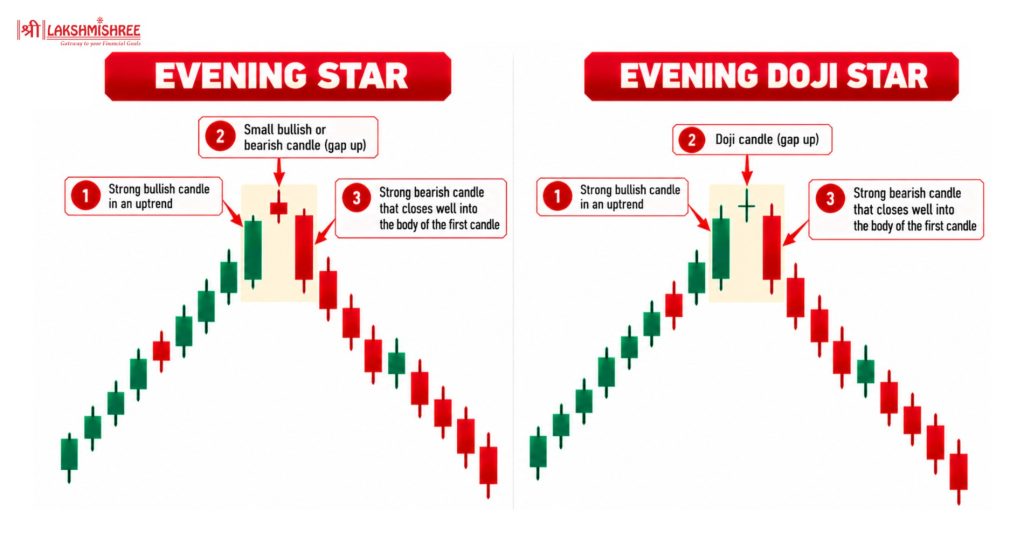
The Evening Star is a three-candle reversal pattern. It consists of a bullish candle, a small-bodied candle, and a strong bearish candle. The Evening Doji Star follows a similar structure, but the middle candle is a Doji.
What Do These Patterns Indicate?
You should check whether the final bearish candle closes well inside the first candle's body.
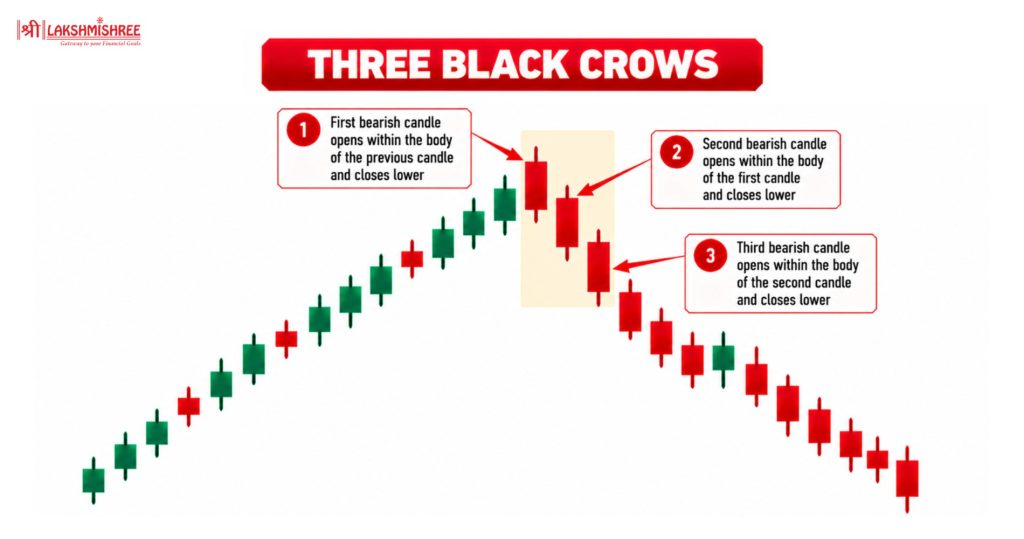
Three Black Crows consists of three consecutive bearish candles. Each candle generally closes lower than the previous one.
What Does the Pattern Indicate?
You should check the candle structure, volume, and nearby support levels.
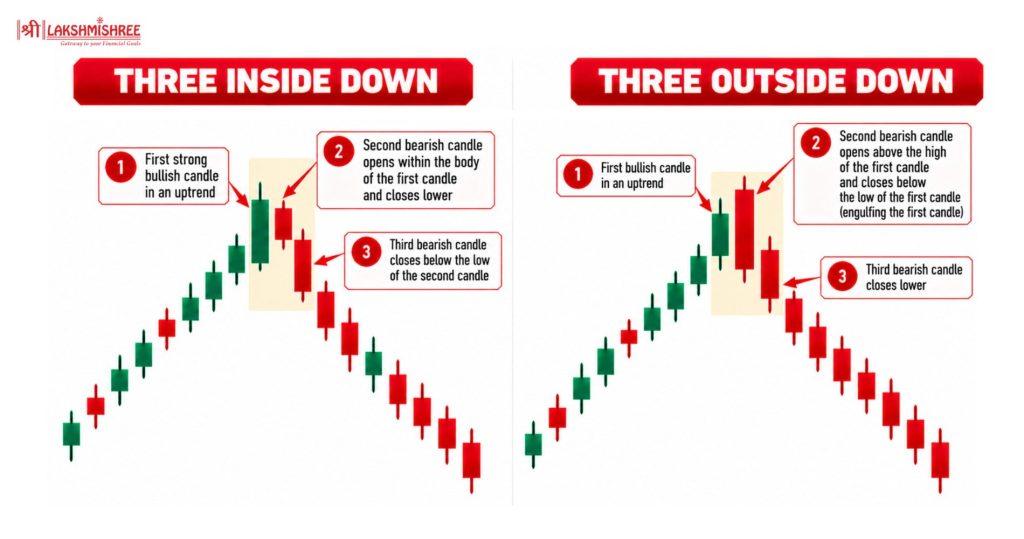
Three Inside Down begins with a Bearish Harami, followed by a bearish candle that closes below the first candle's low. Three Outside Down begins with a Bearish Engulfing pattern, followed by another bearish candle.
What Do These Patterns Indicate?
You should look for the final bearish candle to confirm the reversal.
QUICK REFERENCE GUIDE
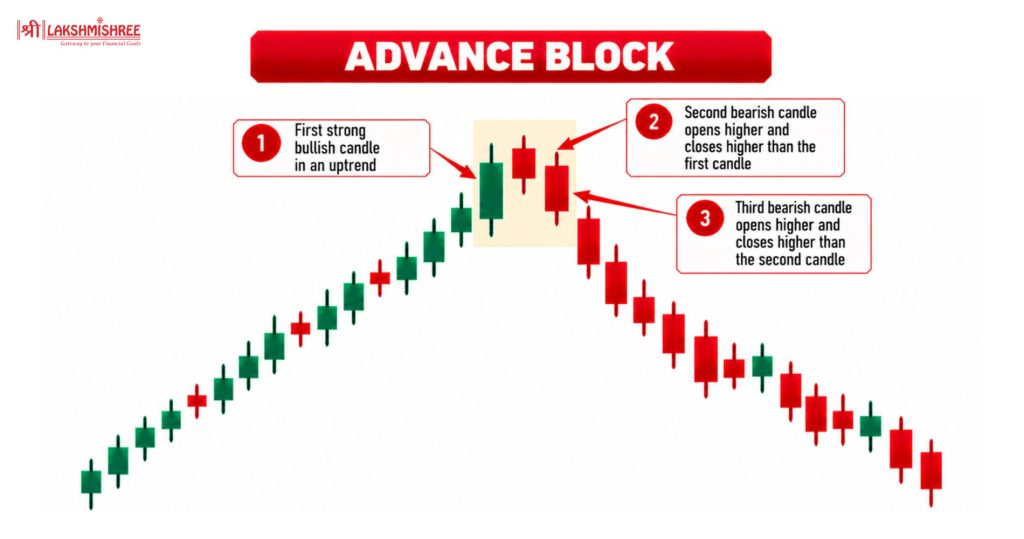
The Advance Block forms during an uptrend. It consists of three bullish candles that show weakening upward momentum, often with smaller bodies or longer upper wicks.
What Does the Pattern Indicate?
You should look for bearish price action after the pattern.
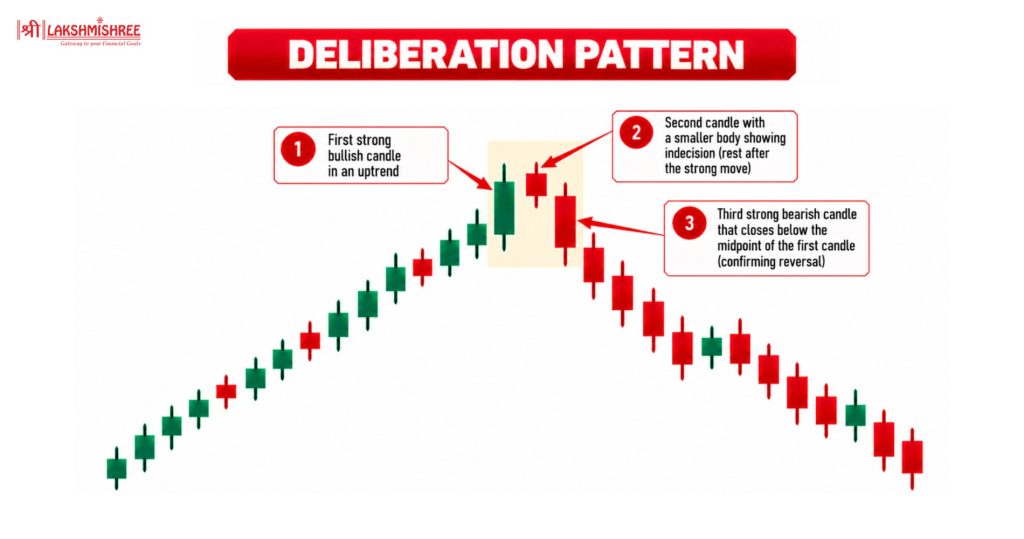
The Deliberation pattern forms during an uptrend. It usually has three bullish candles, with the final candle showing limited progress.
What Does the Pattern Indicate?
You should wait for bearish price action and check nearby resistance.
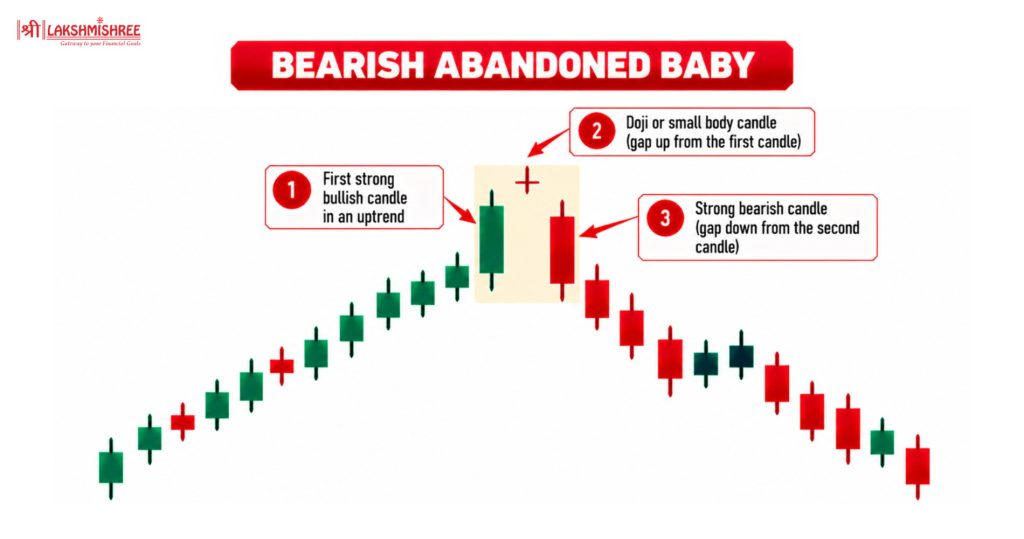
The Bearish Abandoned Baby is a three-candle reversal pattern. A Doji appears between two candles, with gaps separating it from both candles.
What Does the Pattern Indicate?
You should check the gaps and the final bearish candle for confirmation.
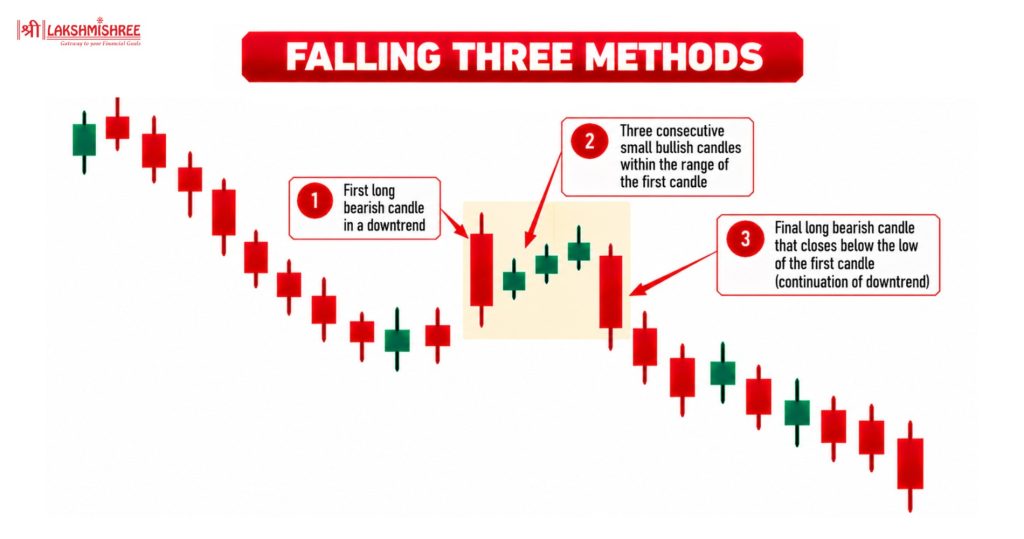
The Falling Three Methods is a bearish continuation pattern. A long bearish candle is followed by smaller candles moving upward or sideways, then another strong bearish candle.
What Does the Pattern Indicate?
You should check whether the final bearish candle closes below the first candle's low.
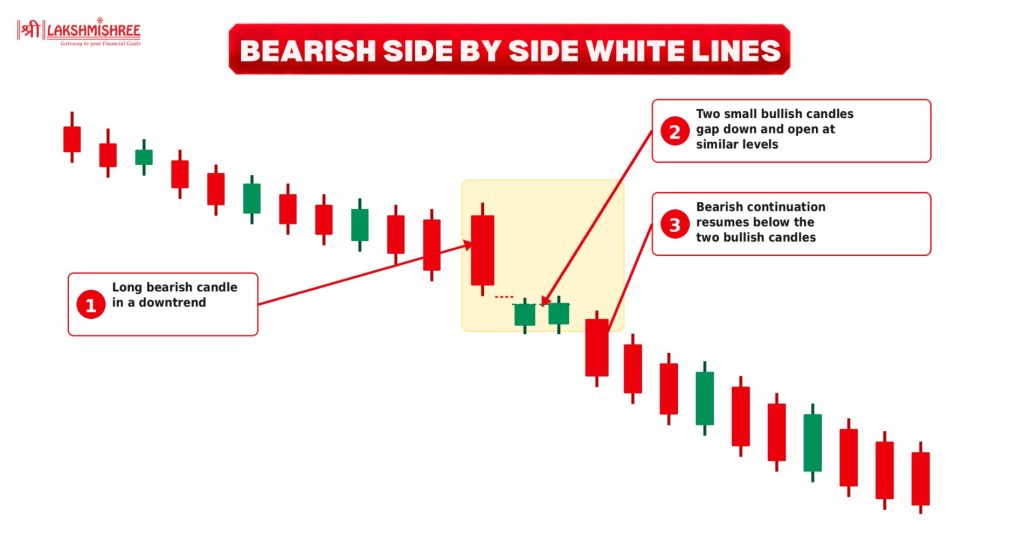
This pattern appears during a downtrend. It features two similar bullish candles, often opening at a similar level after a gap down.
What Does the Pattern Indicate?
You should look for renewed selling after the bullish candles.
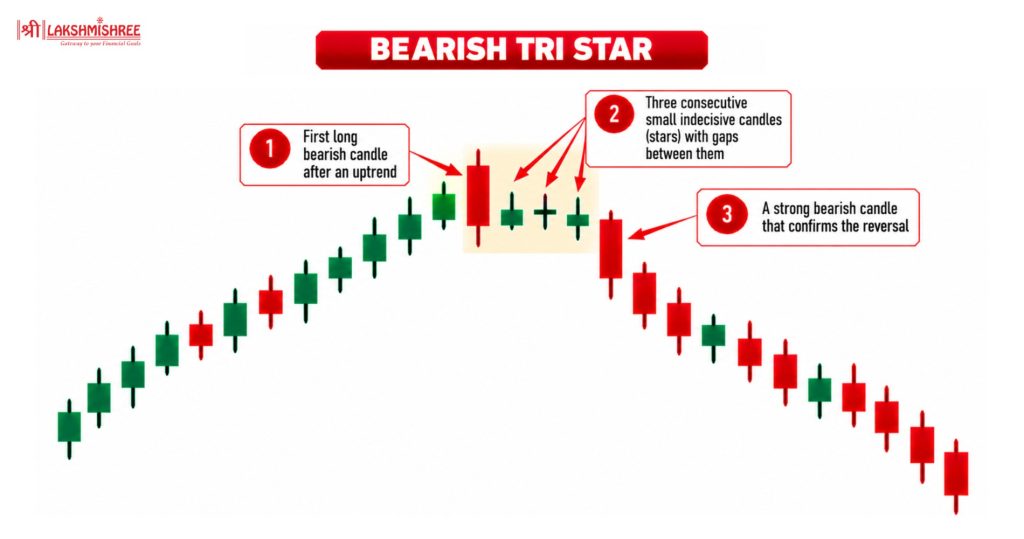
The Bearish Tri-Star consists of three Doji candles. It can appear after an uptrend and signals uncertainty in the market.
What Does the Pattern Indicate?
You should look for a bearish candle after the three Doji candles.
Want all 22 patterns in one place? Our downloadable handbook gives you a simple chart for each pattern, along with where to enter, where to place your stop-loss, where to aim for your target, and what confirms or invalidates the setup.
Learn more about best indicators for swing trading, best indicators for options trading and best indicators for intraday trading.

Related Reading: Candlestick Reversal Patterns: Bullish, Bearish & Trend Shifts | Mastering Price Action Trading: Tools and Patterns
Bearish patterns can help you recognize selling pressure, evaluate potential trend reversals, and identify situations where an existing downtrend may continue. Understanding formations such as the Shooting Star, Bearish Engulfing, Evening Star and others provides a useful foundation for candlestick chart analysis.
However, recognizing a pattern is only one part of the process. You should consider the prevailing trend, nearby support and resistance, trading volume confirmation, and subsequent price action before making a decision.
By combining bearish candlestick patterns with a consistent trading strategy and sound risk management, beginners can develop a more structured approach to interpreting price charts. The goal is not to predict every market move, but to assess potential opportunities and risks more carefully.
Keep these patterns within reach while you analyse charts. Download the 22 Bearish Candlestick Patterns handbook, with a quick-reference cheat sheet and a final checklist to run through before every trade.
Commonly studied bearish patterns include the Shooting Star, Bearish Engulfing, Hanging Man candlestick, Dark Cloud Cover, Evening Star, and Three Black Crows. Each has different formation criteria and should be interpreted in context.
Bearish reversal patterns suggest that an uptrend may turn downward. Bearish continuation patterns suggest that an existing downtrend may resume after a temporary pause or recovery.
Traders look for bearish candle patterns near resistance or after an uptrend, then wait for confirmation from price action or trading volume. They may enter a short trade, set a stop-loss above the pattern’s high, and use suitable risk management to limit potential losses.
Yes. Traders use candlestick analysis across stocks, forex, cryptocurrencies, commodities, and other markets. However, differences in trading hours, liquidity, volatility, and price gaps can affect how patterns form and how they should be interpreted.
Traders commonly use RSI, moving averages, MACD, trading volume, and support and resistance levels to evaluate bearish signals. These tools provide supporting information but do not guarantee a price decline.
Disclaimer: This article is intended for educational purposes only. Please note that the data related to the mentioned companies may change over time. The securities referenced are provided as examples and should not be considered as recommendations.