
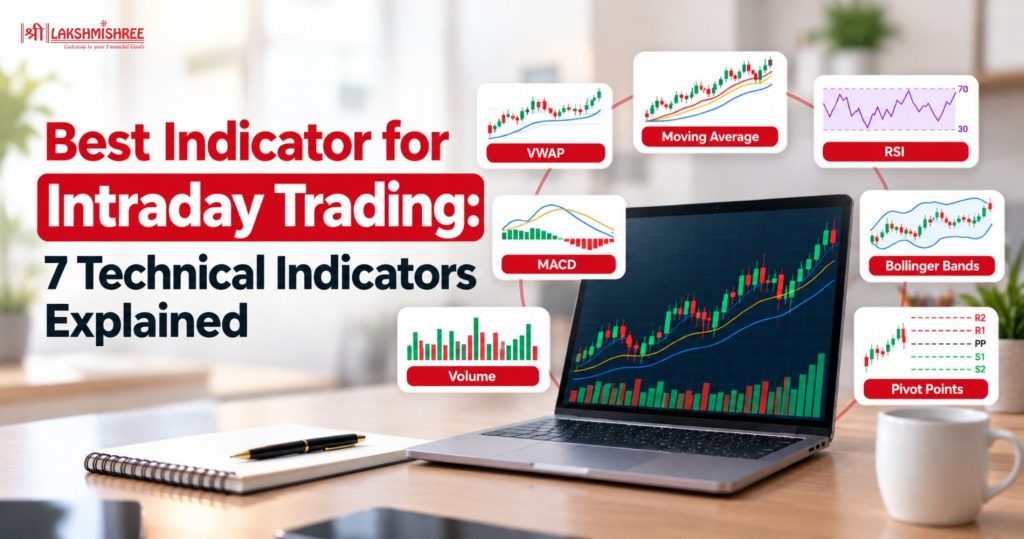
Intraday trading requires traders to make quick decisions based on price movement, volume, and market trends. Using the best indicator for intraday trading can help traders identify trends, momentum, volatility, and important price levels more clearly.
Different indicators serve different purposes. Some help track trends, while others measure momentum, volatility, volume, or support and resistance.
This guide covers seven of the most useful intraday trading indicators and explains how traders can use them in a simple and practical way.
Want a quick, practical reference while applying these indicators on an intraday chart? Download our 7 Intraday Indicators Guide for indicator settings, chart signals, and practical guidance on identifying entry, stop-loss, and target levels.
Intraday indicators are tools that help traders analyze price, trend, momentum, volatility, and trading activity and can be grouped based on what they help traders analyze:
These categories also overlap. For example, MACD can provide both trend and momentum information, while VWAP combines price and volume to help traders understand intraday price levels.
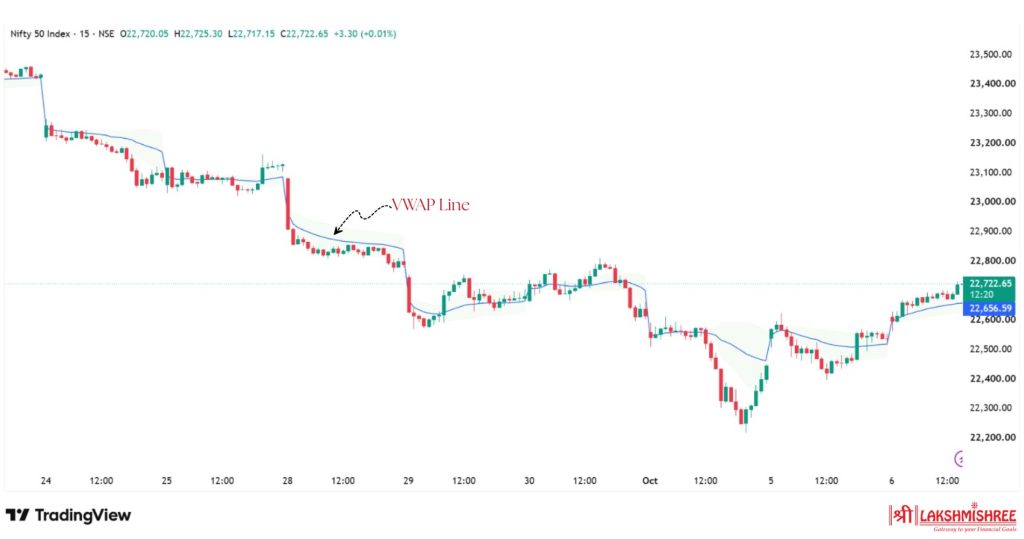
VWAP (Volume Weighted Average Price) shows the average price of an asset based on both price and trading volume during a trading session.
Intraday traders use VWAP to understand whether the current price is trading above or below the session's average price.
VWAP can help identify intraday trends and potential price reaction levels. However, it should not be used alone as a buy or sell signal.
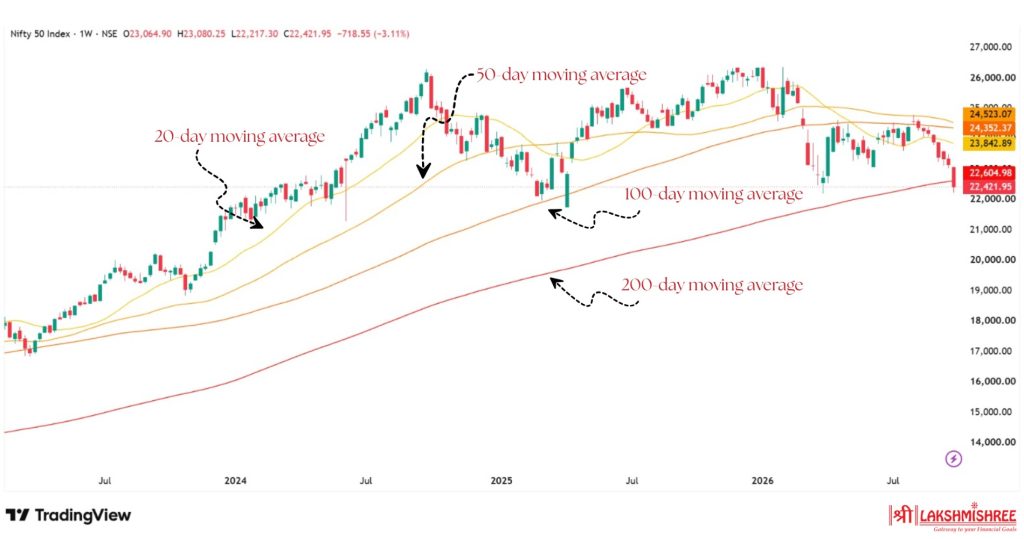
A Moving Average (MA) smooths price data and helps traders identify the overall market trend.
Two common types are:
Intraday traders use moving averages to:
However, moving averages use past price data, so they can lag during fast market moves. They may also give weaker signals in sideways markets.
The right MA period depends on the trading strategy, timeframe, and instrument.
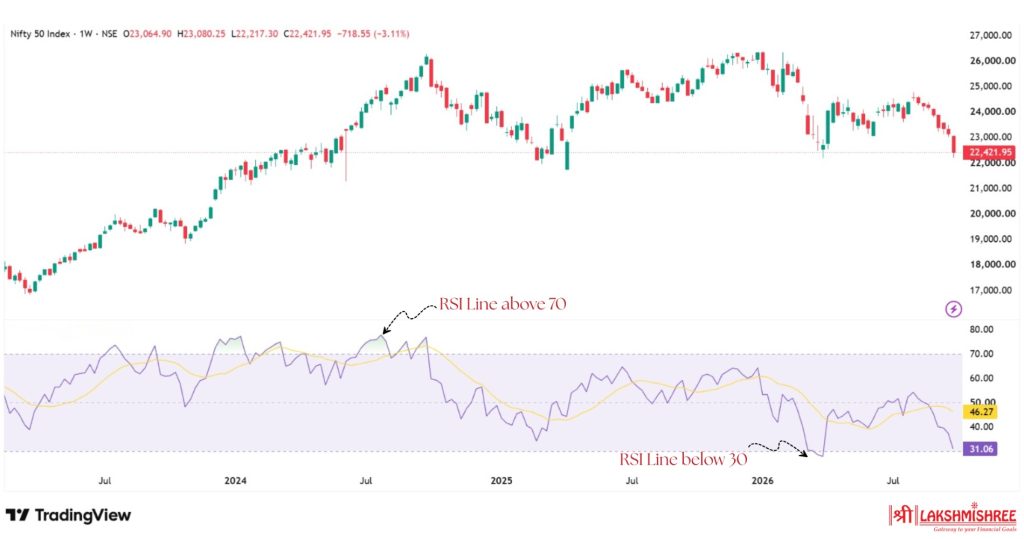
The Relative Strength Index (RSI) is a momentum indicator that shows the strength of recent price movements. It ranges from 0 to 100.
Common RSI levels are:
However, these levels do not guarantee a price reversal. RSI can stay above 70 or below 30 during strong trends.
Traders can also look for RSI divergence, where price and RSI move in different directions. This may provide useful momentum information but is not a guaranteed reversal signal.
For intraday trading, RSI works best when combined with price action and the overall market trend.
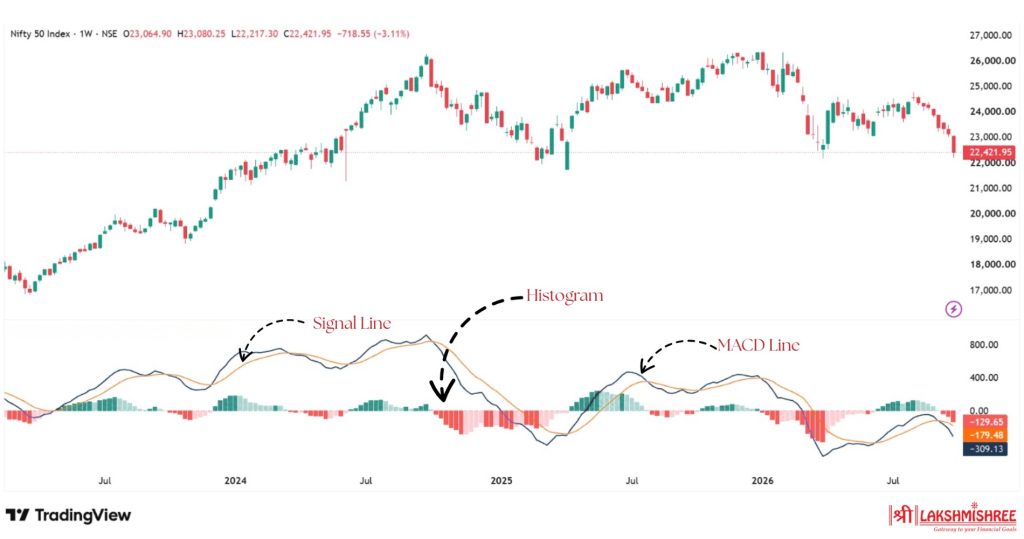
MACD (Moving Average Convergence Divergence) is a trend and momentum indicator. It helps traders understand changes in price momentum.
MACD mainly includes:
Traders often use MACD and signal-line crossovers to study momentum changes. The histogram shows the difference between the two lines.
The common MACD settings are 12, 26, and 9. These represent periods based on the selected chart timeframe, not automatically days.
MACD can be useful in trending markets but may give delayed or unclear signals in sideways markets. It is better used with price action and other market information rather than alone.
Get Your Intraday Trading Guide
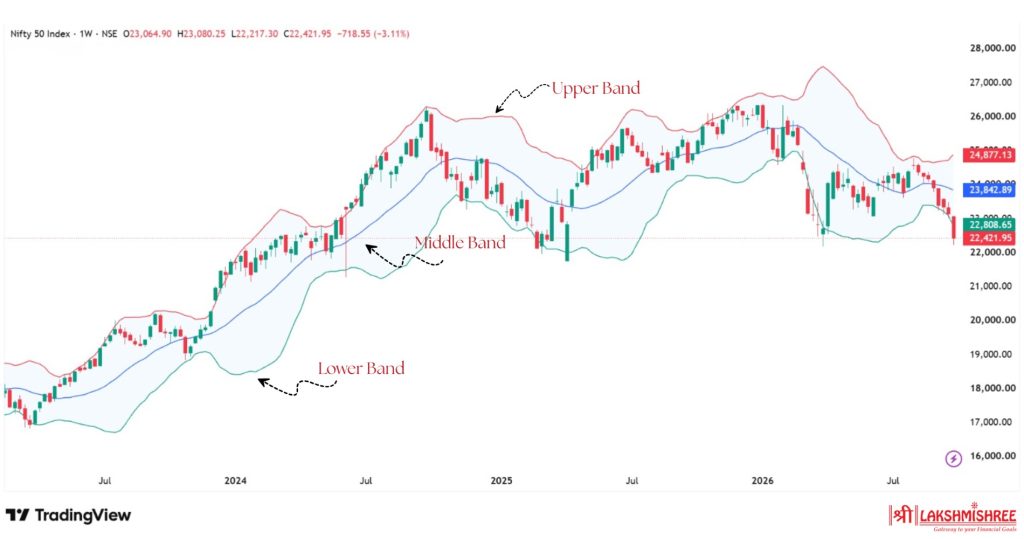
Bollinger Bands are a volatility indicator that helps traders understand how much price is moving.
They have three lines:
The bands expand when volatility increases and contract when volatility decreases.
Intraday traders can use them to:
A squeeze does not indicate which direction the price will move next. Also, touching the upper or lower band does not automatically mean overbought or oversold, as price can stay near a band during a strong trend.
Bollinger Bands are more useful when combined with price action, volume, and market trend.
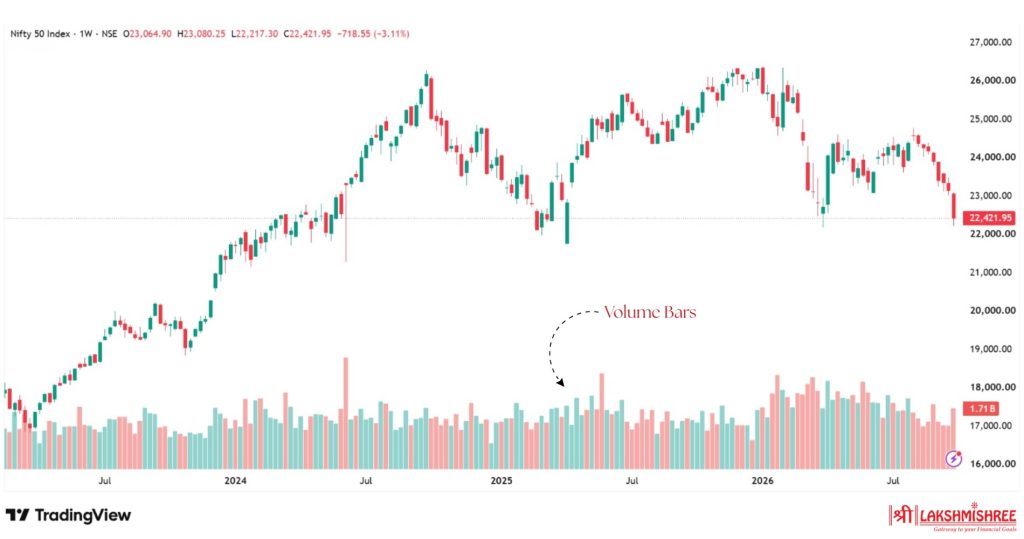
Volume shows the level of trading activity in an asset during a specific period. It helps traders understand how much participation is behind a price move.
Intraday traders can use volume to:
A price move with higher-than-usual volume may show stronger market participation, while low volume may need further confirmation.
However, high volume does not guarantee that the price will continue in the same direction. Volume is more useful when combined with price action and other indicators.
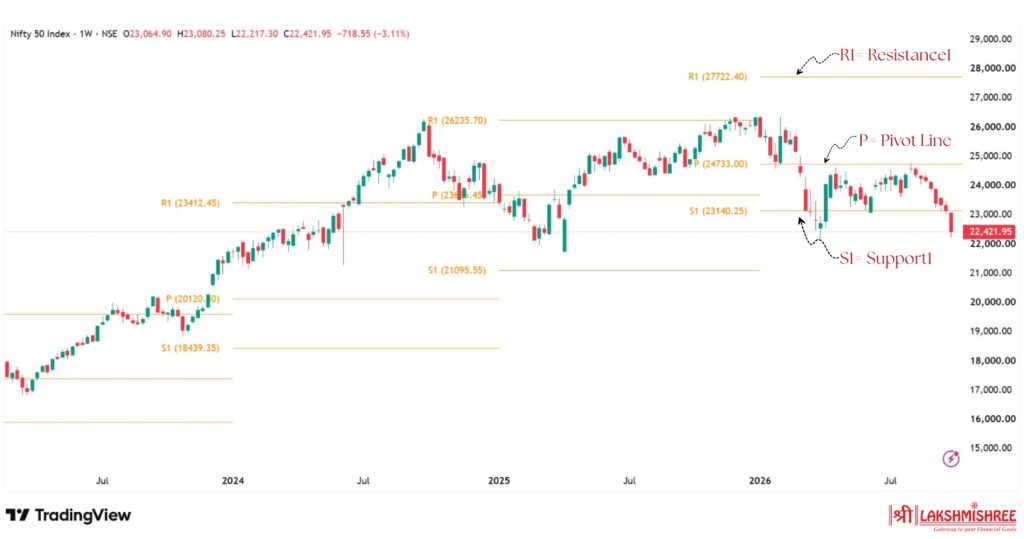
Pivot Points help intraday traders identify potential support and resistance levels during a trading session.
They are usually calculated using the previous session’s high, low, and closing price.
Traders can use Pivot Points to:
However, Pivot Points are not guaranteed reversal levels. Price can break through them when buying or selling pressure is strong.
For better technical analysis, combine Pivot Points with price action and volume.
Now that you have explored the seven indicators, take your learning a step further with our downloadable intraday trading guide, which brings the key settings, chart signals, and practical entry, stop-loss, and target guidelines together in one easy reference.
There is no single best intraday trading indicators that works equally well for every trader, asset, timeframe, or market condition.
The usefulness of an indicator depends largely on what the trader wants to analyze.
| Trading objective | Indicator to consider |
| Intraday price reference | VWAP |
| Identifying trends | Moving Average |
| Measuring momentum | RSI |
| Studying trend and momentum changes | MACD |
| Understanding volatility | Bollinger Bands |
| Assessing trading activity | Volume |
| Identifying potential support and resistance | Pivot Points |
For example, a trader interested in understanding the intraday relationship between price and volume may find VWAP useful. Someone focused on identifying the direction of a short-term trend may use a Moving Average.
Similarly, RSI can provide momentum information, while Bollinger Bands can help analyze changes in volatility.
The key is to choose indicators based on the trading strategy instead of selecting an indicator simply because it is considered popular.
Using several technical indicators does not automatically make a trading strategy better. In fact, using too many tools can make a chart difficult to interpret.
A better approach is to combine indicators that provide different types of information.
VWAP can provide price context, while volume can show the level of trading activity behind a price movement.
A Moving Average can help assess the broader short-term trend, while RSI can provide additional information about momentum.
Bollinger Bands can help identify changes in volatility. Volume can provide additional context when price moves outside a range or approaches important levels.
MACD can help assess momentum and possible trend changes. Price action can then provide information about the actual market structure.
The goal is not to collect as many signals as possible. It is to use a small number of complementary tools that fit the trading plan.
Related Reading: 7 Best Indicators for Options Trading in 2026: RSI, PCR, IV Rank & More. With Entry Rules | 5 Best Indicators for Swing Trading: Top Indicator
Technical indicators for intraday can be helpful, but using them incorrectly can lead to poor decisions. Common mistakes include:

Keep these points in mind when building an intraday trading approach:
A simple and well-understood setup can be easier to manage than a complicated chart containing many indicators.
Choosing the best indicator for intraday trading depends on what you want to understand about the market.
VWAP can provide an intraday price and volume reference. Moving Averages can help identify trends, while RSI and MACD can provide momentum-related information. Bollinger Bands can help analyze volatility, Volume can provide insight into trading activity, and Pivot Points can help identify potential support and resistance levels.
No indicator can guarantee a profitable trade. A more practical approach is to select indicators that match your strategy, combine them with price action, and use appropriate risk management.
Before using any intraday strategy with real capital, consider testing it under different market conditions and understanding the risks involved.
Looking for a handy reference to keep beside your charts? Download the complete 7 Intraday Indicators Guide and use it as a quick reference while analysing intraday setups.
There is no universal best indicator for intraday trading. VWAP, Moving Average, RSI, MACD, Bollinger Bands, Volume, and Pivot Points serve different purposes. The appropriate choice depends on the trading strategy, timeframe, asset, and market conditions.
VWAP can be useful for intraday analysis because it combines price and volume to provide a volume-weighted reference price for a trading session. Traders can use it with price action and other indicators for additional context.
Yes. Moving Averages can help traders assess short-term price trends and observe potential changes in direction. SMA and EMA are two commonly used types, but the appropriate period depends on the trading approach.
Yes. RSI can help traders assess momentum and identify commonly referenced overbought or oversold conditions. However, these readings should not be treated as automatic buy or sell signals.
Technical indicators cannot guarantee or precisely predict future stock prices. They are tools for analyzing historical and current market data. Future price movements can be affected by many factors, including market conditions and new information.
There is no fixed number. It is generally more important to understand how the selected indicators work and ensure that they provide complementary information rather than using a large number of overlapping tools.
Disclaimer: This article is intended for educational purposes only. Please note that the data related to the mentioned companies may change over time. The securities referenced are provided as examples and should not be considered as recommendations.