
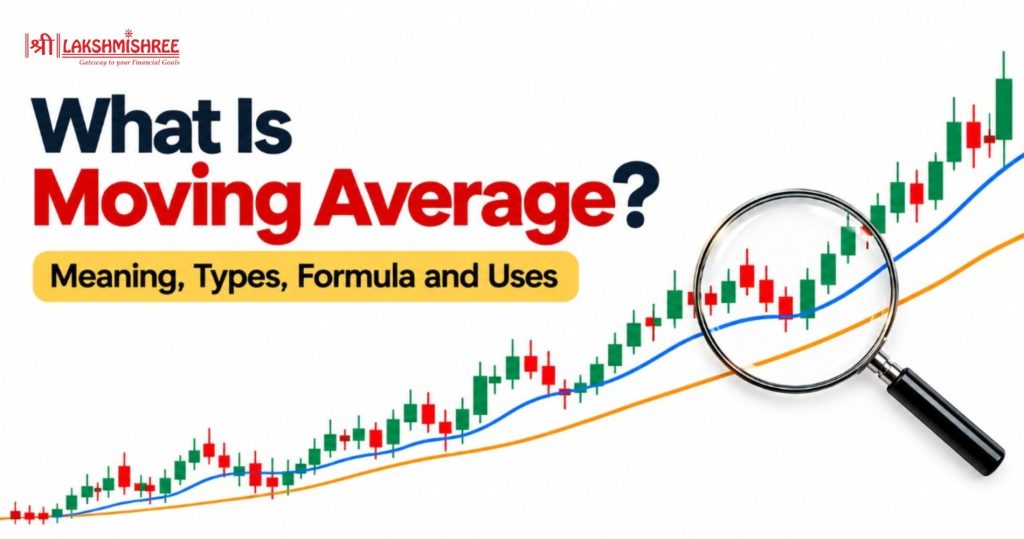
Price charts move up and down all day. Small swings can hide the real direction of a stock. Traders need a simple way to cut through this noise. That is where MA helps. So, what is moving average (MA), and why do so many traders rely on it? In simple words, it is a line that smooths out price swings and shows the trend.
This guide explains its meaning, formula and types. You will also learn how to read one on a chart.
It is a technical analysis tool that shows the average price of a stock over a chosen number of candles.
Each time a new candle closes, the oldest candle drops out. The newest one comes in. The window keeps "moving" forward. That is how the tool gets its name.
Most traders use the closing price. It shows where buyers and sellers settled at the end of a candle.
The result is a smooth line on your chart. It removes small ups and downs. You can then see whether a stock is rising, falling or going nowhere.
The indicator is built from past prices. So it is a lagging indicator. It confirms a trend instead of predicting one. Think of it as a rear-view mirror. It shows where the price has been, and that often hints at where it is heading.
The formula for a simple moving average is:
Here, P is the closing price of each candle. n is the number of candles.
Take a 5-candle MA on a daily chart. The last five closing prices are ₹102, ₹104, ₹103, ₹107 and ₹109.
The next day, the stock closes at ₹110. Drop the oldest price (₹102) and add the new one.
The average moved from ₹105 to ₹106.60. Join these points over many days and you get the line.
Charting platforms do this for you. But knowing the maths helps you trust what you see.
Many beginners think a "20 MA" always means 20 days. It does not.
The number is how many candles are on the chart you are viewing. The time each candle covers, depends on the time frame.
Here is what a 20 MA covers on different charts:
| Chart time frame | What "20 MA" averages | Time covered |
| 5-minute | Last 20 five-minute candles | 100 minutes |
| 1-hour | Last 20 one-hour candles | 20 trading hours |
| Daily | Last 20 daily candles | 20 trading days |
| Weekly | Last 20 weekly candles | 20 weeks |
So, a "50-day moving average" is simply a 50 MA on a daily chart.
Be careful here. A 50 MA on a weekly chart is not the same as a 50-day MA. It covers 50 weeks. Always check your time frame before reading a signal.
Also, the latest value keeps changing until the current candle closes.
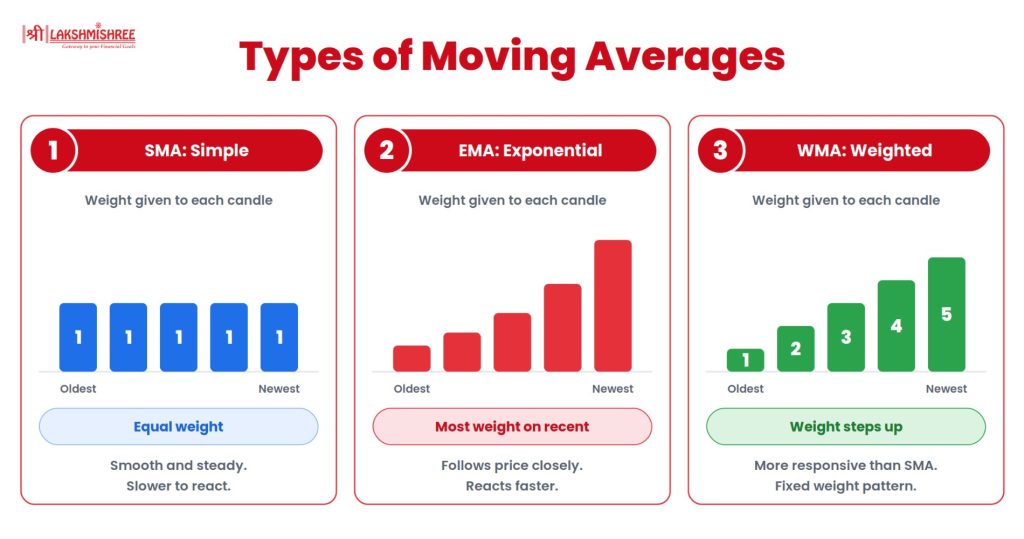
There are three common types of MA. They differ in how they treat each candle.
The SMA gives equal weight to every candle. In a 20 SMA, each of the 20 candles counts the same.
The line is smooth and steady. It reacts slowly to sudden price moves. Many investors use it to track long-term trends.
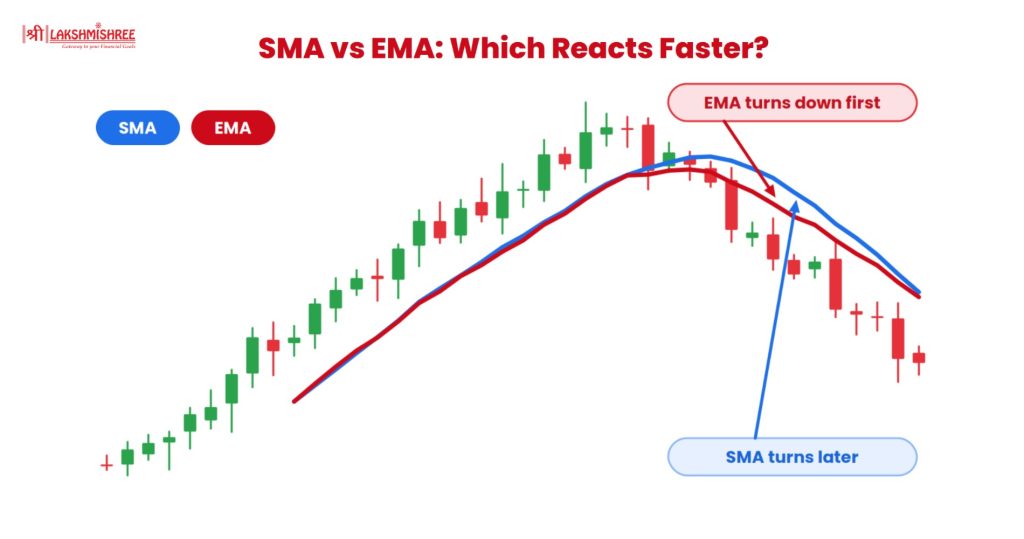
The EMA gives more weight to recent prices. So it reacts faster than the SMA.
It uses a smoothing factor: 2 ÷ (n + 1). For a 20-candle EMA, that is about 0.095. You do not need to work this out by hand. Charts calculate it instantly.
Active traders often prefer the EMA. It follows price more closely and shows changes sooner.
The WMA also favours recent data. The newest candle gets the highest weight. The weights then fall in a fixed pattern for older candles.
It is more responsive than the SMA. Many beginners start with the SMA or EMA first, and add the WMA later.
| Feature | SMA | EMA |
| Weight on candles | Equal | More on recent candles |
| Speed of reaction | Slower | Faster |
| Look of the line | Smoother | Closer to price |
| Signals | Fewer and later | Earlier, but more false ones |
| Best suited for | Long-term trends | Short-term trading |
Neither is better in every case. Pick the one that fits your style and time frame.
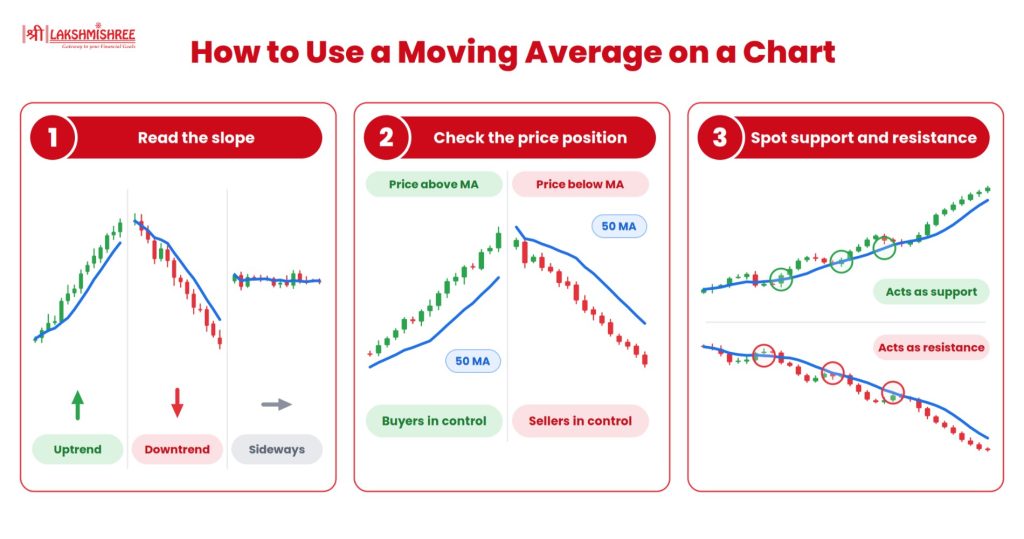
Reading the indicator is simple. Look at three things.
The direction of the line tells you the trend.
See where the price sits compared to the line.
Here is an example. A stock trades at ₹250. Its 50 MA is at ₹240 and rising. The price is above a rising line. That points to an uptrend.
Now say the stock closes below ₹240 and the line starts to turn down. The trend may be losing strength.
In an uptrend, price often dips to the line and bounces back. The line acts like a floor. In a downtrend, the same line can act like a ceiling.
This is not guaranteed. Treat the line as a zone, not an exact level.
Traders often plot two moving averages on one chart. One is short-term. The other is long-term. The point where they cross gives a signal.
On a daily chart, these are often called the 50-day and 200-day averages.
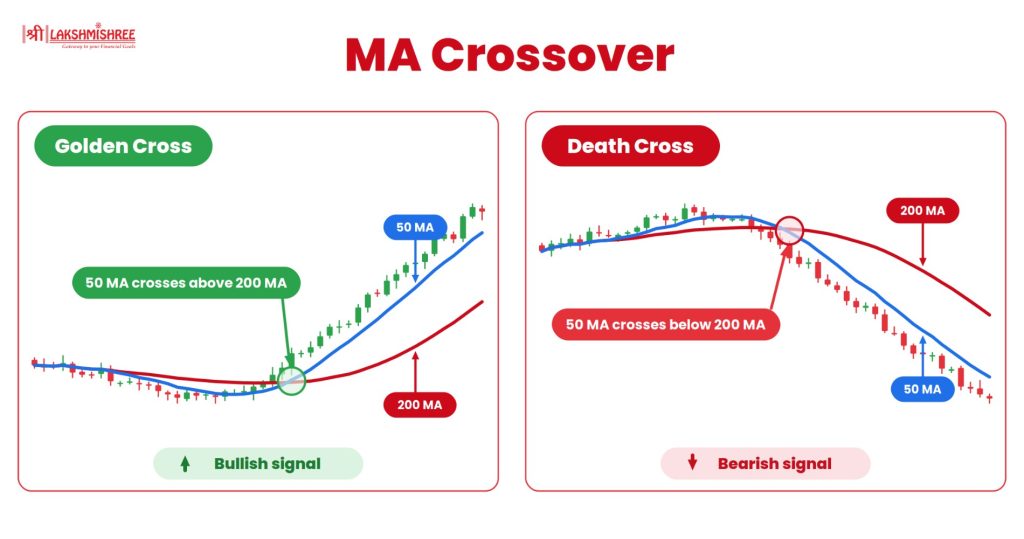
A crossover comes after a move has already started. So it confirms a trend. It does not predict one.
In a sideways market, the lines cross again and again. This creates false signals. Be careful during such phases.
There is no single best number. The right length depends on your goal.
Shorter lengths give more signals. Longer lengths give fewer, but steadier ones.
Test your choice on past data before you use it. Also, keep your length and time frame the same while you test.
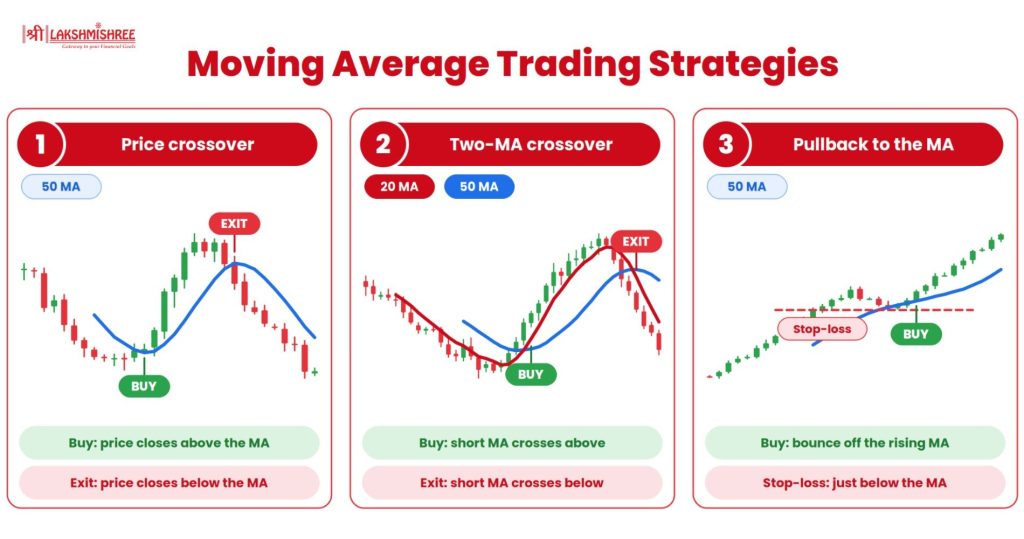
Traders use this indicator in few simple ways. Here are three beginner-friendly strategies. Treat them as learning tools and test each one before using real money.
This uses a single moving average, such as a 50 MA on the daily chart.
It is simple, but it gives many false signals in sideways markets. Use closing prices, not intraday spikes.
Plot a short MA (such as 20) and a long MA (such as 50) on the same chart.
This gives fewer signals than the price crossover. The golden cross is a long-term version of the same idea.
In a clear uptrend, price often dips back to the line and then moves up again.
Here is an example. A stock is rising and its 50 MA is at ₹240. Price dips from ₹262 to ₹243, then a candle closes higher. A trader may see this as a pullback entry, with a stop-loss below ₹240. If price closes under the line, the idea fails and the trader exits.

To manage these limits, use it with other tools. Volume, RSI and support and resistance are common choices.
Related Reading: MACD | VWAP | Bollinger Bands
So, what is moving average? It is a simple line that averages recent prices and smooths out the noise. It helps you see the trend at a glance.
Remember that the number counts candles, not just days. Choose between SMA, EMA and WMA based on how fast you want the line to react. Use crossovers and slope as clues, not as promises.
Practise on a live chart to build confidence. Try a few lengths and time frames and see how price reacts.
It is the average price of a stock over a set number of candles. It updates with each new candle. It smooths the price line so you can see the trend clearly.
Neither is always better. The SMA is smoother and suits long-term trends. The EMA reacts faster and suits short-term trading. Choose based on your style and time frame.
No. It counts candles. A 50 MA on a weekly chart covers 50 weeks. A 50-day MA is a 50 MA on a daily chart and covers 50 trading days.
It is a lagging indicator. It uses past prices, so it confirms a trend after it starts. It does not predict future moves on its own.
The SMA is a good start. It is easy to read and calculate. Beginners often try the 20 and 50 SMA on a daily chart. Move to the EMA once you are comfortable.
There is no single best one. It depends on your time frame. Traders often use the 9 or 20 EMA for intraday, the 20 and 50 for swing trading, and the 50 or 200 SMA for long-term trends.
It is better not to. The indicator lags and can give false signals. Pair it with volume, support and resistance or RSI. Always use a stop-loss and test your approach on past charts first.
Not well. When price moves in a range, it keeps crossing the line. This creates false signals. A flat line is a hint to wait for a clear trend before trading.
Disclaimer: This article is intended for educational purposes only. Please note that the data related to the mentioned companies may change over time. The securities referenced are provided as examples and should not be considered as recommendations.