

Why do two companies with similar earnings trade at very different share prices?
One reason can be how investors value their future growth and earnings. Understanding what is PE ratio in stock market can help explain this difference. The Price-to-Earnings (P/E) ratio is a widely used valuation metric that connects a company's share price with its earnings.
This helps investors understand how the market values a company's earnings and whether its valuation appears relatively high or low.This guide explains its meaning, formula, calculation and use in simple terms.
The Price-to-Earnings (P/E) ratio is a stock valuation metric that compares a company's market price per share with its earnings per share (EPS).
In simple terms, it shows how much investors are paying for every ₹1 of the company's earnings.
For example, suppose a stock trades at ₹500 and its earnings per share are ₹25. Its P/E ratio would be 20.
This means investors are paying ₹20 for every ₹1 of the company's earnings.
The P/E ratio is widely used in fundamental analysis to compare companies and assess their relative valuation. However, it should be considered alongside factors such as earnings growth, profitability, debt and industry conditions.
A high P/E ratio means investors are paying more for each unit of the company's current earnings. It may reflect strong growth prospects, a competitive advantage or positive market expectations.
However, a high P/E does not automatically mean the stock is overvalued. Investors should consider earnings growth, industry conditions and company fundamentals.
A low P/E ratio means investors are paying less for each unit of current earnings. While this may indicate a relatively inexpensive stock, it can also reflect slower growth expectations, business challenges or declining earnings prospects.
Therefore, a low P/E does not automatically mean a stock is undervalued. Investors should understand why the market assigns the lower multiple.
There is no universally ideal P/E ratio. A reasonable P/E depends on the company's industry, business model, earnings growth, profitability, market conditions and fundamentals.
For example, a P/E of 15 may be attractive for a stable, growing company but expensive for a business with weak prospects. Therefore, investors should compare P/E with industry peers, sector averages and historical valuations.
The key question is not “Is this P/E high or low?” but “Is this P/E reasonable given the company's earnings, growth and business prospects?”
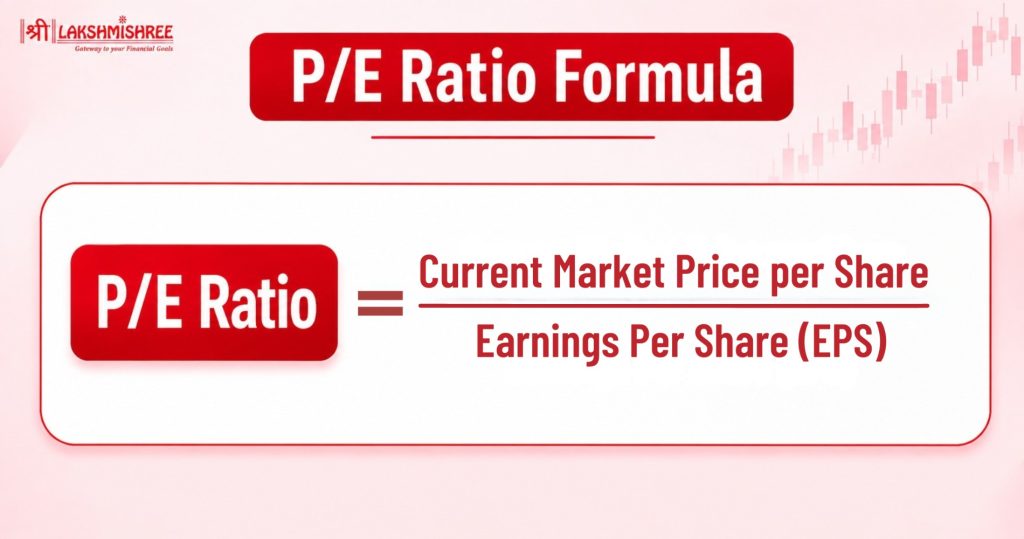
P/E Ratio = Current Market Price per Share ÷ Earnings Per Share (EPS)
where, the current market price is the price at which the stock is trading.
and Earnings Per Share (EPS) represents the company's earnings attributable to each outstanding share.
Consider a company with the following figures:
Using the formula:
P/E Ratio = ₹800 ÷ ₹40 = 20
Therefore, the company's P/E ratio is 20.
In practical terms, the market is valuing the company's shares at 20 times its earnings per share.

The P/E ratio is based on two factors: share price and earnings per share (EPS). If the share price rises while earnings remain unchanged, the P/E increases. If earnings rise while the share price remains unchanged, the P/E decreases.
The ratio shows how the market values a company's current earnings. However, share prices also reflect future expectations. If investors expect strong earnings growth, they may be willing to pay a higher price, resulting in a higher P/E.
P/E ratios can be calculated using different types of earnings and comparisons. The most common types are:
A trailing P/E ratio uses the company's earnings from a past period, usually the previous 12 months.
A forward P/E ratio uses estimated future earnings. It helps investors assess how the current share price compares with expected earnings.
A relative P/E ratio compares a company's P/E with a benchmark. The benchmark could be its industry, competitors or a broader market index.
An absolute P/E ratio refers to the company's own P/E based on its applicable share price and earnings. It does not necessarily compare the company with another stock or benchmark.

Value investing focuses on finding stocks that appear undervalued based on their fundamentals. The P/E ratio can be a useful starting point for this approach.
A relatively low P/E may attract value investors because the stock appears inexpensive compared with its earnings. However, a low P/E does not automatically mean a stock is undervalued.
Investors should understand why the valuation is low. Weak earnings growth, declining demand or industry challenges may explain it. This can also create a value trap, where a stock appears cheap but its fundamentals continue to deteriorate.
Therefore, investors should consider P/E alongside earnings growth, cash flow, debt and profitability.
Investors can use other metrics alongside P/E to get a broader view of equity valuation.
| Valuation Metrics | Description |
| P/B Ratio | Compares a company's market price with its book value per share. |
| PEG Ratio | Relates the P/E ratio to the company's expected earnings growth. |
| EV/EBITDA | Compares enterprise value with earnings before interest, taxes, depreciation and amortisation. |
| Dividend Yield | Measures annual dividend income as a percentage of the stock's market price. |
Related Reading: What is Dividend in Stock Market? | What Is EBITDA?
Understanding what is PE ratio in stock market can help investors evaluate a stock's valuation more effectively. The P/E ratio compares a company's share price with its earnings, but it should not be used alone. Investors should consider earnings growth, industry peers, historical valuation and company fundamentals. Using P/E alongside other financial metrics can provide a broader view of a stock and support more informed investment decisions.
The PE ratio in stock market helps investors understand how much they are paying for a company's earnings
Neither automatically. A high P/E may reflect strong growth expectations or a premium valuation. Investors should compare it with earnings growth, industry peers and company fundamentals.
No. A low P/E may indicate a relatively inexpensive stock, but it can also reflect weak growth, declining earnings or business risks.
There is no universal benchmark. A reasonable P/E depends on the industry, company fundamentals, earnings growth and prevailing market conditions.
Yes. A negative P/E can occur when a company reports negative earnings. However, it is generally not useful for conventional P/E-based valuation.
Neither is universally better. Trailing P/E is based on actual past earnings, while forward P/E uses estimated future earnings. Investors can consider both to understand current valuation and future expectations
Disclaimer: This article is for educational and informational purposes only and does not constitute investment advice or a recommendation to buy or sell any specific security. Investing in stocks involves market risk. Past performance is not indicative of future results. Please conduct your own due diligence before making any investment decisions.