
Understanding what is CAGR in mutual funds starts with a simple rule: CAGR is the right metric for lump-sum investments, just as XIRR in mutual funds is the right metric for SIPs. If you invested money once and want to know how fast it actually grew over time, CAGR gives you the answer.
CAGR helps you compare a volatile small-cap fund with a conservative debt fund, judge whether a scheme truly outperformed the Nifty 50 and see whether your returns were strong enough to beat inflation.
Yet CAGR has limitations that most investors only discover after making a wrong fund comparison. It smooths out market crashes, hides volatility, and can make two very different investment journeys look identical.
This guide explains how CAGR in mutual funds works, when to use it, how it is calculated and what constitutes a good CAGR in India.
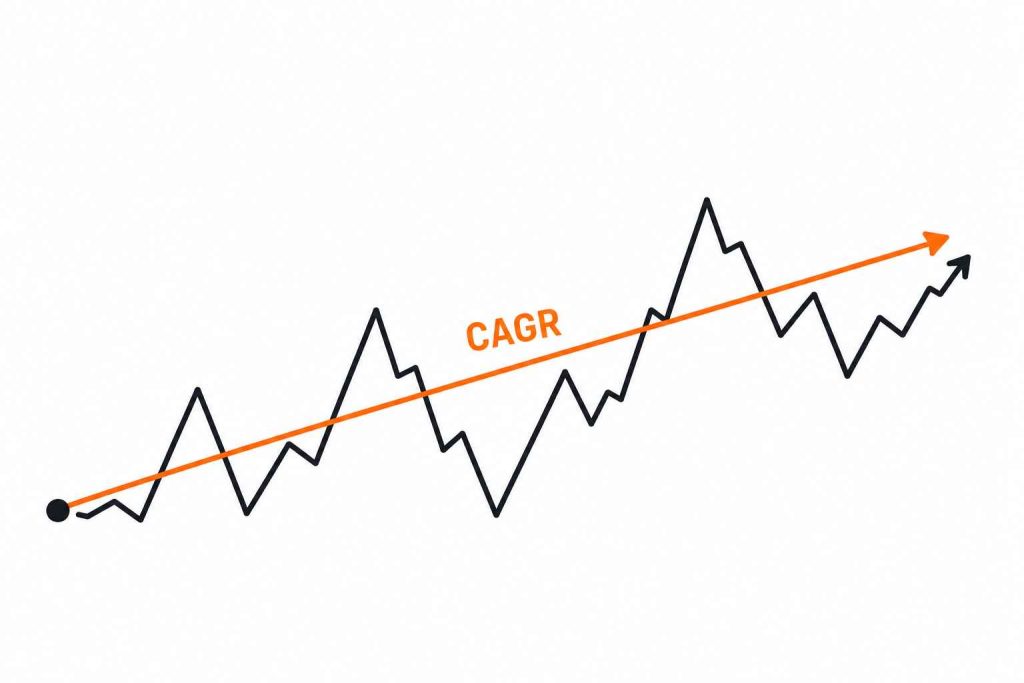
CAGR in mutual funds is the rate at which your investment would have grown each year if it grew at a perfectly steady pace from start date to end date. Not the actual year-by-year return. The equivalent annual return i.e. a smoothed, annualised number that makes comparison easy.
For example, in simple words, you put ₹1 lakh in a mutual fund in 2019. By 2024, it became ₹2 lakh. Markets went up some years, crashed in 2020, recovered sharply, then wobbled. But if you divide that journey into a clean annual rate, you get the CAGR in mutual funds. It was not 20% every single year. It was as if it were, and that is what CAGR tells you.
This is why CAGR is the standard for comparing mutual fund performance across different time periods and fund types, whether you are looking at large-cap equity funds, ELSS funds, or debt funds.
Beginning value. Ending value and Years. That's what it takes for calculating CAGR.
CAGR = [(Ending Value ÷ Beginning Value) ^ (1 ÷ Years)] − 1
A real example - Nifty 50, 2019 to 2024
| Investment | Start Value | End Value | Years | CAGR |
| Nifty 50 Index Fund | ₹1,00,000 | ₹1,96,000 | 5 | 14.38% |
| Mid-Cap Fund | ₹1,00,000 | ₹2,20,000 | 5 | 17.12% |
| Debt Fund | ₹1,00,000 | ₹1,38,000 | 5 | 6.65% |
Solving:
Beginning Value: ₹1,00,000
Ending Value: ₹1,96,000
Years: 5
First, define the variables:
1. Divide the ending value by the beginning value: 1,96,000 ÷ 1,00,000 = 1.96
2. Calculate the time exponent: 1 ÷ 5 years = 0.2
3. Raise the result to the power of the exponent: 1.96 ^ 0.2 ≈ 1.1438
4. Subtract 1 to find the CAGR: 1.1438 - 1 = 0.1438 or 14.38%
The table shows that mid-cap delivered more growth, debt fund delivered stability. CAGR is the shared language that makes these three different instruments comparable on one line.
Absolute return is the simplest return metric in investing. It answers one question: by what percentage did my money grow from the day I invested to today, ignoring how long that took? If you put in ₹1,00,000 and it became ₹1,50,000, your absolute return is 50%.
While both metrics measure growth, they serve different purposes: Absolute Return is for simple total gains (useful for short-term), while CAGR is the efficiency metric required for long-term planning and comparison because it accounts for time.
| Invested | Period | Final Value | Gain | Abs. Return | CAGR |
| ₹10,00,000 | 10 years | ₹20,00,000 | +₹10,00,000 | 100% | 7.18% per year |
| ₹5,00,000 | 3 years | ₹7,50,000 | +₹2,50,000 | 50% | 14.47% per year |
CAGR assumes a single investment on a single date. It measures how fast that one amount grew from point A to point B. The formula needs three things: starting value, ending value, and time.
While, XIRR makes no such assumption. It is built for situations where money moves in and out at irregular intervals for Example monthly SIP instalments, a partial redemption mid-way, a lump sum top-up, a dividend reinvestment. Each transaction carries its own date and its own amount. XIRR finds the single annual rate that makes all of those cash flows mathematically consistent with the final portfolio value.
| CAGR | XIRR | |
| Inputs | Start value, end value, years | Every transaction with its dates |
| Multiple cash flow | No | Yes |
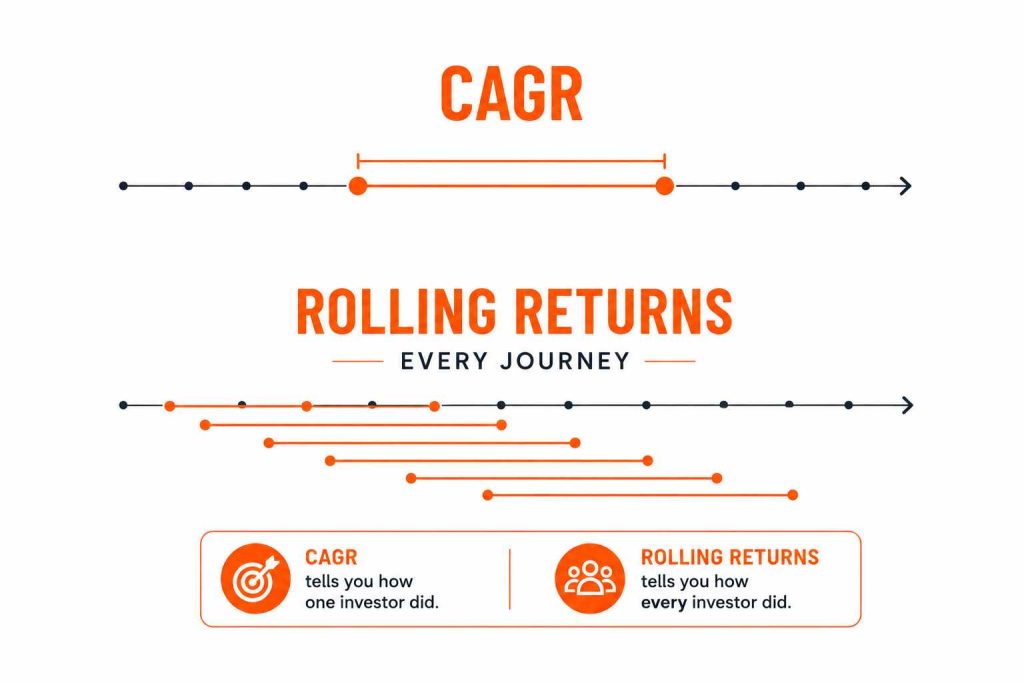
CAGR tells you the return for one specific period, a fixed start date and a fixed end date. If you invested in January 2019 and checked your value in January 2024, CAGR tells you exactly how that journey went.
Rolling return takes that same calculation and repeats it again and again. It keeps the window length fixed, say 5 years, but shifts the starting point forward by one month each time: January 2019 to January 2024, then February 2019 to February 2024, then March 2019 to March 2024, and so on across the available data. Each shift produces its own CAGR, so instead of one number, you end up with dozens, each representing a different investor's experience depending on when they entered.
| CAGR | Rolling Returns | |
| What it shows | Performance in one fixed window | Performance across every window of that length |
| What it tells you | How the fund did for one investor | How the fund did for all investors, regardless of entry month |
| Best for | Quick comparison | Judging reliability before investing |
A tight range, say 12% to 15%, means the fund delivers roughly the same outcome no matter when you entered. A wide range, say 3% to 20%, means your result depends more on timing luck than on the fund's actual quality.
Let's use a simple example. Suppose a fund's yearly returns for 5 years were:
Year 1: 7% | Year 2: 14% | Year 3: 6% | Year 4: 13% | Year 5: 10%
Now take the average of every 3 years in a row:
You get three numbers: 9%, 11%, 9.67%. All close to each other.
This is what rolling returns do. The window size (3 years) stays the same, but the starting point keeps moving by one year. In real life, fund houses do this with monthly data, so you get many such numbers, not just three.
Since all three numbers here are close, it means the fund gave a similar return no matter which year you started. That is what "consistent" means in rolling returns. A single CAGR cannot tell you this.
CAGR in mutual funds is the right number to use, still it is not the complete picture. Three things hide inside it that can cost you money if you don't know to look for them.
Audited CAGR data is readily available through official channels like AMFI and AMC monthly fact sheets. While major investment platforms like lakshmishree, groww or any other offer convenient access to these figures, you can independently calculate the CAGR using historical NAV data from BSE or NSE.
| Source | Nature of Data | Key Consideration |
| AMFI / AMC Fact Sheets | Official & Audited | Use for reliable comparisons |
| Investment Platforms | Convenient | Verify date ranges and windows |
| Independent Calculation | Raw NAV Data | Most reliable for verification |
CAGR is the simplest and most reliable way to measure the performance of a lump-sum mutual fund investment. By converting years of market ups and downs into a single annualised return, it allows investors to compare funds, benchmarks, and investment strategies on a like-for-like basis.
But CAGR is only part of the story. It does not show risk, volatility, or the timing of cash flows, which is why SIP investors should use XIRR instead. The smartest investors use CAGR alongside benchmarks, inflation, and risk metrics to judge whether a fund has truly created value.
If there is one takeaway from this guide, it is this: for lump-sum investments held longer than a year, CAGR is the number that matters most.
CAGR stands for Compound Annual Growth Rate. In mutual funds, it is the equivalent annual rate at which your investment grew from a start date to an end date, assuming it compounded each year steadily. It is the most widely used metric to compare mutual fund performance across time periods.
Absolute return tells you total percentage growth without considering time. What is CAGR in mutual funds, then, by comparison? It annualises that same growth, converting a multi-year journey into one honest annual rate. For any investment held longer than one year, CAGR is the correct metric because it accounts for the time value of money. A 100% absolute return over 10 years sounds extraordinary but translates to a CAGR of 7.18%, which barely beats inflation.
No. CAGR assumes a single lump sum invested on day one. SIPs involve multiple instalments at different points in time. The correct metric for SIP returns is XIRR, which calculates the internal rate of return while accounting for the timing of each individual investment. Every major mutual fund platform in India now displays XIRR automatically for SIP portfolios.
The Nifty 50's long-term historical CAGR of 12–13% is the benchmark reference point. Large-cap equity funds should match or exceed this after expense ratios. Mid-cap and small-cap funds have historically delivered 15–18% CAGR over 10-year periods, but with drawdowns that can exceed 50% in bad years. Debt funds typically deliver 6–8% CAGR.
No. CAGR measures return only, not the risk taken to achieve it. Two funds with identical 5-year CAGRs can have completely different risk profiles. Always look at Sharpe ratio, standard deviation, and maximum drawdown alongside CAGR in mutual funds for a complete picture of risk-adjusted performance.
Yes. CAGR turns negative when your ending value is lower than what you originally invested. It means the fund did not just underperform, it compounded a loss over that period. If you invested ₹1,00,000 and it became ₹75,000 over 3 years, your CAGR is −9.14% per year.
Not automatically. A fund delivering 18% CAGR with a standard deviation of 28% is carrying twice the volatility of a fund delivering 15% CAGR with a standard deviation of 14%. The higher CAGR fund may have had one or two extraordinary years that pulled the average up, years you may not have been invested for, or years that will not repeat. Before choosing the higher CAGR fund, check whether the Sharpe ratio is also higher. If it is not, the extra return did not justify the extra risk taken to achieve it.

