
In 1991, the BSE Sensex comprised 30 of India's largest listed companies. Today, only six of those companies remain in the benchmark index. This isn't just a story about companies being replaced; it reflects how India's economy has transformed over the past 35 years. As industries evolved, new market leaders emerged while others faded from prominence.
In this article, we explore how the Sensex has changed, why 1991 was a turning point for Corporate India, and what this evolution teaches investors.
The BSE Sensex (Sensitive Index) is India's oldest and most widely followed stock market index. Launched in 1986 by the Bombay Stock Exchange (BSE) with the value of approx. 550, it tracks the performance of 30 of the country's largest and most actively traded companies across different sectors. Since 2003, the Sensex has been calculated using the free-float market capitalization method, which considers only the shares available for public trading and aligns it with global index standards.
The Sensex is often called the barometer of the Indian economy because its composition changes as the economy evolves. Companies are periodically added or removed to ensure the index continues to represent India's changing corporate landscape.
By 1991, the Sensex had been tracking India's leading listed companies for five years. The index was largely dominated by traditional businesses from sectors such as manufacturing, engineering, cement, automobiles, and consumer goods, with companies like Reliance Industries, Tata Steel, Tata Motors, ACC, and Hindustan Lever (now Hindustan Unilever) among its constituents.
That same year, India faced a severe Balance of Payments (BoP) crisis, prompting the government to introduce economic reforms under the Liberalization, Privatization, and Globalization (LPG) policy. These reforms opened the economy to foreign investment, reduced industrial regulations, and increased competition across industries.
The impact on Corporate India was profound. New sectors such as information technology, private banking, telecommunications, and pharmaceuticals grew rapidly. As India's economy evolved, so did the Sensex, with newer businesses replacing many of the companies that once dominated the benchmark index.
Today, only six of the thirty companies that were part of the index in 1991 remain. The others were replaced as newer businesses grew larger, became more liquid, and better reflected India's changing economy. However, being removed from the Sensex doesn't necessarily mean a company underperformed, it simply means other companies became more representative of the market over time.
The index itself has also witnessed extraordinary growth. Introduced in 1986 with a base value of 100 (base year 1978–79), the Sensex has crossed several major milestones over the years, reflecting India's long-term economic expansion.
| Year | Sensex Level (Approx.) | Key Milestone |
| 1986 | ~550 | BSE Sensex launched |
| 1991 | ~1,900 | Economic liberalization begins |
| 2006 | 10,000+ | First crossed the 10,000 mark |
| 2007 | 20,000+ | Crossed 20,000 for the first time |
| 2021 | 50,000+ | Reached 50,000 after the post-pandemic recovery |
| 2024 | 80,000+ | Crossed 80,000 for the first time |
Note: While it crossed 80,000 in 2024, the current price as of July 31, 2026, is ₹78,094.6
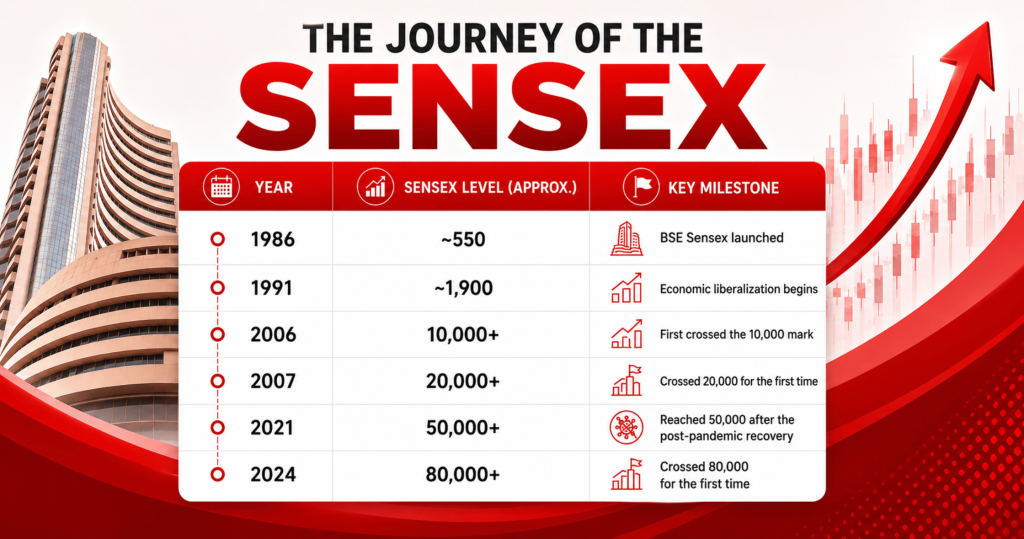
The numbers highlight the remarkable growth of India's benchmark index over the decades. From an index level of around 550 in 1986 to 1,900 in 1991, the Sensex grew by approximately 245% in just five years. Following the economic reforms, it continued its upward trajectory, rising from 1,900 in 1991 to over 80,000 in 2024, a gain of more than 4,100%. Overall, the Sensex appreciated by roughly 14,445% between 1986 and 2024, underscoring the long-term growth of India's economy and capital markets.
The journey hasn't always been smooth. The index has weathered events such as the 1992 Harshad Mehta scam, the dot-com crash, the 2008 Global Financial Crisis, the COVID-19 pandemic, and periods of geopolitical uncertainty. Yet, each correction was eventually followed by recovery, reinforcing the importance of staying invested over the long term.
The Sensex's performance also highlights the power of compounding.
| Investment | Approximate Value in 2026* |
| ₹1,000 invested in 1991 | ₹45,000–₹50,000 |
| ₹10,000 invested in 1991 | ₹4.5–5 lakh |
| ₹1 lakh invested in 1991 | ₹45–50 lakh |
Approximate values based on the long-term CAGR of the BSE Sensex. Actual returns may vary depending on the investment date and dividends.
While short-term market movements often dominate headlines, the Sensex's long-term trajectory demonstrates how disciplined investing has historically rewarded patient investors.
While the Sensex has delivered impressive returns, the companies driving those returns have changed significantly.
The six companies that have retained their place in the Sensex are:
| Company | Market Cap (Approx.)* | Share Price (EOD)* |
| Reliance Industries Ltd | ₹1,769,110.0 Cr. | ₹1,307.3 |
| Larsen & Toubro Ltd | ₹5,41,899.0 Cr. | ₹3,938.6 |
| Hindustan Unilever Ltd | ₹493,602.0 Cr. | ₹2,100.8 |
| Mahindra & Mahindra Ltd | ₹422,346.0 Cr. | ₹3,396.4 |
| ITC Ltd | ₹352,015.0 Cr. | ₹281.0 |
| Tata Steel Ltd | ₹236,936.0 Cr. | ₹189.8 |
*as of August 03, 2026
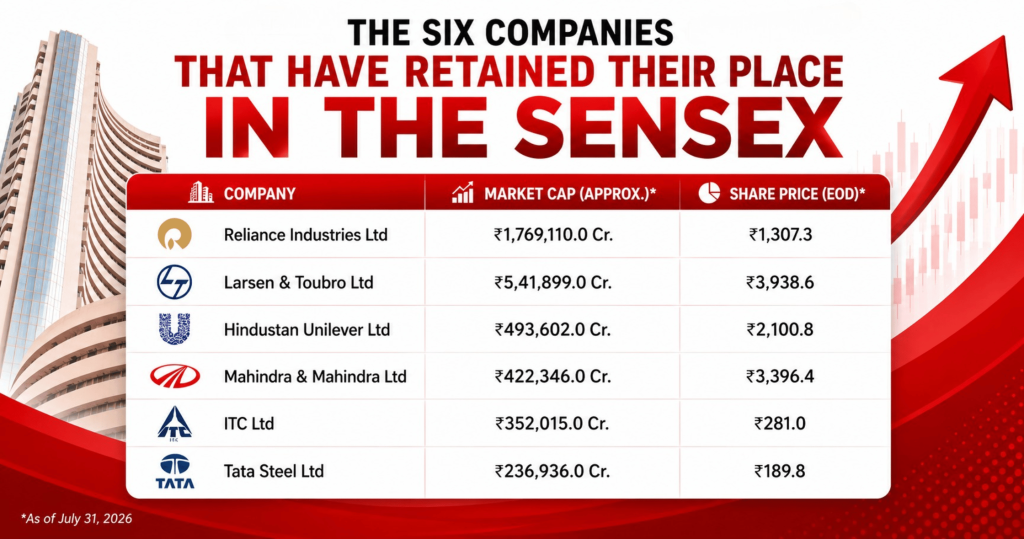
These companies have one thing in common - they continuously evolved with changing markets instead of relying on past success.
The companies that entered the index over the years tell another story: the rise of a modern Indian economy.
| Company | Market Cap (Approx.)* | Price (EOD)* |
| Bharti Airtel Ltd | ₹1,230,230.0 Cr. | ₹1,971.2 |
| Hdfc Bank Ltd | ₹1,152,470.0 Cr. | ₹747.9 |
| Icici Bank Ltd | ₹1,029,900.0 Cr. | ₹1,435.3 |
| State Bank Of India | ₹947,800.0 Cr. | ₹1,026.8 |
| Tata Consultancy Services Ltd | ₹855,895.0 Cr. | ₹2,365.6 |
| Bajaj Finance Ltd | ₹710,817.0 Cr. | ₹1,141.7 |
| Sun Pharma Industries Ltd | ₹477,312.0 Cr. | ₹1,989.4 |
| Infosys Ltd | ₹458,560.0 Cr. | ₹1,130.0 |
| Maruti Suzuki India Ltd | ₹447,690.0 Cr. | ₹14,239.4 |
| Titan Company Ltd | ₹432,822.0 Cr. | ₹4,875.3 |
| Adani Ports And Sez Ltd | ₹391,558.0 Cr. | ₹1,699.5 |
| Kotak Mahindra Bank Ltd | ₹388,146.0 Cr. | ₹390.2 |
| Axis Bank Ltd | ₹382,558.0 Cr. | ₹1,229.6 |
| Hcl Technologies Ltd | ₹365,395.0 Cr. | ₹1,346.5 |
| Ultratech Cement Ltd | ₹350,807.0 Cr. | ₹11,904.7 |
| Ntpc Ltd | ₹336,620.0 Cr. | ₹347.2 |
| Bajaj Finserv Ltd | ₹324,816.0 Cr. | ₹2,029.4 |
| Eternal Ltd (Zomato) | ₹291,778.0 Cr. | ₹302.4 |
| Bharat Electronics Ltd | ₹283,473.0 Cr. | ₹387.8 |
| Power Grid Corp Of India | ₹264,416.0 Cr. | ₹284.3 |
| Asian Paints Ltd | ₹263,636.0 Cr. | ₹2,748.5 |
| Interglobe Aviation Ltd | ₹199,936.0 Cr. | ₹5,170.8 |
| Tech Mahindra Ltd | ₹161,871.0 Cr. | ₹1,651.6 |
| Trent Ltd | ₹160,215.0 Cr. | ₹3,004.6 |
*as of August 03, 2026
Together, these companies reflect how India's economy has shifted from traditional industries to technology, financial services, consumption, and digital businesses.
The 35-year journey of the Sensex offers valuable lessons for both investors and businesses.
Ultimately, the Sensex is more than a stock market index, it reflects India's economic journey. Its evolution reinforces a simple lesson: long-term wealth is created by businesses that adapt and by investors who remain invested through changing market cycles.
The BSE Sensex is India's benchmark stock market index that tracks the performance of 30 large, liquid, and financially strong companies listed on the Bombay Stock Exchange (BSE).
The index is designed to represent India's leading companies across major sectors. These 30 stocks account for a significant share of the market's free-float capitalization and provide a broad view of the economy.
Companies are periodically reviewed based on factors such as free-float market capitalization, liquidity, and sector representation. As the economy evolves, the index is updated to reflect its changing corporate landscape.
No. Removal from the index simply means that other companies have become larger or more representative of the market. Many former constituents continue to operate successfully.
The index has shifted from being dominated by manufacturing and industrial companies to featuring greater representation from banking, information technology, telecommunications, consumer goods, healthcare, and financial services.
Disclaimer: This article is intended for educational purposes only. Please note that the data related to the mentioned companies may change over time. The securities referenced are provided as examples and should not be considered as recommendations.