Warren Buffett has said he prefers companies with a D/E ratio below 0.5. Peter Lynch put it more bluntly: "A company with no debt can't go bankrupt." Two of the greatest investors in history, and both of them treat the debt to equity ratio as one of the first filters before they even look at anything else.
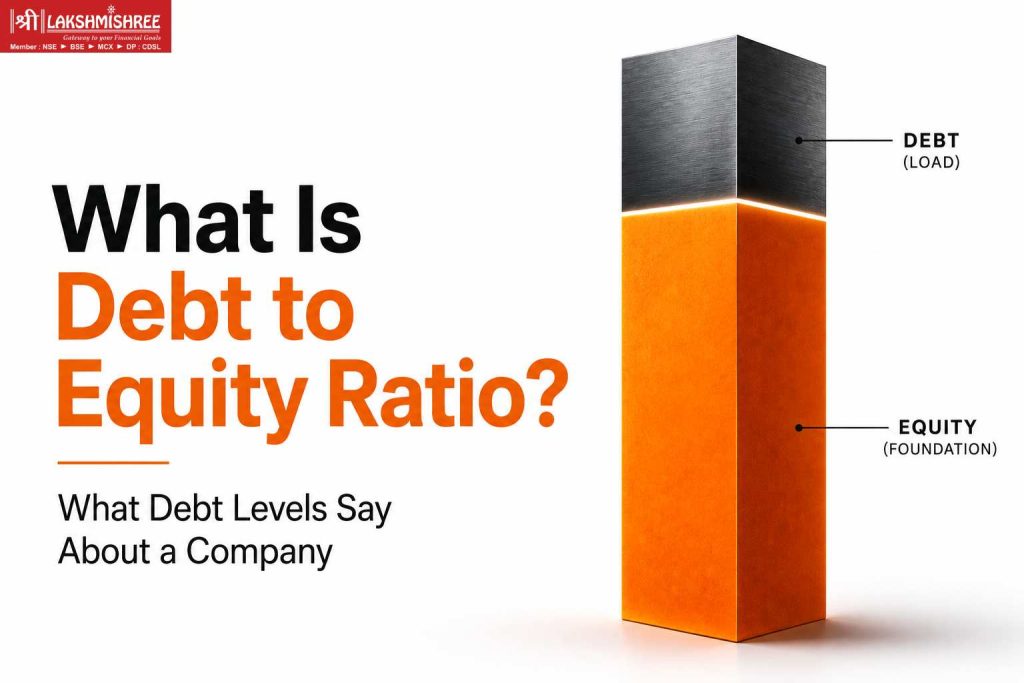
So what is debt to equity ratio, exactly? It tells you one thing immediately: how much of a company's operation runs on borrowed money versus its own capital. In simple terms, it measures how much borrowed money a company uses for every rupee of its own capital.
Before you buy a single share on NSE or BSE, this number can save you from picking a company that is quietly drowning in debt. Or help you spot one that is using debt intelligently to grow faster than its peers.
This guide gradually goes into depths beyond the formula. You will find sector-specific benchmarks for Indian markets, a five-point screening framework, and the hidden risk factors most articles skip entirely, including promoter pledging and PSU-specific interpretation.
Related Reading: High Book Value stocks screen | High Book Value Low PE Stocks
The D/E ratio, written as the debt-to-equity ratio, measures how much debt a company uses relative to the equity it holds.
A D/E of 1.0 means the company has equal amounts of debt and equity. A ratio of 2.0 means for every ₹1 of equity, the company has borrowed ₹2. A ratio of 0.3 means the company is funded mostly by its own capital with minimal borrowing.
Think of it like a home loan. You buy a house worth ₹50 lakh and put in ₹20 lakh yourself while borrowing ₹30 lakh. Your personal D/E ratio is 1.5, you are using more borrowed money than your own.
Companies work exactly the same way. The D/E is the number that quantifies that arrangement.
D/E ratio = Total Debt ÷ Total Shareholders' Equity
Total Debt includes all short-term and long-term borrowings: bank loans, debentures, bonds, and other financial liabilities.
Total Shareholders' Equity is what remains on the balance sheet after all liabilities are subtracted from total assets. It represents the ownership value of the business.
Here is a real Indian scenario applied to the D/E ratio formula:
| Balance Sheet Item | Amount (₹ Crore) |
| Long-term borrowings | 1,200 |
| Short-term borrowings | 400 |
| Total Debt | 1,600 |
| Total Shareholders' Equity | 800 |
| D/E ratio | 2.0 |
D/E = 1,600 ÷ 800 = 2.0
This is how the D/E ratio works in practice. For every ₹1 of equity, the company carries ₹2 of debt. Whether this is alarming or acceptable depends entirely on the sector.
The number alone means very little. The sector is the context in which the DE ratio takes its useful form. The same number that signals financial strength in one industry signals danger in another.
| D/E Ratio | General Interpretation |
| Below 0.5 | Very low: conservative financing, strong equity base |
| 0.5 to 1.0 | Moderate: balanced structure, manageable risk |
| 1.0 to 2.0 | Higher: acceptable in capital-intensive sectors |
| Above 2.0 | High: requires careful scrutiny, elevated financial risk |
| Negative | Liabilities exceed assets: serious distress signal |
Notice where Buffett draws his line: below 0.5.
That is not conservatism for its own sake. It is the recognition that a company with low debt retains the ability to act when others cannot. In a market downturn, a low-D/E company can acquire assets cheaply, expand, and emerge stronger. A high-D/E company is too busy servicing its debt to move.
A D/E ratio of 2.0 for a private sector bank or NBFC in India is completely normal. Financial institutions borrow money as their primary business model.
A D/E of 2.0 for an FMCG company or IT company would be a red flag. Those businesses generate strong internal cash flows and have no structural need for heavy borrowing.
There is a commonly repeated rule that a D/E ratio below 1.0 is "good" and above 2.0 is "bad." This oversimplification misleads more Indian retail investors than it helps.
Here is a sector-by-sector benchmark table for Indian-listed companies:
| Sector | Typical D/E Range | Why |
| Banking and NBFCs | 5.0 – 10.0+ | Lending is the core business; deposits are liabilities |
| Infrastructure and Construction | 1.5 – 3.0 | Long project cycles require heavy upfront debt |
| Steel and Metals | 1.0 – 2.5 | Capital-intensive plants and equipment |
| Auto and Auto Ancillaries | 0.5 – 1.5 | Manufacturing requires moderate borrowing |
| IT and Software | 0.0 – 0.3 | Asset-light model; high cash generation |
| FMCG and Consumer Goods | 0.0 – 0.5 | Strong cash flows; minimal need for external debt |
| Pharmaceuticals | 0.2 – 0.8 | R&D-heavy but largely equity-funded in India |
When you look at a company's D/E ratio, always compare it to its sector median. Not to a universal number.
A steel company with a D/E of 1.8 sitting below its sector median of 2.2 is actually conservatively financed relative to its peers. An IT company with a D/E of 0.8 is carrying unusually high debt for its industry.
The most useful approach for Indian stock screening is to combine the D/E with Return on Equity (ROE). A company with a high D/E and a high ROE is using borrowed capital productively. A company with a high D/E and a declining ROE is using debt to mask falling profitability. That is the danger zone.
Serious investors, from Buffett to Lynch, use the D/E ratio not as the final answer but as the first filter. It narrows the field fast. Once you know what the D/E is telling you, every other ratio you check becomes more meaningful.

Indian markets have specific characteristics that change the way you should read the debt to equity ratio.
SEBI disclosure requirements make D/E calculation straightforward. Every BSE or NSE-listed company must disclose borrowings and equity positions in quarterly and annual filings. The data is available on exchange filings, the company's investor relations page, and platforms like Screener.in, Tickertape, and Trendlyne.
Promoter pledging changes the risk picture entirely. This is the hidden factor most D/E articles do not mention.
When promoters pledge shares as collateral for loans, the company's risk profile rises, even if the headline D/E looks acceptable. When stock prices fall, pledged shares trigger margin calls, leading to forced selling. Always check the percentage of pledged promoter shares alongside the debt to equity ratio. Any pledging above 20–25% of promoter holding is a warning regardless of the D/E number.
PSU companies carry structurally different D/E ratios than private sector peers. Government backing reduces their borrowing costs. Capital allocation discipline has historically been weaker in PSUs. For retail investors, PSU debt to equity ratios need context. Implicit government support exists, but reform and divestment cycles can change this fast.
Institutional investor thresholds matter for your returns. Many FII mandates exclude companies with a D/E above 2.0 outside of financial sector stocks. Heavily indebted companies outside banking and infrastructure face reduced institutional demand, which affects their liquidity, volatility, and market capitalisation potential.
Want to screen stocks by debt to equity ratio alongside fundamentals? Open a free Demat account with Lakshmishree and access integrated research tools.
Used by investors to avoid "Value Traps"
A high debt to equity ratio is not automatically bad. In the right context, it signals strategic intent for amplified growth. When a company borrows at 8% and deploys that capital to generate returns of 15–18%, the excess return belongs entirely to equity shareholders. This is why well-managed infrastructure and real estate companies intentionally carry higher D/E ratios during expansion phases.
Tax efficiency is also important;
Interest paid on debt is tax-deductible in India. Equity dividends are not. Therefore, debt financing carries a built-in tax advantage, reducing the effective cost of borrowing for profitable companies.
Retained equity:
A company that funds growth through debt does not need to dilute existing shareholders by issuing new equity. This protects earnings per share (EPS) and market capitalisation, particularly relevant when promoter holding is high.
The debt to equity ratio shows the amount of debt. It does not show whether the company can actually afford it.
Peter Lynch's point cuts deep on this point. A company with no debt genuinely cannot go bankrupt from its balance sheet. Every step away from zero D/E is a step toward a scenario where external conditions, rising interest rates, a demand slowdown, a credit freeze, can turn a manageable debt load into an existential problem. That is not an argument against all debt. It is an argument for knowing exactly what you own.
Higher financial risk in downturns:
Debt creates fixed obligations. Interest and principal repayment must happen regardless of business performance. During downturns, companies with a high D/E face liquidity pressure that equity-heavy companies can absorb. In the 2020 COVID crash and the 2018 NBFC liquidity crisis, heavily indebted companies faced existential stress while low-D/E companies waited out the cycle.
Reduced financial flexibility:
Companies with high D/E ratios have less room to borrow when opportunities arise. If an acquisition or capacity expansion presents itself during a market downturn, an indebted company often cannot act. Companies with a low D/E can deploy capital precisely when assets are cheapest.
Interest payment burden:
Every rupee spent on interest is a rupee not available for reinvestment, R&D, dividends, or buybacks. The interest coverage ratio (EBIT divided by interest expense) is the companion metric you must check alongside the D/E. A D/E of 1.5 with an interest coverage ratio of 8x is far safer than a D/E of 1.0 with a coverage ratio of 1.5x.
The debt quality gap:
The D/E ratio does not account for the maturity profile of debt. A company with short-term borrowings needing rollover every 90 days faces different risk than one with long-term bonds maturing in 10 years, even if the headline D/E is identical.
You should not treat the Debt to Equity Ratio as a one-solution-for-all for all your trades or investments. Used alone, the debt-to-equity ratio is simply incomplete. It is used wisely as part of a multi-filter framework, and from then on, it starts to become powerful.
Professional investors and analysts treat the D/E ratio as one of five fundamental ratios for stock analysis, alongside Price-to-Earnings (P/E), Price/Earnings-to-Growth (PEG), Return on Equity (ROE), and Price-to-Book (P/B). Each ratio views a stock from a different angle. The D/E ratio specifically tells you about capital structure and risk. Used in combination with the others, it tells you whether a company's financial position matches its market valuation.
Here is a five-point approach built for Indian retail investors screening on NSE and BSE:
| Step | Action | What to Look For |
| 1 | Set sector-appropriate D/E ceiling | For non-financial companies, above 2.0 needs justification |
| 2 | Check interest coverage ratio | EBIT should be at least 3–4x annual interest expense. Below 2x is a warning |
| 3 | Review D/E trend over 3–5 years | Falling D/E = cash generation, debt paydown. Rising D/E without revenue growth = red flag |
| 4 | Check promoter pledge percentage | Above 20–25% pledging elevates risk regardless of D/E |
| 5 | Cross-reference with ROE | High D/E + ROE above 15% = productive borrowing. High D/E + falling ROE = danger zone |
Use Screener.in's historical data to plot the debt to equity ratio trend over multiple years. A single year snapshot is never enough.
Debt to Equity Ratio ka matlab kya hota hai?
Yeh ratio batata hai ki ek company ne kitna paisa baahr se udhar liya hai (debt), apni khud ki capital (equity) ke muqable mein.
Agar kisi company ka debt to equity ratio 2.0 hai, toh iska matlab hai ki har ₹1 apni equity ke liye, company ne ₹2 baahr se liye hain. Yeh D/E jitna zyada hoga, utna zyada financial risk hoga.
Lekin sector ke hisaab se iska matlab badal jaata hai. Banking sector mein zyada D/E normal hai. IT sector mein zyada D/E concerning hoti hai.
Indian retail investors ke liye zaroori hai ki debt to equity ratio ko sirf ek sector ke andar compare karein, na ki universal benchmark se. Aur hamesha promoter pledging bhi zaroor dekhein. Yeh aksar headline D/E se zyada important signal deta hai.
Warren Buffett checks the debt to equity ratio before almost anything else. Peter Lynch built a career on avoiding companies that debt could destroy. These are not theoretical frameworks, they are the practical filters that separated winning portfolios from losing ones across decades and market cycles.
For Indian retail investors navigating NSE and BSE, the debt to equity ratio is not a pass/fail test. It is a conversation starter. It tells you which questions to ask next. The investors who ask those questions consistently, using the D/E ratio as the first screen and then layering in ROE, interest coverage, promoter pledging, and sector benchmarks, are the ones who avoid the balance sheet landmines before they detonate.
Start with the debt to equity ratio. Everything else follows from there.
Open your Demat account on Shree Varahi by Lakshmishree and access research tools built for the Indian market.
Used by investors to avoid "Value Traps"
The debt to equity ratio measures how much debt a company uses compared to its own equity capital. A D/E of 1.0 means equal debt and equity. Above 1.0 means the company relies more on borrowed money than its own capital. It is one of the first checks you should run before buying any stock on NSE or BSE, and one of the same filters Warren Buffett uses before he invests.
Debt to Equity Ratio = Total Debt ÷ Total Shareholders' Equity. Total Debt includes all short-term and long-term borrowings. Shareholders' Equity is total assets minus total liabilities. Both figures are available in any company's quarterly or annual results filing on BSE or NSE.
There is no universal answer. It depends on the sector. For non-financial companies, a D/E below 1.0 is conservative and below 2.0 is acceptable in capital-intensive sectors. For banks and NBFCs, D/E ratios of 5–10x are normal because borrowing is the core business model. Always compare against the sector peer group, not an absolute number.
It means the company has ₹1.5 of debt for every ₹1 of equity. For a steel manufacturer or infrastructure company, a D/E of 1.5 is moderate and acceptable. For an IT company or FMCG firm, a D/E of 1.5 would indicate unusually high borrowing that warrants investigation.
In most sectors, yes. It sits right at Buffett's preferred threshold. A D/E of 0.5 means the company is primarily equity-funded with modest borrowings. It indicates financial conservatism, lower interest burden, and greater flexibility to borrow when needed. However, it could also mean the company is not using available capital to amplify returns, which may limit ROE growth compared to peers who use debt more strategically.
Dramatically. Banking and financial services companies regularly operate with D/E ratios above 5.0. Infrastructure and real estate firms typically carry a D/E of 1.5–3.0. IT and software companies often have a D/E near zero because they are asset-light and cash-generative. A D/E of 2.0 means something completely different depending on the industry you are analysing.
Debt to Equity Ratio yaani D/E ratio yeh batata hai ki ek company apne kaam ke liye kitna paisa khud ke paas se layi hai (equity) aur kitna baankon ya investors se udhar liya hai (debt). Agar D/E 1.0 se zyada hai, toh company zyada debt par depend kar rahi hai. Indian share market mein yeh ratio Screener.in ya NSE filings se aasaani se mil jaata hai.
When evaluating an IPO, the debt to equity ratio in the DRHP tells you how much debt the company is carrying before it lists. A high D/E at IPO stage means the company may use proceeds to pay down debt rather than fund growth, which directly affects how you value the issue price. Always check the D/E alongside use-of-proceeds disclosures in any DRHP filed with SEBI.
You can find the debt to equity ratio for any NSE or BSE-listed company on Screener.in, Tickertape, Trendlyne, or the company's investor relations page. The balance sheet section shows total borrowings and total equity. You can also calculate the D/E manually from quarterly or annual results filings on the BSE and NSE websites.
This article is for educational and informational purposes only and does not constitute investment advice or a recommendation to buy or sell any specific security. Investing in stocks involves market risk. Past performance is not indicative of future results. Please conduct your own due diligence before making any investment decisions. Lakshmishree Investment and Securities is a SEBI-registered entity.

