
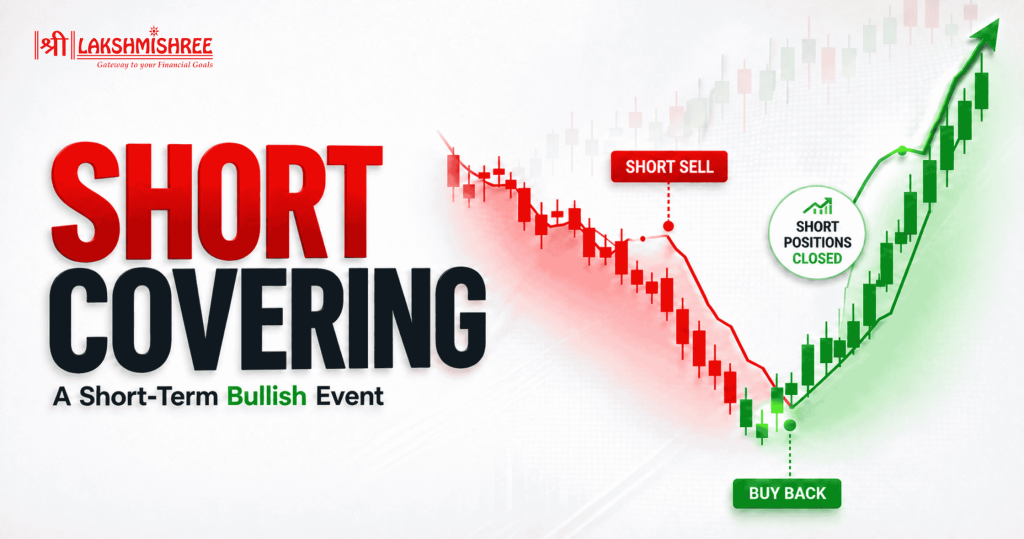
Short covering is the process of buying back previously sold shares or contracts to close an existing short position. It often leads to a sharp rise in prices, which many traders mistake for fresh buying.
Understanding this helps you interpret sudden price movements, analyse market sentiment, and avoid making decisions based on misleading rallies.
In this guide, you will learn what it is, how it works, why it happens, and how can you identify it using price action and Open Interest (OI).
It is the process of buying back shares or derivative contracts that were previously sold short to close an existing position. Since every short sell must eventually be closed with a buy order, this is a natural part of short selling.
In the stock market, short covering often creates temporary buying pressure, causing prices to rise. However, this price increase doesn't always indicate fresh bullish sentiment, it may simply reflect traders exiting their bearish positions. Understanding this distinction helps you interpret market movements more accurately.
It can be identified by analysing price action along with derivatives data. Here are the most common signs:
Price ↑ + Open Interest ↓ = Short Covering
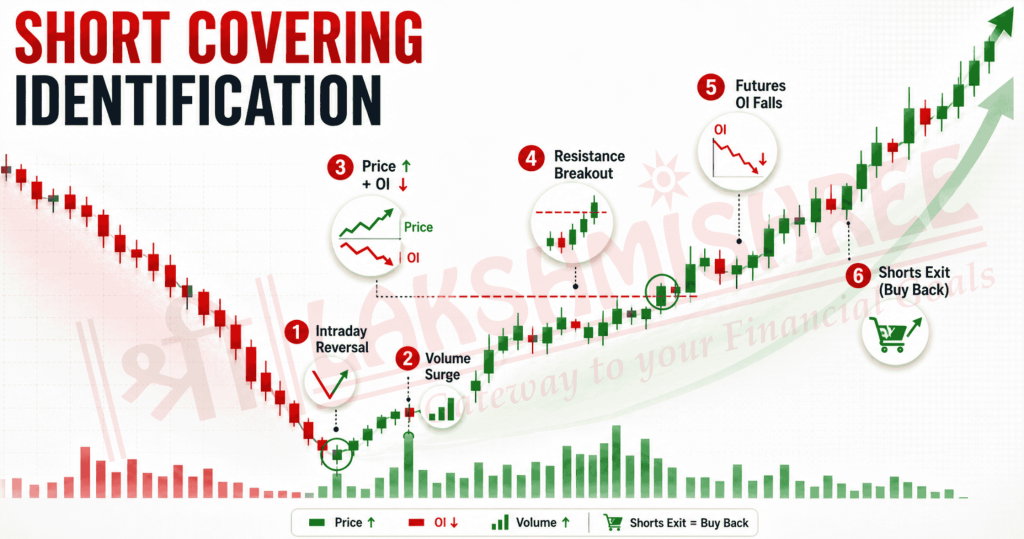
The process follows these simple steps:
If you'd like to understand how traders create bearish positions before covering them, read our detailed guide on Short Buildup.
Covering rally occurs when traders decide or are forced to exit their short positions. This can happen for several reasons, including profit booking after a successful trade, stop-losses triggered by rising prices, positive news or strong earnings, technical breakouts above resistance levels, expiry-related adjustments in futures and options, or a sudden improvement in overall market sentiment.
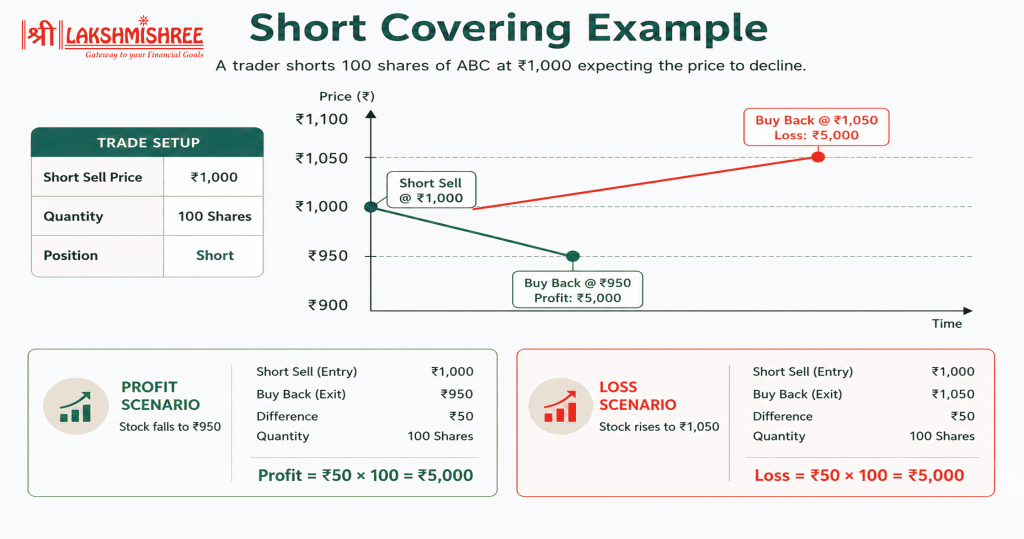
Let's understand this concept with a simple example.
Suppose a trader believes the share price of Company ABC, currently trading at ₹1,000, will decline. The trader shorts 100 shares at ₹1,000.
If the stock falls to ₹950, the trader buys back the 100 shares to close the position.
If positive news pushes the stock to ₹1,050, the trader decides to exit to avoid further losses.
In both situations, the trader must buy back the shares to close the short position. When many traders do this simultaneously, the increased buying demand can push prices higher, leading to a short covering rally.
Although both short covering and fresh buying can cause prices to rise, they represent different market activities.
| Basis | Short Covering | Fresh Buying |
| Purpose | Close existing short positions | Create new long positions |
| Market Participants | Existing short sellers | New or existing bullish traders |
| Price Movement | Usually rises | Usually rises |
| Open Interest | Declines | Increases |
| Trend Sustainability | Often temporary | More likely to continue |
| Market Psychology | Bearish traders exiting | Bullish traders entering |
A rising price with declining Open Interest generally indicates short covering, whereas rising prices with increasing Open Interest usually suggest fresh buying.
If you're looking to understand how bearish positions are created before they're covered, read our detailed guide on Short Buildup.
Short covering and short buildup are opposite market activities.
| Basis | Short Covering | Short Buildup |
| Meaning | Closing existing short positions | Creating new short positions |
| Price Movement | Rising | Falling |
| Open Interest | Decreases | Increases |
| Market Sentiment | Bearish sentiment weakens | Bearish sentiment strengthens |
| Buying Activity | Buy orders close positions | Sell orders create new positions |
| Trend | Can signal a reversal | Supports a downtrend |
This can help traders identify potential buying opportunities, but it should always be confirmed with multiple indicators.
Before entering a trade:

Even after identifying short covering, managing risk is essential.
Short covering is the process of buying back previously sold shares or contracts to close a short position. It often leads to temporary buying pressure and sharp price rallies, but these moves should not always be interpreted as fresh bullish buying.
By analysing price action alongside Open Interest, trading volume, and technical indicators, traders can better identify this and distinguish it from fresh buying. Using multiple confirmations before entering a trade can improve decision-making and reduce the chances of acting on false signals.
It is the process of buying back shares or contracts that were previously sold short to close an existing short position.
Short covering is generally considered short-term bullish because it pushes prices higher. However, the rally may be temporary unless supported by fresh buying.
Short selling involves selling an asset in anticipation of a price decline, while short covering refers to buying it back to close that short position.
Traders typically look for rising prices, declining Open Interest, higher trading volume, and confirmation from technical indicators such as RSI or MACD.
No. This can result in a temporary rally, but a sustained uptrend usually requires fresh buying from market participants.
Yes. Although long-term investors may not trade short-term price movements, understanding short covering helps them interpret sudden rallies and avoid confusing them with genuine long-term bullish trends.
Disclaimer: This article is intended for educational purposes only. Please note that the data related to the mentioned companies may change over time. The securities referenced are provided as examples and should not be considered as recommendations.