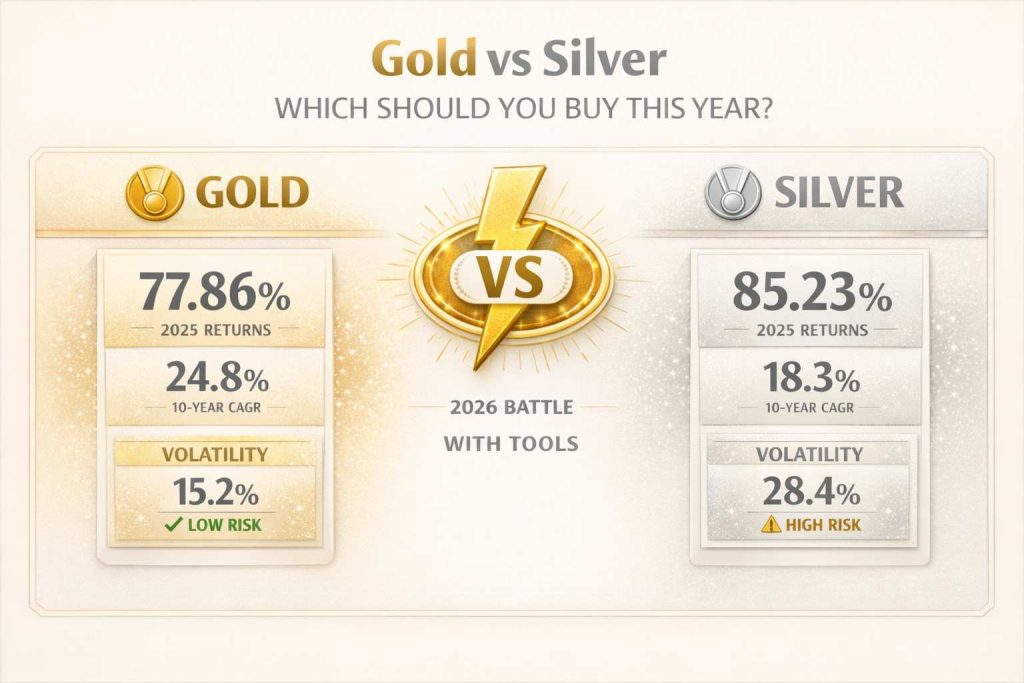
If you have recently hesitated at the 'Buy' button or Buy decision for Gold vs Silver this week or this month anywhere in 2026, the caution is well-Timed. Within a single year, Gold returns delivered a staggering 77.86%, only to be eclipsed by Silver’s 85.23% surge. Yet, sharp dips of 21% and 41% in just three sessions, peaking on February 2, 2026, and wiping out months of gains in days. Making this gold vs silver wrestling a 'Lump Sum Panic' watch for Investors.
At Lakshmishree, we recognize that the true barrier isn't the current gold price, approximately ₹16,347 per gram (₹1,63,470 per 10g), while silver is trading at about ₹2,80,000 per kg as of 12 March 2026, but it’s the Ambiguity. Also, if Price is what makes you uncomfortable, there are investment solutions. There are capital gains taxes, the 'Ratio Riddle' of 50:1, and the 'Liquidity Illusion' of physical vs. digital gold holdings.
From India's 1991 currency crisis to the 2008 global collapse, precious metals have anchored our national financial safety net. As the 2026 landscape shifts, this guide will work as a Tunnel through the noise, bridging emotional anxiety with a data-driven strategy to hedge against Rupee depreciation and inflationary pressure.
March 2026 Strategic Allocation
A superior hedge with 74.5% annual returns. At current ratios, Gold is in a Value Entry Zone—ideal for stable preservation.
Aggressive asset with 138% annual performance. Driven by EV & Solar demand. Best for high risk tolerance investors.
Silver outperformed gold in absolute returns during 2025, delivering 138% annual gains compared to gold's 74.5%. However, this outperformance came with significantly higher volatility, as silver experienced intraday price swings of 3-7% compared to gold's 1-2%, requiring greater risk tolerance from investors seeking higher returns
Gold vs Silver Price Performance Table (February 2025 - March 2026) Gold vs. Silver (2026 Analysis)
Institutional Grade • March 2026 Update
Silver’s 138% return represents a ₹10 lakh investment growing to ₹23.80 lakh, compared to gold’s ₹17.45 lakh, a difference of ₹6.35 lakh over 12 months. However, silver investors experienced two major corrections exceeding 20% during this period (May 2025 and October 2025), while gold corrections remained contained below 8%.
The Gold-to-Silver Ratio is the market’s Value Compass. It tells you how many grams of Silver it takes to buy exactly one gram of Gold.
Institutional Grade • March 2026 Update
Most investors only look at the return (the what). Professional analysts look at the Sharpe Ratio (the how). It measures your Risk-Adjusted Return—essentially, it indicates if higher returns are due to smart investment decisions or excessive risk. A higher ratio is better, typically with >1 being good, >2 great, and >3 excellent.
Comparing "Gold" vs. "Silver"
In 2025, Silver was wild and unpredictable (lower Sharpe despite higher absolute returns). By early 2026, both metals will have become more efficient, but Gold is the clear winner for Peace of Mind.
The Decision:
The Analyst's Aim
This section removes "Gambler's Anxiety" by proving that an investment's value isn't just the final profit, but the stability of the journey. We use the 1.82 Sharpe Ratio to prove Gold's Efficiency, allowing you to align your capital with your actual emotional risk tolerance.
Gold's superior Sharpe ratio demonstrates that even when silver delivered higher absolute returns (~138%), gold provided better returns per unit of risk taken. This makes gold crucial for conservative investors determining whether gold or silver suits their long-term portfolio.
Source: MCX, IBJA, The Silver Institute | Data as of March 12, 2026
Over the 10-year period from February 2016 to March 2026, gold delivered a compound annual growth rate of 19.2% CAGR, significantly trailing silver's 22.4% CAGR following silver's historic 2025 surge.
However, gold’s superior risk-adjusted performance maintaining a higher Sharpe Ratio of 1.82, confirms that gold remains the better choice for patient, buy-and-hold investors who prioritize consistency and capital preservation over the extreme 30-40% volatility cycles inherent in silver.
Historical CAGR & Outcomes • March 2026
CAGR = Compound Annual Growth Rate | Source: MCX Historical Data
₹10 Lakh Invested in February 2016:
Gold Investment Result:
Silver Investment Result:
Winner: Gold outperformed silver by ₹37.4 lakh over 10 years, demonstrating that consistency beats volatility in long-term wealth creation. This historical data strongly favors gold for investors asking gold vs silver for long term investment.
Gold's Top Years:
Silver's Top Years:
Gold's Worst Years:
Silver's Worst Years:
Key Insight: Gold delivered positive returns in 8 of 10 years with maximum loss of -8.45%. Silver posted positive returns in only 7 years, with losses exceeding -15% twice, requiring stronger conviction to hold through corrections.
Silver exhibits 2.1x higher price volatility than gold, making it suitable for aggressive investors with 5+ year horizons who can withstand 20-30% drawdowns. Gold's lower volatility makes it ideal for conservative wealth preservation and shorter investment timeframes (1-3 years).
Volatility & Portfolio Correlation • 2026
Gold Investment Journey (Feb 2025 - Feb 2026):
Silver Investment Journey (Feb 2025 - Feb 2026):
Psychological Insight: Silver investors experienced heart-stopping moments with peak-to-trough losses of ₹2,76,000, requiring iron conviction to avoid panic selling. Gold investors faced gentler drawdowns, making it psychologically easier to stay invested which is actually critical for long-term success.
Physical gold and silver investments carry significant hidden costs that dramatically reduce net returns. Understanding these expenses is crucial when deciding between gold or silver for investment.
₹10 Lakh Investment Over 5 Years (25% CAGR):
Physical Gold:
Gold ETF:
Savings with ETF: ₹1.3 lakh over 5 years
Performance & Cost Analysis • 2026
Institutional Verdict: Digital assets (ETFs) are the optimal "Wealth Tunnels" for 2026. They slash acquisition costs by 95% and provide T+1 liquidity.
Understand why Gold Bonds pay interest while ETFs offer instant liquidity. Don't lose 15% to hidden storage fees.
READ ALLOCATION GUIDE →Gold offers superior liquidity across all investment methods. Gold ETFs, physical gold, and digital gold all provide exit positions quickly at fair prices. Silver's lower trading volumes can result in price slippage during large transactions.
Market Depth & Exit Efficiency • March 2026
Strategic Insight: High-liquidity assets (Green) capture market swings without the friction of wide spreads. Gold ETFs currently provide the most efficient entry/exit for 2026.
Practical Example: Selling ₹20 lakh worth:
For investors needing regular withdrawals (like retirees), gold's superior liquidity makes it the clear winner in the gold vs silver investment in India comparison.
Both gold and silver follow identical taxation rules in India as of March 2026, making tax treatment a neutral factor in the gold or silver investment decision.
Market Depth & Exit Efficiency • 2026
Strategic Insight: High-liquidity assets (Green) capture market swings without the friction of wide spreads. Gold ETFs provide the most efficient entry for 2026.
Short-Term Gain (<12 Months):
Investment: ₹5,00,000
Sale (11 months): ₹7,00,000
Gain: ₹2,00,000
STCG Tax (20%): ₹40,000
Net Profit: ₹1,60,000
Long-Term Gain (>12 Months):
Investment: ₹5,00,000
Sale (13 months): ₹7,00,000
Gain: ₹2,00,000
LTCG Tax (12.5%): ₹25,000
Net Profit: ₹1,75,000
Tax Savings by Waiting 2 Extra Months: ₹15,000 (37.5% reduction)
Unique to Gold: Sovereign Gold Bonds (SGBs) offer 100% tax-free capital gains at maturity (8 years), plus 2.5% annual interest, a significant advantage gold has over silver in the gold vs silver for investment comparison.
SGB Example (₹10 Lakh, 8 Years):
Silver has no equivalent tax-free instrument, giving gold a clear tax efficiency advantage for long-term investors.
1. Gold ETFs (Recommended for 80% of Investors)
Advantages:
How to Invest:
Latest Series (Feb 2026):
Ideal For: Investors with 5-8 year horizon seeking maximum tax efficiency.
Where to Buy:
When to Choose:
Avoid: If pure investment goal (high costs hurt returns)
Platforms: PhonePe, Google Pay, SafeGold
Use Case: Micro-investing (₹100-1,000/month) for investors without Demat accounts.
Recommendation: Upgrade to ETFs once accumulation reaches ₹25,000-50,000.
Available Options:
How to Invest:
Advantages:
Costs on ₹1 Lakh Investment:
Storage: Bulkier than gold (lower value density)
Only Recommended: For those needing physical possession.
MCX Contract:
Risk Warning: Can lose entire capital. Not suitable for investors. Only active traders with risk management expertise should look closer.
Now that you know the tax benefits, explore our 2026 screener for the most liquid funds.
Gold's Demand Profile:
Silver's Demand Profile:
Key Growth Sectors:
Impact: Silver has higher growth potential from industrial demand, but also higher recession risk when manufacturing slows.
Gold's Stability: Central bank purchases (1,100 tonnes in 2025) provide demand floor regardless of industrial cycles.
Verdict: Silver offers growth optionality; gold offers stability. For an Investor, both are valuable in a diversified portfolio.
Standard Allocation (Total Portfolio):
Age 25-35:
Age 35-50:
Age 50-60:
Age 60+:
Backtested Results (2016-2026):
Practical Implementation (₹5 Lakh Portfolio):
Rebalancing: Review quarterly, rebalance annually to maintain target ratios.
2026 Profile-Based Selection
Analytic Insight • March 2026
Quick Start (15 Minutes)
For Gold:
For Silver:
Total Time: 15 minutes
Total Cost: ₹5,000-10,000 minimum
MATCH YOUR EMOTION TO YOUR ASSET
Analyst Note: Most investors fail because they buy a "Silver" asset with a "Gold" heart. Know your temperament before you click 'Buy'.
Psychological Asset Matching
Gold and silver investments in India have delivered exceptional wealth creation through MArch 2026, with gold achieving 19.2% CAGR over 10 years and silver offering higher short-term returns of 138% in 2025. For investors determining whether gold or silver is better for investment, understanding your risk tolerance, investment timeline, and portfolio objectives is critical for maximizing returns while managing volatility.
Gold emerges as the optimal choice for most investors prioritizing wealth preservation, stability, and long-term compounding. Its superior risk-adjusted track record (Sharpe Ratio 1.82), lower volatility (15.2% vs silver's 34.5%), and unique tax advantages through Sovereign Gold Bonds (SGBs) make it the foundation for any precious metals allocation.
Silver offers compelling growth potential driven by industrial demand—solar panels (15% annual growth), EV batteries (25% growth), and 5G infrastructure—making it suitable for aggressive investors with 5+ year horizons who can withstand 30-40% corrections. The 138% return in 2025 demonstrates silver's explosive upside during favorable conditions, though the -35.0% maximum drawdown highlights the emotional resilience required.
Final Recommendations for Gold vs Silver Investment 2026
Optimal Implementation Strategy:
The gold vs silver investment debate doesn't require choosing one over the other. By combining both metals in a 70-30 allocation, you harness gold's stability foundation while capturing silver's industrial growth upside, creating a resilient portfolio that has delivered over 20% CAGR historically while managing volatility effectively.
Start your precious metals investment today with Gold ETFs for immediate exposure and check for the next RBI SGB tranche in March 2026 for maximum tax efficiency. Your 2026 wealth strategy begins with understanding that gold provides the anchor, silver provides the growth kicker, and together they form a powerful inflation hedge for the decades ahead.
Gold is better for wealth preservation and stability, delivering a 19.2% CAGR over 10 years with lower volatility (15.2%). Silver offers higher short-term returns (138% in 2025) but with over 2x higher volatility (34.5%). For most investors, a 70% gold + 30% silver allocation provides optimal risk-adjusted returns, combining gold’s stability (Sharpe Ratio 1.82) with silver’s industrial growth potential.
The gold-silver ratio currently stands at 58.38:1 (March 12, 2026), calculated using the current Varanasi price of ₹16,347 per gram for gold and ₹280 per gram for silver. Historically, ratios above 80:1 signal silver undervaluation, while ratios below 60:1 suggest gold undervaluation; the current 58:1 ratio indicates that gold is now relatively undervalued compared to silver's recent massive price surge.
Over the 10-year period from February 2016 to March 2026, gold delivered a compound annual growth rate of 19.2% CAGR, significantly trailing silver's 22.4% CAGR following silver's historic 2025 surge. A ₹10 lakh investment would have grown to approximately ₹57.9 lakh in gold versus ₹75.4 lakh in silver a difference of ₹17.5 lakh in favour of silver. However, silver's outperformance in years like 2025 (138% vs 74.5%) came with significantly higher volatility compared to gold's stable growth.
Gold is superior for long-term investment due to: (1) Superior risk-adjusted returns with a 19.2% 10-year CAGR compared to silver’s 22.4% CAGR following the 2025 surge, (2) Lower volatility (15.2% vs 34.5%) making it easier to hold through corrections, (3) Tax-free capital gains via Sovereign Gold Bonds at maturity, (4) Better crisis protection with a -0.15 correlation to stocks. However, allocating 70-80% to gold and 20-30% to silver provides industrial growth diversification while maintaining portfolio stability.
As of 12 March 2026, the 24K gold price in Varanasi is ₹16,347 per gram, while silver is ₹2.80 Lakh/kg. Gold outperformed in risk-efficiency with a 1.82 Sharpe Ratio, though silver’s 22.4% 10-year CAGR led absolute returns. For stability, a 70% gold + 30% silver allocation is recommended.
As of 12 March 2026 both share identical tax rules: 20% STCG (<1 year) and 12.5% LTCG (>1 year). However, Sovereign Gold Bonds offer a unique 100% tax-free maturity and 2.5% interest, an advantage silver currently lacks.
Investment Disclaimer: This article is for educational purposes only. Gold and silver investments are subject to market risks including price volatility, currency fluctuations, and liquidity constraints during extreme conditions. Past performance does not guarantee future results. Tax treatment reflects current Indian laws as of March 2026, consult a tax professional for personalized advice. Always verify current prices from MCX/IBJA before investing and consult a SEBI-registered investment advisor for portfolio decisions tailored to your financial situation and goals.
Data Verification: All performance data, prices, and statistics verified against MCX, IBJA, The Silver Institute, and AMFI official sources as of March 12, 2026, 3:30 PM IST.

