
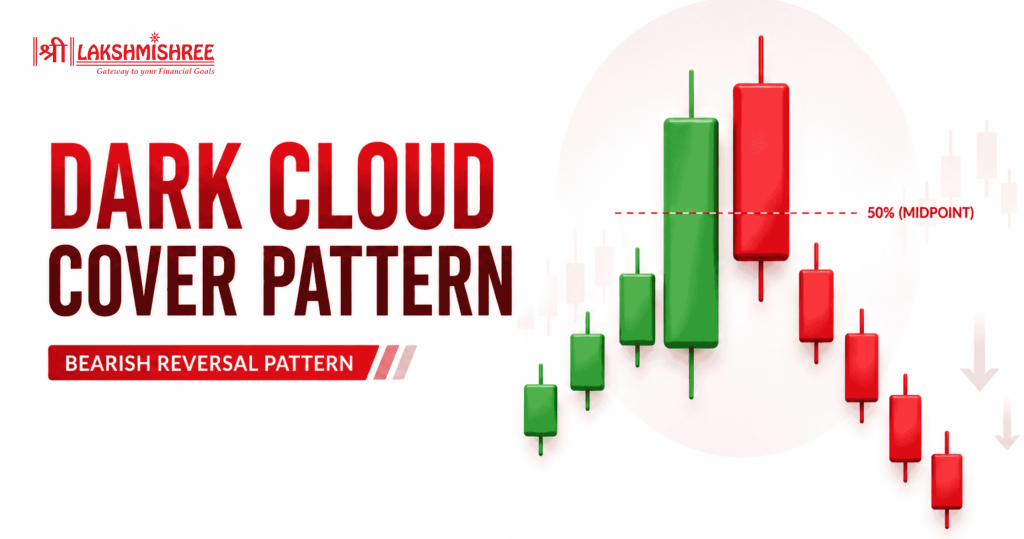
If you ever wondered about bearish reversal candlestick patterns, Dark Cloud Cover Pattern is one of the most recognised bearish reversal candlestick patterns used in technical analysis to identify potential trend reversals after an uptrend. It reflects a shift in market sentiment where buying momentum starts weakening and sellers begin taking control. Although the pattern alone is not a guarantee of a reversal, combining it with confirmation signals and technical indicators can significantly improve trading decisions.
In this guide, you will learn how the Dark Cloud Cover pattern forms, what it indicates, and how you can trade it effectively.
The Dark Cloud Cover candlestick pattern is a bearish reversal signal consisting of two consecutive candlesticks that typically appears after a sustained uptrend, marking a point where buyers are losing control and sellers are stepping in.
Technical analysts monitor this pattern closely because it can mark the start of a short to medium term price correction. The signal alone doesn't guarantee a reversal, but its reliability improves when supported by higher trading volume, resistance levels, or technical indicators. Traders often use it to spot exit points on long positions or to prepare for short selling opportunities once confirmation appears.
To identify a valid Dark Cloud Cover pattern, you can look for these characteristics occurring together:
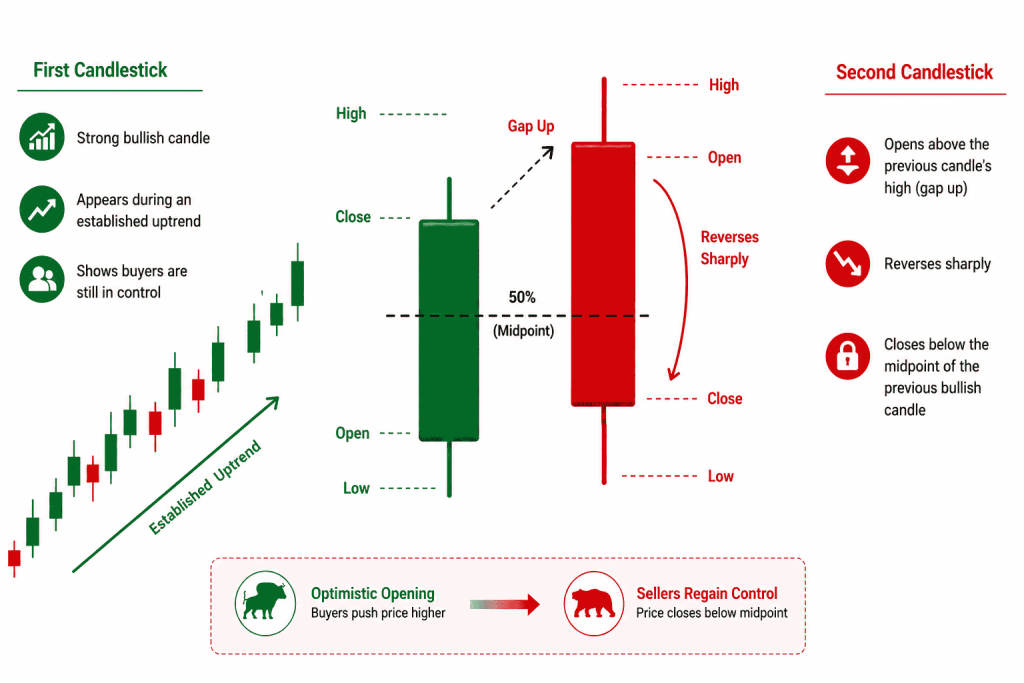
A Dark Cloud Cover pattern is more reliable when these conditions occur together, helping you distinguish a potential bearish reversal from a temporary pullback.
| Advantages | Limitations |
| Easy to identify on price charts. | Can generate false signals. |
| Provides an early bearish reversal signal. | Requires confirmation before trading. |
| Works across stocks, forex, commodities, and indices. | Less effective during sideways or highly volatile markets. |
| More reliable when combined with technical indicators. | Does not indicate the extent of the price decline. |
| Supports disciplined risk management with clear stop-loss levels. | May fail during strong bullish trends. |
| Offers favourable risk-reward potential with proper confirmation. | Should not be used as a standalone trading signal. |
Recognising the pattern is only the first step, you should focus on confirmation before entering a position.
Psychologically, the Dark Cloud Cover captures a sudden change of control within a single session. Buyers push the open higher, continuing the prevailing optimism, but sellers overwhelm that strength before the close. This sharp intraday reversal signals weakening buying momentum and rising bearish sentiment, even though the session started on an optimistic note.
Since the Dark Cloud Cover is an early warning rather than a guaranteed reversal, confirmation is essential before entering a trade.
Wait for the next candlestick to validate the reversal. A stronger bearish signal is present when:
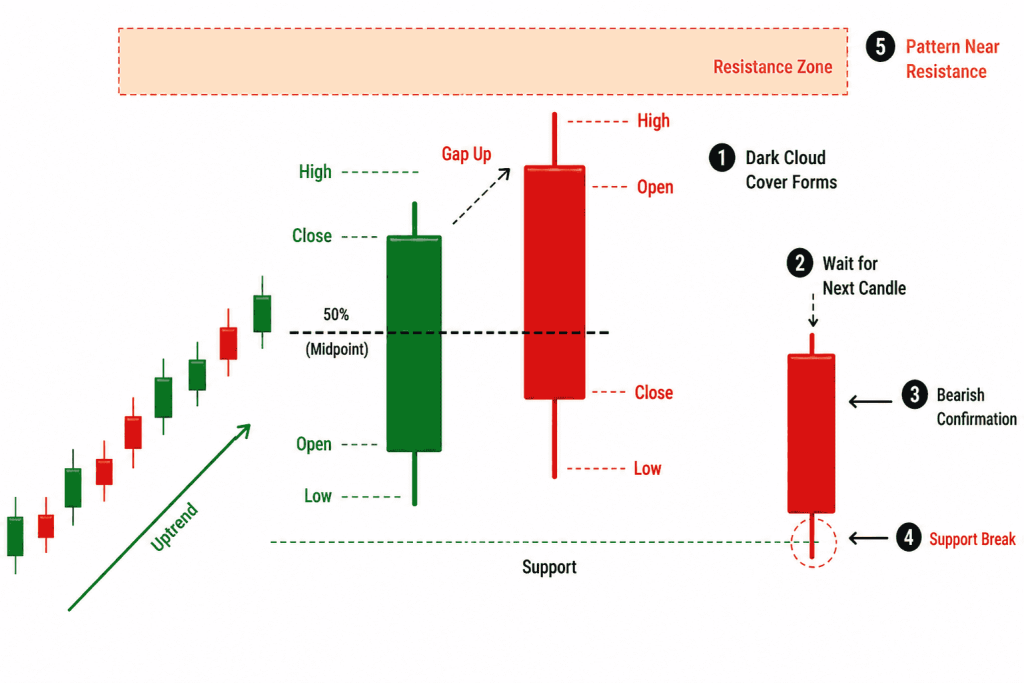
These confirmations reduce the likelihood of false signals and improve the quality of trade setups.
While price action confirmation is often sufficient if you are an experienced traders, combining the pattern with technical indicators can improve the probability of your successful trades.
There is no single confirmation method that works in every market condition, choose an approach that fits your trading style:
Once the Dark Cloud Cover pattern has been confirmed through price action or technical indicators, traders can begin planning their trade. A well defined trading strategy, including entry, stop-loss, profit target, and risk management, helps ensure that decisions are based on confirmation rather than emotion, improving the overall quality of the trade.
Enter a short trade only after the Dark Cloud Cover pattern is confirmed by the next bearish candle or supporting technical indicators.
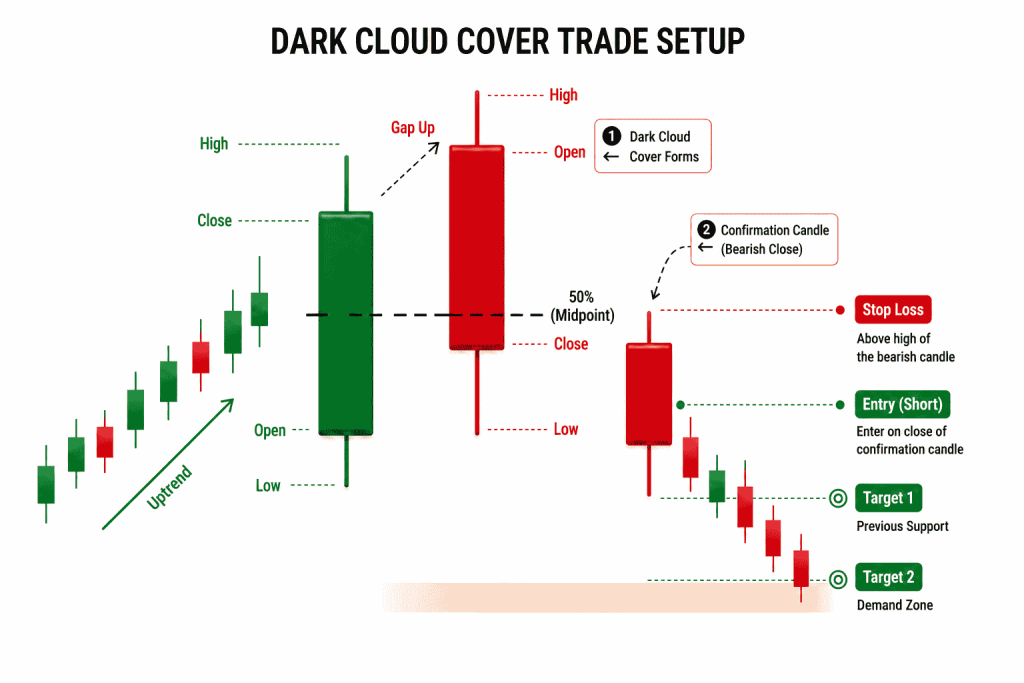
Place the stop-loss above the high of the bearish (second) candle to limit risk if the pattern fails.
Book profits near the previous support level, a key demand zone, or based on a predefined risk-reward ratio such as 1:2 or 1:3.
Trade only after confirmation, use proper position sizing, and avoid taking trades during sideways market conditions.
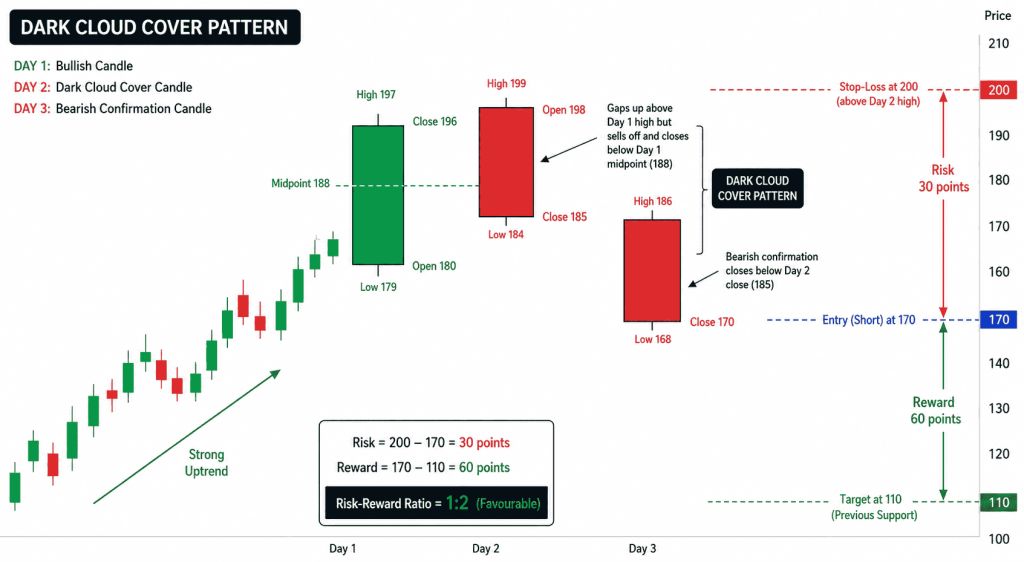
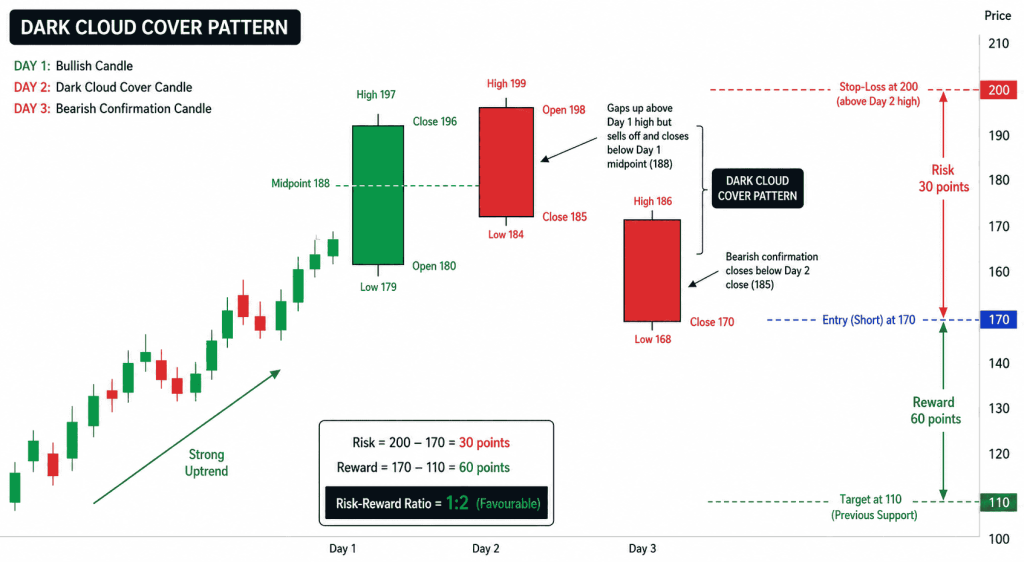
A stock in a strong uptrend approaches a major resistance level. On Day 1, a large bullish candle forms, opening at 180 and closing at 196 (high 197, low 179), buyers are clearly in control, and the candle's midpoint sits at 188.
On Day 2, the stock gaps up and opens at 198, above Day 1's high, but faces aggressive selling throughout the session and closes at 185, below the Day 1 midpoint of 188. This forms a Dark Cloud Cover pattern.
On Day 3, another bearish candle closes at 170, below the Dark Cloud Cover candle's close, confirming the reversal. A trader enters a short position at 170 after this confirmation, places the stop-loss at 200 (just above the high of Day 2), and targets 110, a previous support level.
This gives a risk of 30 points (200 − 170) against a potential reward of 60 points (170 − 110), a risk-reward ratio of 1:2, which is generally considered favourable before committing to a trade.
Understanding how the Dark Cloud Cover differs from similar bearish reversal patterns helps traders choose the most appropriate signal.
| Feature | Dark Cloud Cover | Bearish Engulfing | Evening Star |
| Number of Candles | Two | Two | Three |
| Trend | Uptrend | Uptrend | Uptrend |
| Second Candle | Closes below midpoint of first candle | Fully engulfs the previous bullish candle | Third bearish candle confirms reversal |
| Signal Strength | Moderate | Strong | Strong |
| Confirmation Required | Yes | Recommended | Recommended |
The Bearish Engulfing pattern is generally considered stronger because its second candle completely engulfs the first. The Evening Star adds confirmation through its three candle structure, while the Dark Cloud Cover offers an earlier warning of weakening bullish momentum.
| Related Pattern | What You'll Learn |
| Hammer Candlestick Pattern | Bullish reversal after a downtrend. |
| Inverted Hammer Candlestick Pattern | Early signs of a potential bullish reversal. |
| Hanging Man Candlestick Pattern | Bearish reversal signal after an uptrend. |
| Shooting Star Candlestick Pattern | Identifying market tops and bearish reversals. |
| Morning Star Pattern | Three-candlestick bullish reversal pattern. |
| Evening Star Pattern | Three-candlestick bearish reversal pattern. |
| Double Bottom Pattern | Bullish chart pattern indicating a potential trend reversal. |
| Candlestick Reversal Patterns | A complete guide to major bullish and bearish reversal patterns. |
The Dark Cloud Cover candlestick pattern is a valuable bearish reversal signal that helps you identify potential shifts in market sentiment after an uptrend. It offers an early indication of weakening buying momentum, but it should never be used as a standalone trading signal.
Combining it with confirmation from price action, trading volume, support and resistance levels, and indicators such as RSI or MACD significantly improves its reliability. With disciplined risk management and patience for confirmation, traders can apply the Dark Cloud Cover pattern effectively across different markets and timeframes.
A Dark Cloud Cover is a two candlestick bearish reversal pattern that typically forms after an uptrend. It signals that buyers may be losing control while sellers are beginning to dominate the market.
It is a bearish reversal pattern that indicates a potential shift from an uptrend to a downward move.
Commonly used indicators include RSI, MACD, Moving Averages, Volume Analysis, and Fibonacci Retracement, as they help confirm the strength of the bearish reversal.
Yes. The pattern can be used in intraday trading, provided it is supported by confirmation from price action, volume, and other technical indicators.
Yes. Beginners can use the pattern effectively by learning its formation, waiting for confirmation, following proper risk management, and avoiding trades based solely on the candlestick pattern.
Yes. The pattern can be applied across stocks, forex, commodities, indices, and cryptocurrencies. It tends to perform best in trending markets and should always be confirmed before trading.