Tick trading is a powerful method for analyzing micro-price movements using tick charts. While these charts might look similar to regular candlestick charts, the key difference is that tick charts create bars based on the number of trades, not time intervals. By leveraging this real-time data, traders can identify trends, predict price breakouts, and make quick decisions—which is especially useful for day traders and scalpers.
Whether you're a beginner or a seasoned trader, tick chart trading provides unique insights that standard time-based charts simply can't match.
Tick trading tracks micro-price movements using tick charts, which are based on the number of trades rather than time intervals. Each tick represents a single trade, and a new tick chart bar forms after a set number of trades (e.g., 50 or 100 trades). This method provides a detailed market view, making it ideal for traders who need to make quick decisions in fast-moving markets like stocks, futures, and options.
Many traders use platforms like Trading Tick to monitor real-time price fluctuations and execute high-speed trades efficiently.
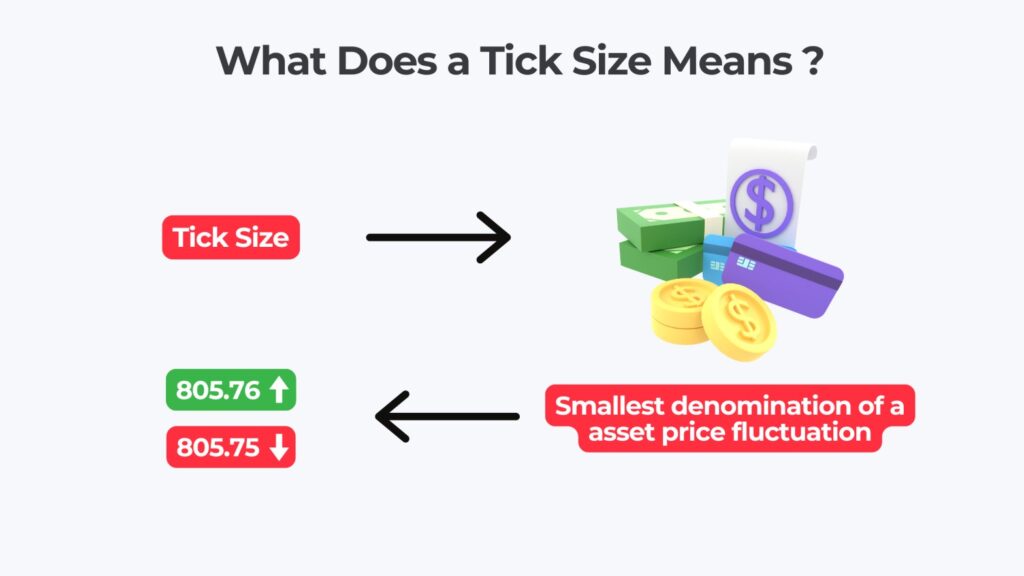
A tick is the smallest price movement a security or instrument can make, up or down. For example if a stock price moves from ₹200.50 to ₹200.55 that ₹0.05 change is one tick. Ticks are crucial for tracking price changes at the most granular level, providing deeper insights into market trends
Combined with tick chart trading, these movements allow traders to spot entry and exit opportunities in real-time, which is particularly useful for day traders and scalpers seeking small yet consistent profits.
Tick trading revolves around tick size, which defines the smallest price change allowed for a security. Every security has a predefined tick size, ensuring prices move in controlled increments to maintain market stability.
For example, let’s consider two stocks in the Indian market:
This structured movement ensures predictable price changes, which is especially beneficial in trading tick strategies, where traders rely on small, precise fluctuations to anticipate trends, breakouts, or reversals.
Also read: Options Trading in India: Strategies, Examples and Key Terms
Understanding the different types of ticks in trading is important to analyze market movements and make informed decisions. Ticks give you a granular view of how prices change with each trade and can be classified into three types:
Uptick is when the price of an asset goes up compared to its previous trade. For example, if a stock's last trade was at ₹100 and the next trade happens at ₹100.05, then ₹0.05 is an uptick. Upticks indicate buying pressure and can signify upward momentum in the market.
Downtick is the opposite of uptick—it’s when the price goes down compared to the last trade. For example, if the stock price drops from ₹100 to ₹99.95, then ₹0.05 is a downtick. Downticks may indicate selling pressure or bearish sentiment in the market.
Zero tick is when there is no change in price between two consecutive trades. For example, if a stock's last trade was at ₹100 and the next trade also happens at ₹100, then it’s a zero tick. Though it may seem insignificant, zero ticks can be a sign of market indecision or consolidation which traders can use to prepare for breakouts or reversals.
Tick trading is built around key components that help you track the market and make decisions. Here are the basics:

To capitalize on small price movements, traders use various tick trading strategies, including:
These strategies help traders navigate high-speed markets with precision and improve their chances of making profitable trades.
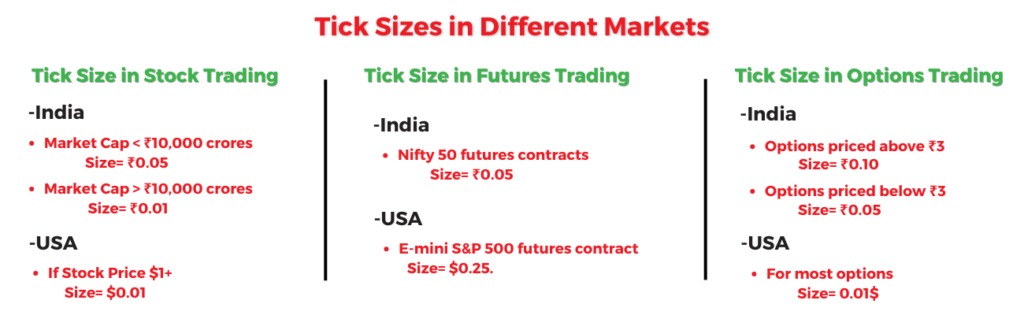
Tick sizes vary across different markets and asset classes as they are determined by regulations, market structures and the characteristics of the financial instruments being traded.
In stock trading, tick size represents the smallest price increment a stock can move. Regulatory bodies, such as SEBI in India and the SEC in the USA, define these increments to ensure orderly price movement and market stability.
Interesting Insight: Smaller tick sizes generally lead to higher liquidity, tighter bid-ask spreads, and smoother price transitions, while larger tick sizes may reduce excessive market noise.
In futures trading, tick size determines the smallest price fluctuation in a contract, directly impacting traders' profits or losses. Each futures contract has a predefined tick size based on its specifications.
In options trading, tick size defines the smallest price change an option contract can make. Tick sizes are essential for pricing accuracy, especially in volatile markets.
Tick size has some characteristics that impact trading decisions and market behaviour. Here’s a quick summary:
By understanding these traits, traders can align their tick trading strategies to optimise their decision-making and capitalise on market movements.
In recent years, Trading Tick has become a go-to resource for traders tracking live tick movements and executing short-term trading strategies. Many trading platforms now integrate TradingTick tools, offering enhanced tick chart analysis and tick-based trade execution.
One of the most useful features for options traders is the Trading Tick Option Chain, which provides real-time insights into option contracts, including bid-ask spreads, open interest, and volume. This helps traders make informed decisions when trading options based on tick price movements.
How Traders Use Trading Tick Tools?
Tick trading is tied to tick size, as the smallest price increment determines the framework within which traders operate. Here’s how tick trading depends on tick size:
1. Precision in Decision-Making
Tick size provides the foundation for quick, accurate decisions. Each tick represents a fixed price movement, enabling traders to enter or exit trades at precise levels strategically. For example, a tick size of ₹0.05 in stock trading helps traders act decisively on micro price movements.
2. Profit Targets and Stop-Loss Orders
Tick size helps traders structure their profit targets and stop-loss orders. The fixed price increments provide a disciplined and consistent framework for risk management, ensuring traders can adjust positions with minimal guesswork.
3. Quantifying Returns and Risks
Tick traders calculate returns and risks based on tick size. For example, in a market where one tick equals ₹0.05, traders know exactly how much profit or loss each movement represents. This clarity helps optimise strategies and improve risk-reward ratios.
4. Adaptability to Market Conditions
Tick size allows traders to adjust strategies depending on market volatility:
5. Impact on Costs and Profits
Transaction costs and potential profits depend heavily on tick size. Smaller tick sizes reduce the cost of entering and exiting trades, which is vital for frequent trading strategies like scalping.
Tick trading offers a structured and precise way to track micro-price movements in financial markets. By using tick charts and understanding tick size regulations, traders can make informed decisions, optimize strategies, and capitalize on short-term price fluctuations.
Whether you are a scalper, day trader, or algorithmic trader, mastering tick trading techniques can significantly enhance your ability to analyze trends, predict price movements, and execute trades efficiently.
Tick trading isn’t just a method; it’s a structured way of understanding how markets move—step by step, tick by tick.
A tick in trading refers to the smallest price movement of a financial instrument, either upward or downward. For example, in the Indian stock market, stocks with a tick size of ₹0.05 can only move in increments of ₹0.05, like ₹100.00 to ₹100.05 or ₹99.95.
A tick chart is a type of trading chart that plots price movements based on the number of trades rather than time intervals. For example, a 50-tick chart creates a new bar after 50 trades, regardless of how much time has passed.
A trading tick option chain is a detailed table that shows all the available options contracts for a particular stock or index, along with their tick sizes, strike prices and premiums.
Tick size impacts market liquidity by determining the number of price levels available for trading. Smaller tick sizes often result in higher liquidity, allowing for tighter bid-ask spreads and making it easier for traders to execute trades efficiently.
Yes, a beginner can use tick trading with proper knowledge and practice. Start with simple strategies like scalping or momentum trading on tick charts and gain experience and confidence in understanding market trends.
Tick size in futures trading is defined in the contract specifications of each instrument. For example, in Indian markets, the tick size for Nifty 50 futures is ₹0.05. Traders can calculate potential profit or loss by multiplying the tick size with the contract lot size.
Disclaimer: This article is intended for educational purposes only. Please note that the data related to the mentioned companies may change over time. The referenced securities are provided as examples and should not be considered recommendations.
