In trading, timing is everything. Whether you're looking for the ideal moment to enter or exit, finding reliable signals can make all the difference. That’s where the stochastic oscillator indicator shines. This powerful tool helps traders spot overbought and oversold conditions, making it easier to anticipate potential reversals in the market.
But how exactly does it work, and how can you use it effectively? This guide will walk you through everything—from understanding its basics to applying advanced strategies.
The stochastic oscillator is a momentum indicator that compares a stock’s closing price to its price range over a specific period, typically 14 periods. It’s designed to show where the stock’s price is relative to its recent high and low, helping traders identify whether it is potentially overbought or oversold. This can be especially useful in volatile markets, where quick shifts in momentum can signal entry and exit points for traders.
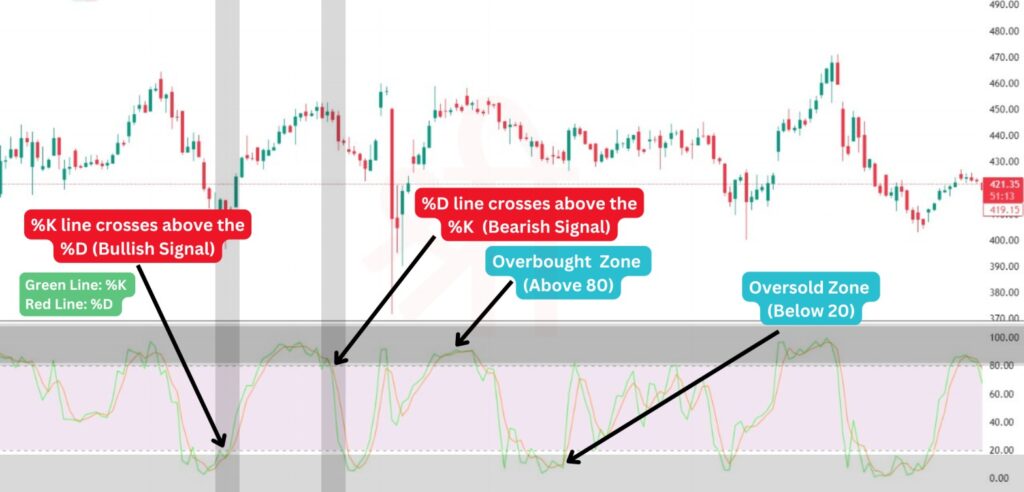
Two lines on the chart represent this indicator: the %K line, the main line, and the %D line, which is a moving average of %K. By observing the movement and interaction of these lines, traders can gain insights into potential reversals and trend strength, helping them make more informed trading decisions.
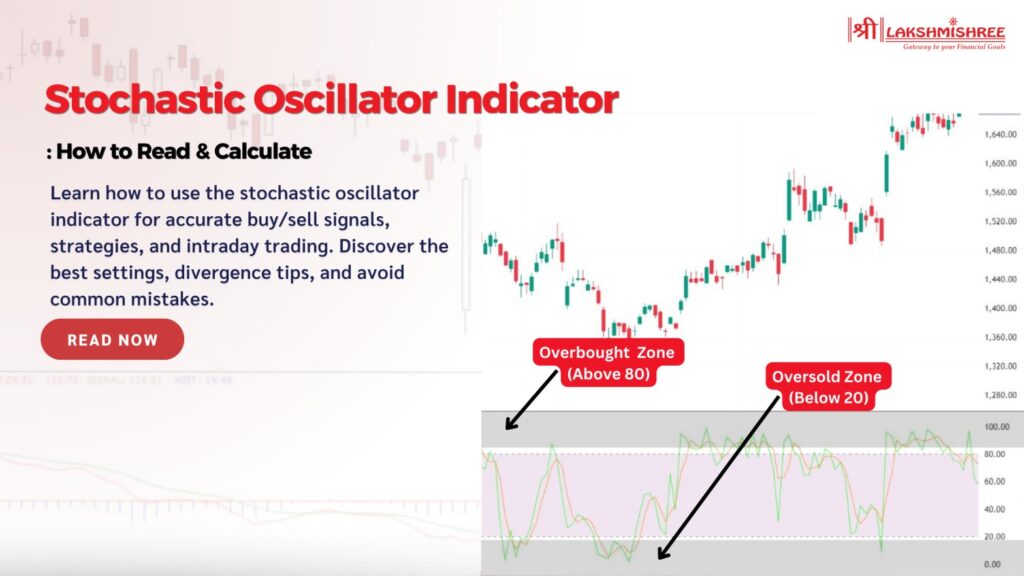
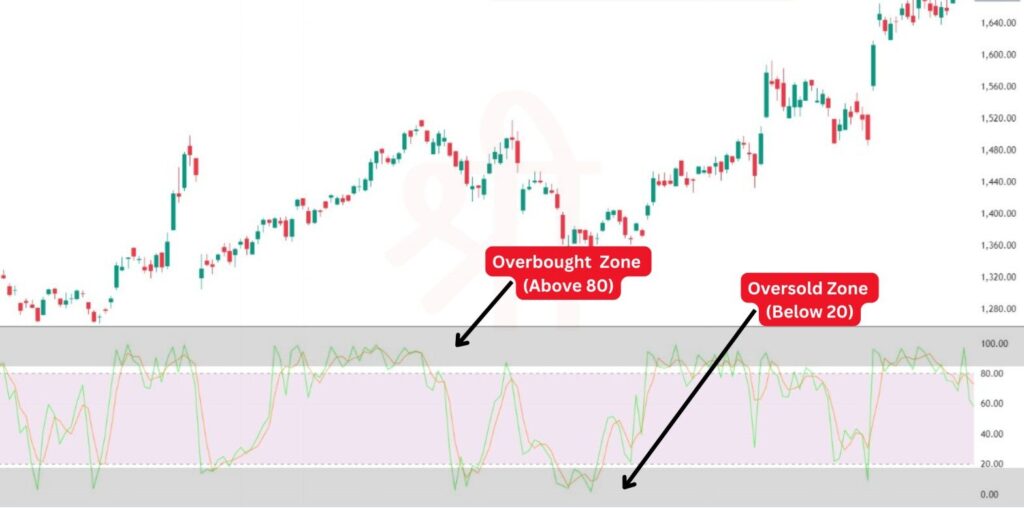
It helps traders understand where a stock’s price sits within its recent range by using a scale from 0 to 100. Here’s a simple breakdown of what different readings mean:
In addition, readings above 50 mean the stock is trading in the upper part of its recent range, while below 50 indicates it’s in the lower part. These levels give traders a quick snapshot of the stock’s momentum.
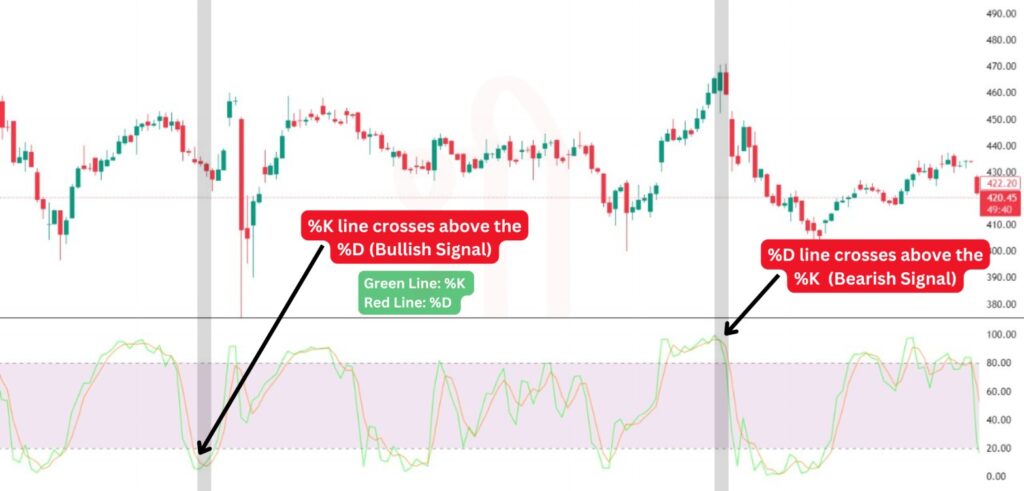
Key Signals to Watch: One of the most important signals in the oscillator is the crossover between the %K line and the %D line:
Crossovers in overbought (above 80) or oversold (below 20) zones are considered stronger signals. For instance, if the %K line crosses below the %D line when the oscillator is above 80, it strongly indicates that the stock might start declining. Similarly, a crossover below 20 suggests the stock could be set to rise.

It relies on two key components, the %K line and the %D line, to gauge momentum by comparing the closing price of an asset to its price range over a specific period.
The %K line represents the current price's position relative to the asset's price range over the last 14 periods (which could be days, hours, or minutes, depending on the timeframe you’re analysing). Here's the formula:
This calculation results in a percentage value between 0 and 100, showing where the current price stands relative to the recent high and low prices.
The %D line, on the other hand, is a smoothed version of the %K line. It’s calculated as the 3-period moving average of %K and serves as a signal line to identify potential reversals.
Where:
The %D line smooths out the fluctuations in %K, providing a clearer view of the trend direction.
Key Points to Remember
Lakshmishree automatically calculates the %K and %D values, so traders don’t have to perform these calculations manually.
Using the indicator effectively often comes down to applying it with specific strategies. Here, we’ll cover two popular strategies: Overbought/Oversold and Crossover. Both approaches can help traders identify potential entry and exit points, particularly in range-bound markets.
The Overbought/Oversold Strategy focuses on the 80 and 20 levels of the oscillator, which represent overbought and oversold conditions:
This strategy is especially useful when the market moves within a defined range, as overbought/oversold levels help pinpoint possible reversals.

The Crossover Strategy is based on the relationship between the %K and %D lines. This strategy can generate both buy and sell signals when these two lines cross each other in specific zones:
This strategy is often more effective in a range-bound market and may produce false signals during strong trends. However, combining it with other indicators, such as moving averages or RSI, can enhance its reliability.

The divergence strategy is used to identify potential trend reversals by observing discrepancies between price action and the stochastic indicator.
This strategy works well in range-bound markets, where reversals are more predictable. Used carefully, the divergence strategy can help you spot shifts in momentum and time your trades more effectively.
Choosing the right stochastic oscillator settings can optimize the indicator’s accuracy based on your trading style and asset type. Here’s a quick guide:
Adjusting your indicator settings based on the asset and timeframe can greatly improve signal reliability, helping you align the indicator with your specific trading strategy.
The stochastic oscillator and Relative Strength Index (RSI) are popular momentum indicators but have different strengths. Here’s how they compare and how combining them can enhance your trading strategy:
Combining the stochastic oscillator indicator and RSI strategy can improve accuracy in identifying potential trade setups, reducing false signals, especially in volatile markets.
The stochastic oscillator indicator is valuable for traders looking to gauge market momentum, identify potential reversals, and enhance their entry and exit points. When used with the right settings and combined with other indicators, it can help reduce false signals and improve trading accuracy.
However, like any indicator, it’s essential to understand its limitations and adapt its use based on market conditions. Experimenting with different oscillator settings and integrating additional tools can refine your trading strategy and give you a competitive edge.
For scalping, a faster setting like 5, 3, 3 is often used to capture short-term price movements and increase responsiveness.
While both are momentum indicators, the oscillator compares closing prices to a recent range, whereas the RSI measures the speed and change of price movements. Both can complement each other for better accuracy.
Yes, but longer settings like 21, 5, 5 are typically preferred for more stable signals in long-term trades, as they reduce sensitivity to short-term price fluctuations.
The ultimate oscillator combines multiple timeframes to provide a broader view of momentum, while the stochastic focuses on a single period’s high-low range. Each has its own strengths depending on the trading strategy.
Divergence can indicate a potential reversal, but waiting for confirmation is essential, as prices can continue trending despite divergence.
Combining the stochastic oscillator with other indicators like RSI or moving averages and adjusting settings based on market conditions can help improve signal accuracy.
Disclaimer: This article is intended for educational purposes only. Please note that the data related to the mentioned companies may change over time. The securities referenced are provided as examples and should not be considered as recommendations