
India added 28 GW of non-fossil capacity in just 6 months (Apr-Sep 2025). While Coal additions slowed to a record low. This is not a prediction. It has already happened. In June 2025, India reached its 50% non-fossil fuel capacity target five years ahead of schedule.
The power sector mutual fund landscape is splitting into two worlds:
Power sector mutual funds sit at this crossroads. Some funds are stuck in World 1 (declining thermal exposure). Others are positioned for World 2 (renewable energy surge). A few smart ones play both: extracting value from legacy infrastructure while riding the green transition. which we consider Optimum for investment strategy.
What you’ll learn:
The power sector is India’s ₹15 lakh crore infrastructure backbone. Here’s the guide to profit from it.
Power sector mutual funds are equity schemes investing 80%+ assets in companies involved in electricity generation, transmission, and distribution. These include thermal power plants (coal, gas), renewable energy (solar, wind, hydro), and grid infrastructure companies like NTPC, Power Grid Corporation, Tata Power, and Adani Green Energy.
The numbers tell the story:
What changed in 6 months (Apr-Sep 2025):
Ratio: 5.5:1 in favor of renewables.
Translation: For every 1 MW of coal/gas added, India is adding 5.5 MW of solar/wind.
Funds with heavy thermal exposure (coal-fired plants) are facing:
Funds tilted toward renewables are benefiting from:
Smart funds balance both:
| Source | Capacity (GW) | Share (%) | Growth |
|---|---|---|---|
| Solar Power | 127.33 | 25.5% | 13.5% |
| Wind Energy | 53.12 | 10.6% | 14.7% |
| Hydro Power | 46.00 | 9.2% | 5.7% |
| Coal (Thermal) | 210.00 | 42.0% | 1.8% |
| Grand Total | 500.00 | 100% | 7.1% |
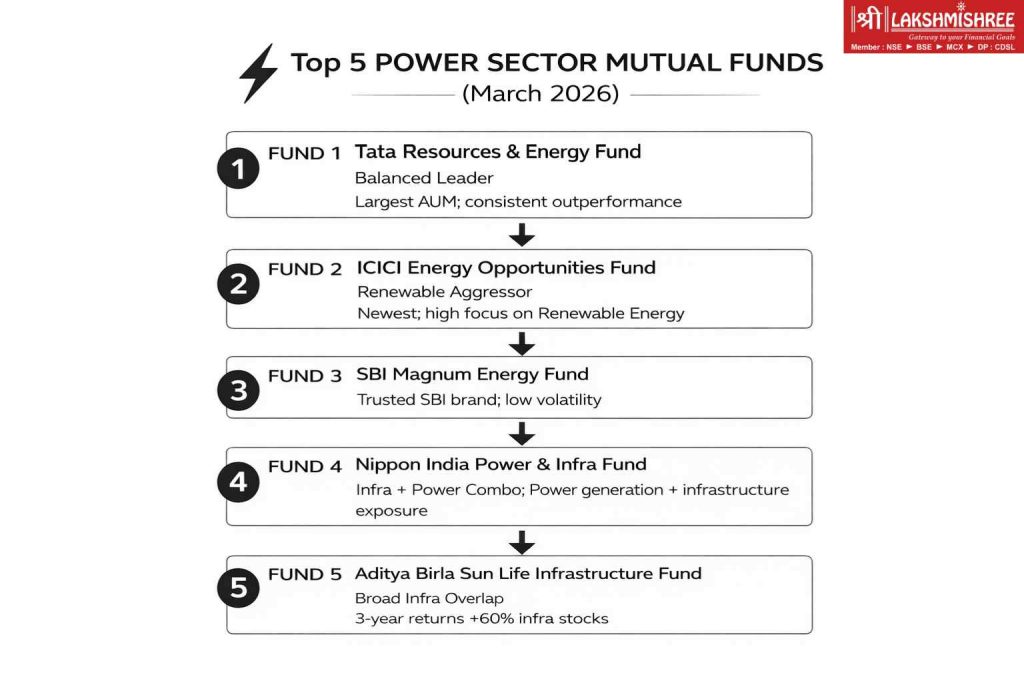
Ranked by AUM (Assets Under Management), filtered for “Sectoral Fund - Energy & Power” category, analyzed portfolios for renewable vs traditional mix.
Why it’s Rank 1: Largest AUM (₹2,328 Crores), balanced portfolio, consistent outperformance.
| Metric | Value | Benchmark/Category Avg |
|---|---|---|
| NAV (March 13, 2026) | ₹52.22 | — |
| 1-Year Return | 13.87% | 12.1% (category avg) |
| 3-Year Return | 66.88% (18.61% CAGR) | 58.2% |
| 5-Year Return | 21.01% CAGR | 18.3% |
| Since Inception (Jun 1995) | 420.69% (17.58% CAGR) | — |
| Expense Ratio | 0.57% | 0.65% (avg) |
| Risk Rating | Very High | — |
| Minimum SIP | ₹100 | — |
| Minimum Lumpsum | ₹5,000 | — |
Portfolio Breakdown (Feb 28, 2026):
Top 5 Holdings:
Sectoral Allocation:
Renewable vs Traditional Energy:
Fund Manager: Satish Chandra Mishra (managing since Nov 2018)
Investment Strategy: Diversified “Resources & Energy” approach. It is not just pure power. Invests across the energy value chain: power generation, mining (coal, metals), oil & gas, construction materials (cement for infra). This diversification reduces volatility but also dilutes pure power sector exposure.
Caution: Only 15.74% in pure power stocks. If you want concentrated power exposure, this isn’t it—it’s a broader resources fund.
Why it’s notable: Newest power sector mutual fund (launched July 2024), aggressive growth strategy, high inflows.
| Metric | Value | Notes |
|---|---|---|
| NAV (March 2026) | ₹12.80 (est.) | New fund, limited history |
| AUM | ₹703+ Crores | Added ₹703 Cr in 6 months (massive inflows) |
| Expense Ratio | ~0.65% | Competitive |
| Minimum SIP | ₹100 | — |
Portfolio Focus: Traditional + Emerging energy. Invests in:
Recent Activity (Last 6 Months):
Why the inflows: Launched at perfect timing (renewable energy boom + Union Budget 2026 focus on green corridors). Investors betting on India’s 500 GW renewable target.
Who should invest:
Risk: Fund is <2 years old. Performance unproven across market cycles.
Why it matters: Trusted SBI brand, focuses clean + traditional energy.
| Metric | Value |
|---|---|
| AUM | ~₹850 Crores (est.) |
| Portfolio Focus | Clean & traditional energy firms |
| Exit Load | Higher (suggests long-term holding strategy) |
| Recent Performance | Strong short-term gains (6-month: ~18%) |
Strategic Positioning:
Who should invest:
Why it’s different: Combines power + infrastructure (roads, ports, airports).
| Metric | Value |
|---|---|
| Power Allocation | ~60% |
| Infrastructure Allocation | ~40% (L&T, IRB Infra, GMR Infra) |
Strategic Advantage: Infrastructure projects (metro, highways, airports) are massive power consumers. This fund captures:
Union Budget 2026 Tailwind:
Who should invest:
Why it ranks high: Strong 3-year returns despite being broader infrastructure.
| Metric | Value |
|---|---|
| 3-Year Return | 23.41% |
| Power Exposure | ~35-40% |
| Infra Exposure | ~60-65% (construction, cement, engineering) |
Overlaps with power sector because:
Who should invest:
Here’s A dilemma every power sector fund manager faces:
Traditional thermal power plants (coal/gas):
Renewable energy (solar/wind):
Smart funds don’t choose: they blend for for wholesome stability:
Result: Lower volatility than pure renewable funds, higher returns than pure thermal funds.
How did power sector funds perform vs broader market?
| Fund | 1-Year Return | 3-Year Return (CAGR) | Nifty 50 (Benchmark) |
|---|---|---|---|
| Tata Resources & Energy | 13.87% | 18.61% | Nifty: 14.2% (1Y), 15.1% (3Y) |
| Aditya Birla Infra | ~20%* | 23.41% | same |
| Sundaram Infra Advantage | ~22%* | 24.36% | same |
| ICICI Energy Opportunities | New fund | — | same |
| SBI Magnum Energy | ~18%* | — | same |
*Estimated based on category average + recent inflows
1. Power Sector Mutual funds OUTPERFORMED Nifty in 3-year period:
Why?
2. High volatility (standard deviation: 15.17%)
3. Alpha Correction:
India's energy sector is rewiring the economy. Connect your capital to 31 years of market intelligence and accelerate your investment trajectory today.
Let’s decode Tata Resources & Energy Fund’s portfolio (representative example):
Holdings: Tata Steel, Hindalco, Coal India, Vedanta
Reason: Energy-intensive industries.
Investment thesis: As India electrifies (EV charging, rail electrification, data centers), power demand from these industries ↑ → Both power companies AND power-consuming industries benefit.
Holdings: Reliance Industries, ONGC, BPCL, IOC
Reason: Energy value chain exposure.
Trend: This allocation is DECLINING (funds rotating from oil → renewables). Expect this to drop to ~12-15% by 2027.
Holdings: NTPC, Tata Power, Adani Power, Power Grid Corporation, NHPC
NTPC breakdown:
Tata Power:
Power Grid Corporation:
Table: Fund Portfolio Comparison - Where’s the Money?
| Sector | Tata Resources | ICICI Energy* | SBI Energy* | Sector Avg |
|---|---|---|---|---|
| Pure Power | 15.74% | ~25% | ~30% | ~23% |
| Renewable Energy | ~8% | ~18% | ~22% | ~16% |
| Thermal Power | ~7% | ~7% | ~8% | ~7% |
| Oil & Gas | 18.42% | ~22% | ~15% | ~18% |
| Metals & Mining | 24.84% | ~12% | ~8% | ~15% |
| Infrastructure | 16.25% | ~10% | ~12% | ~13% |
| Others | 24.75% | ~18% | ~15% | ~19% |
*Estimated based on fund disclosures
Key Insight: Tata Fund is NOT a pure power sector Mutual Fund. It is a resource fund with power exposure. If you want concentrated power, choose ICICI or SBI funds.
The March 2026 oil spike is a direct result of the escalating conflict in West Asia. For a tactical breakdown of how this affects your portfolio, see our:
Iran War Impact on Indian Stock Market: Complete Guide 2026
Watch for:
Union Budget 2026 example:
Strategy: Buy 1 week before budget (pre-positioning) or 2 days after (on any dip from profit-booking), and both have risks of their own. Connect with your AMC before you deploy substantial capital.
Fund Performance: This structural shift has fueled steady gains in thematic funds. Energy-focused funds with high renewable exposure, such as ICICI Prudential and SBI Energy Opportunities, have delivered robust returns in the 14%–16% range over the 12-month period ending March 2026.
Goal Tracking: Proof of policy follow-through is evidenced by India achieving its 40% non-fossil installed capacity target in December 2021, nine years before the 2030 schedule. By August 2025, India crossed the 250 GW non-fossil capacity milestone, keeping the 2030 goal of 500 GW on a high-growth trajectory.
Why not short-term?
Volatility: Standard deviation of 15.17% means:
Example (Tata Resources Fund):
Holding <1 year = gambling on commodity prices. Holding 3-5 years = investing in sector growth.
If Tata Resources returns 8% while Nifty returns 15% in Year 1, then 9% vs Nifty’s 14% in Year 2 → Exit.
Reason: Sector has lost momentum. Reallocate to diversified equity (Flexi Cap, Large Cap).
Watch fund portfolios quarterly. If renewable energy allocation stays at 15-18% for 3-4 consecutive quarters (not increasing) → Red flag.
It means: Fund manager is not adapting to energy transition. Stuck in thermal mindset.
Action: Switch to a more aggressive renewable-focused fund (ICICI, SBI).
If India implements carbon tax on thermal power (₹500-1,000 per ton CO2):
Background: Invested ₹5 lakh in Tata Resources & Energy Fund (Direct Growth) in January 2023.
Strategy:
Results (March 2026):
What went right:
Mistakes made:
Lesson: “Sector funds are NOT buy-and-forget. I check quarterly. If renewable allocation drops below 20%, I’m exiting and moving to pure renewable fund.”
Classification: Equity mutual funds (80%+ equity holdings)
Holding Period: >1 year
Taxation:
Example:
Holding Period: <1 year
Taxation: 20% on entire gain (no exemption)
Example:
Lesson: ALWAYS hold >1 year. Selling at 11 months vs 13 months = ₹20K extra tax on ₹1.5L gain.
TDS: 10% (if dividend >₹5,000 in a year)
Actual Tax: Added to income, taxed at slab rate (10%, 20%, 30%)
Example:
Recommendation: Choose Growth option, not IDCW (dividend). Growth compounds tax-free till you sell.
<3 years: DON’T invest in power sector mutual funds. Volatility is too high.
3-5 years: Choose diversified resources fund (Tata Resources). Lower pure power exposure = lower volatility.
5-10 years: Choose pure power sector mutual fund (ICICI, SBI) with high renewable tilt. Ride the energy transition.
Why 20%?
How to check:
Red flag: If fund added ZERO renewable stocks in last 2 quarters → Fund manager not adapting.
Good: Steady AUM growth or stable (₹500-1,500 Crores range)
Bad: Declining AUM (investors exiting = red flag)
Example:
Why it matters: Every 1% expense = 1% less return.
Comparison:
Annual impact on ₹10 lakh:
Over 10 years at 15% CAGR:
Check:
Tata Resources example:
Red flag: Fund manager changed 3 times in 2 years = Institutional instability.
Option A: Invest in Power Sector Mutual Fund
Option B: Build Your Own Power Portfolio
| Stock | Allocation | Rationale |
|---|---|---|
| NTPC | 20% (₹2L) | Largest power utility, thermal + renewable mix, 7% dividend yield |
| Tata Power | 15% (₹1.5L) | Highest renewable % among large caps, EV charging play |
| Power Grid Corp | 15% (₹1.5L) | Transmission monopoly, defensive, regulated returns |
| Adani Green Energy | 12% (₹1.2L) | Pure renewable play, aggressive growth |
| Coal India | 10% (₹1L) | Supplies thermal plants, 8% dividend, government-owned |
| Reliance (O2C division) | 10% (₹1L) | Oil-to-chemical, energy value chain |
| NHPC | 8% (₹80K) | Hydro power, stable, government PSU |
| JSW Energy | 5% (₹50K) | Thermal + renewable, undervalued vs peers |
| Torrent Power | 5% (₹50K) | Private utility, Gujarat-focused, 5% dividend |
Total: 100% (₹10 Lakh)
Expected return: 14-18% CAGR (vs fund’s 15-20%, but you save 0.57-1.2% expense)
Effort required: Understanding of stock market basics +Quarterly portfolio review (2-3 hours), annual rebalancing
Verdict: DIY works IF you have time + knowledge. Otherwise, fund is better.
Key Announcements (February 2026):
1. Railway Capex: ₹2.93 Trillion
The electrification of Indian Railways is a massive power catalyst.
See our top picks for Railway Stocks in 2026 here.
2. Green Corridor & Rooftop Funding: ₹22,600 Crores
3. Solar Components Custom Duty Exemptions: ₹24,000 Crore (Total PLI Pool)
Check out our detailed analysis of the top EV battery stocks driving India's storage revolution.
Myth: “Coal is dead, sell all thermal stocks.”
Reality: Coal will decline, but slowly (10-15 year transition, not 2-3 years).
Why coal persists:
Projection (2030):
Investment implication: Don’t dump thermal stocks. Hold NTPC, Coal India for dividends (7-9%) while they transition.
Problem with renewables: Sun doesn’t shine at night, wind doesn’t blow 24/7.
Solution: Battery storage (charge during day, discharge at night).
Breakthrough: Lithium-ion battery costs dropped 70% (2020: $300/kWh → 2026: $90/kWh).
Tipping point: When battery + solar = cheaper than new coal 24/7 (achieved: 2025; parity with existing coal expected: 2027-28).
Catalyst to watch: Largest 1 GWh+ standalone battery storage project commissioning (expected: Q2-Q3 2026).
What: Use renewable electricity to split water → Hydrogen gas → Fuel for industries/transport.
India’s target: 5 million tons green hydrogen production by 2030.
Use cases:
Power sector impact: Massive. Producing 5 million tons H2 needs ~150-200 TWh electricity = 25-30 GW dedicated renewable capacity.
Investment case: Renewable-heavy funds (ICICI, SBI) benefit. Hydrogen is power sector’s next frontier after solar/wind.
Timeline: Pilot projects (2026-27) → Commercial scale (2028-30).
India's energy sector is rewiring the economy. Connect your capital to 31 years of market intelligence and accelerate your investment trajectory today.
India’s transition to a renewable-led future is a ₹15 lakh crore reality. Power sector mutual funds provide a strategic gateway to this transformation, balancing steady legacy dividends with the high-growth potential of solar and green hydrogen.
While the opportunity is vast, success requires a disciplined approach to volatility and policy shifts. Choosing the right energy sector mutual funds can significantly energize your portfolio, provided your strategy remains tax-efficient and aligned with 2030 targets. Now is the time to finalize your allocation to best power sector mutual funds and plug into India’s energy evolution.
A: No. Sector funds are HIGH RISK.
Retirement portfolios should be:
60-70% diversified equity (Flexi Cap, Large Cap)
20-30% debt (bonds, FDs, debt funds)
5-10% gold
Maximum 5% in sector funds (including power)
Reason: The power sector has 15.17% volatility. Retirement portfolios need stability (8-10% volatility).
Use case: If you’re 30-40 years old, 10% power sector allocation is okay. If you’re 55-60 (near retirement), skip it.
A: It depends on the crisis.
Iran war example (March 2026):
Oil spiked $72 → $119 → $100
Power sector funds with oil exposure (20%+) swung wildly: -12% (Day 1) → +8% (Day 5) → -6% (Day 10)
Strategy:
Don’t invest during the crisis (too volatile, impossible to time)
Wait for resolution (ceasefire, Strait of Hormuz reopens)
Then invest when oil stabilizes ($75-85 range = entry point)
Funds with HIGH oil exposure (>20%): Avoid during oil volatility.
Funds with LOW oil exposure (<10%): Can invest, less impacted.
A: SIP is better for the power sector Mutual funds
Why:
High volatility (15% standard deviation) = perfect for rupee-cost averaging
SIP buys more units when NAV drops, fewer when NAV spikes
Smooths out commodity price swings
Example (₹15,000 SIP for 12 months in Tata Resources):
Month
NAV
Units Bought
Cumulative Investment
Jan
₹48
312.5
₹15,000
Feb
₹45 (↓ correction)
333.3
₹30,000
Mar
₹50 (↑ rally)
300.0
₹45,000
…
…
…
…
Dec
₹52
288.5
₹1,80,000
Average cost: ₹48.2 (vs buying lumpsum at ₹52 in Dec)
Verdict: SIP reduces timing risk. Start SIP, hold 5 years.
A: Some do (IDCW option), but Growth option is better for most investors.
Why Growth > Dividend:
Dividends taxed at slab rate (30% for high earners)
Growth compounds tax-free till you sell
LTCG tax (12.5%) < Income tax (30%)
Exception: Retirees needing regular cash flow → Choose IDCW. But even then, SWP (Systematic Withdrawal Plan) from Growth option is more tax-efficient.
Conservative investor: 0-5%
Moderate investor: 5-10%
Aggressive investor: 10-15%
Never exceed: 20%
Rule: Sector funds should be satellite holdings, not core.
Core holdings (70-80% of portfolio):
Diversified equity (Flexi Cap, Large Cap, Index)
Debt funds
Gold
Satellite holdings (20-30%):
Sector funds (power, IT, pharma)
International equity
Alternatives (REITs, AIFs)
Power sector mutual funds are subject to market risks and high volatility. Past performance (13-24% returns shown) does not guarantee future results. NAV data is as of March 13-14, 2026 and subject to daily changes.
All fund names, returns, and portfolio allocations are based on publicly available data from fund factsheets and third-party platforms. Lakshmishree Investment and Securities is not affiliated with any mutual fund house mentioned.
This is educational content for investor awareness, not personalized investment advice. Sector funds carry concentration risk, limit exposure to 10-15% of portfolio. Consult a SEBI-registered investment advisor before investing.
Mutual fund investments are subject to market risks. Read all scheme-related documents carefully before investing.

