Trading in the stock market can feel overwhelming, especially when you’re unsure how to spot the right trends or signals. If you're tired of missing out on profitable trades, it's time to consider using a reliable tool like the MACD Indicator. One of the most popular and effective technical analysis tools, the MACD, helps traders understand market momentum and potential reversals.
Whether you're a beginner or an experienced trader, learning how to master the MACD Indicator could be the game-changer you need to make smarter, more confident trading decisions. Ready to dive deeper into how this indicator works? Let's explore!
The MACD Indicator (Moving Average Convergence Divergence) is a widely-used momentum indicator in technical analysis, developed by Gerald Appel in the late 1970s. It helps traders understand price trends and potential reversals by comparing two distinct moving averages of a stock’s price. The MACD works by calculating the difference between a shorter-term and a longer-term exponential moving average (EMA), providing insight into the direction and strength of the price momentum.
Traders use the MACD to detect momentum and trend direction changes—whether bullish or bearish—and gauge the potential for price movements. Its simplicity and ability to highlight significant market shifts make the MACD a powerful tool for beginners and seasoned traders.
The full form of MACD is Moving Average Convergence Divergence. It’s designed to track momentum by measuring the convergence (coming together) or divergence (moving apart) of two EMAs, typically the 12-day and 26-day periods. These moving averages represent different time periods to capture short-term and long-term market trends. The key concept behind the MACD is that when the shorter-term EMA crosses above or below the longer-term EMA, it indicates a potential buy or sell signal.
In simpler terms:
Traders also look at the Signal Line, a 9-day EMA of the MACD line, and use crossovers between the MACD line and the Signal line to decide whether to buy or sell.
To use the MACD Indicator effectively, it's crucial to understand how to interpret the different components on a chart. The MACD indicator consists of three main elements that help traders analyse price momentum and market trends.
The MACD line is calculated by subtracting the 26-day EMA from the 12-day EMA. This line reflects the difference between these two EMAs, giving traders an idea of the current momentum in the market. When the MACD line crosses above the signal line, it usually signals a bullish trend, while crossing below may indicate bearish momentum.
The Signal line is a 9-day EMA of the MACD line itself, and it acts as a trigger for buy or sell signals. When the MACD line crosses above the signal line, it’s typically a buy signal, and when it crosses below, it’s often a sell signal. This is a critical line for traders to watch because it helps confirm momentum changes.
The MACD Histogram represents the difference between the MACD and Signal lines. It swings above and below a zero line, showing traders whether the market is gaining or losing momentum. A positive histogram indicates bullish momentum, while a negative one signals bearish activity.
The MACD Indicator uses a straightforward mathematical formula to compute momentum and trend signals. Here's how it works:
The MACD Indicator is highly versatile, but its effectiveness depends largely on the settings you choose. Most traders stick with the default settings (12, 26, 9), but tweaking these numbers based on your strategy—whether it’s day trading, swing trading, or long-term investing—can lead to better results. Let’s break down the best MACD settings for different trading strategies.
For most traders, the default settings of 12 (short-term EMA), 26 (long-term EMA), and 9 (Signal Line) work well across various timeframes. These settings are ideal for identifying general trends in the market.
Best for: Swing and position traders looking for medium- to long-term price movements.
For intraday traders who need quicker signals, using shorter EMA periods can help. A common setting for day traders is 5, 13, and 6.
Swing traders who prefer holding positions for several days or weeks can benefit from slightly slower settings, such as 8, 21, and 5.
Long-term investors may prefer to use even slower settings, such as 21, 50, and 9, to capture the bigger picture in the market.
Practical Tip: Adjusting MACD settings should always be done with caution. Testing on historical data (backtesting) can help you understand how different settings perform under various market conditions before applying them to real trades.
Crossovers are one of the most widely used signals generated by the MACD Indicator, and they can be crucial for timing trades. Here's how to interpret them:
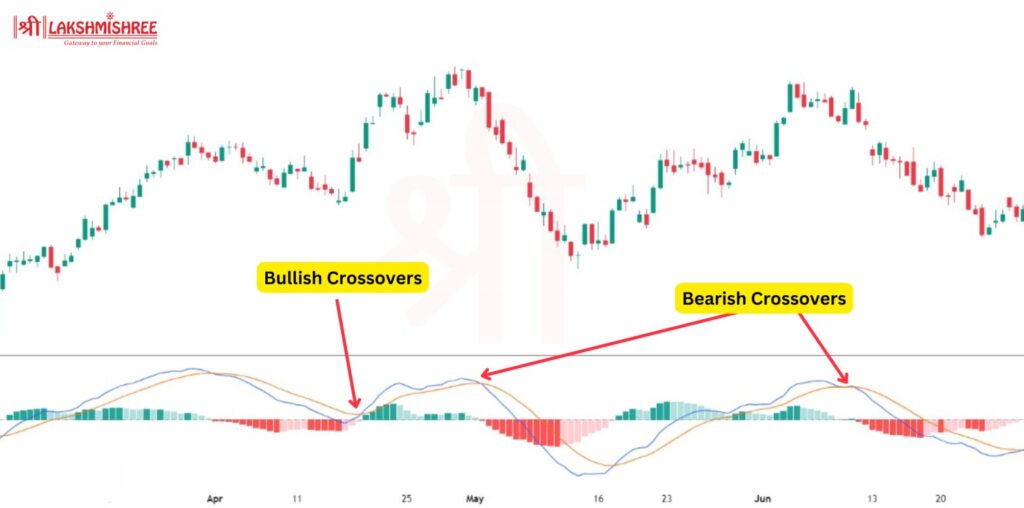
A bullish crossover occurs when the MACD line crosses above the Signal line. This indicates that the asset’s price may start to gain upward momentum, making it a potential buy signal. These signals are even more reliable when they occur after a brief downside correction within an overall uptrend. In such a case, the bullish crossover confirms the trend is likely to continue.
A bearish crossover happens when the MACD line crosses below the Signal line. This indicates that the price could experience downward pressure, making it a sell signal. Similar to the bullish crossover, a bearish signal is more reliable when it aligns with the overall trend. For instance, if the crossover occurs after a brief upside correction in a longer-term downtrend, it may confirm that the downtrend is likely to continue.
Crossover Tips
The MACD Histogram visually represents the difference between the MACD and Signal lines. It helps traders understand whether the momentum is increasing or decreasing, which can help confirm trend direction and potential reversals.
Key Tips for Using the MACD Histogram:
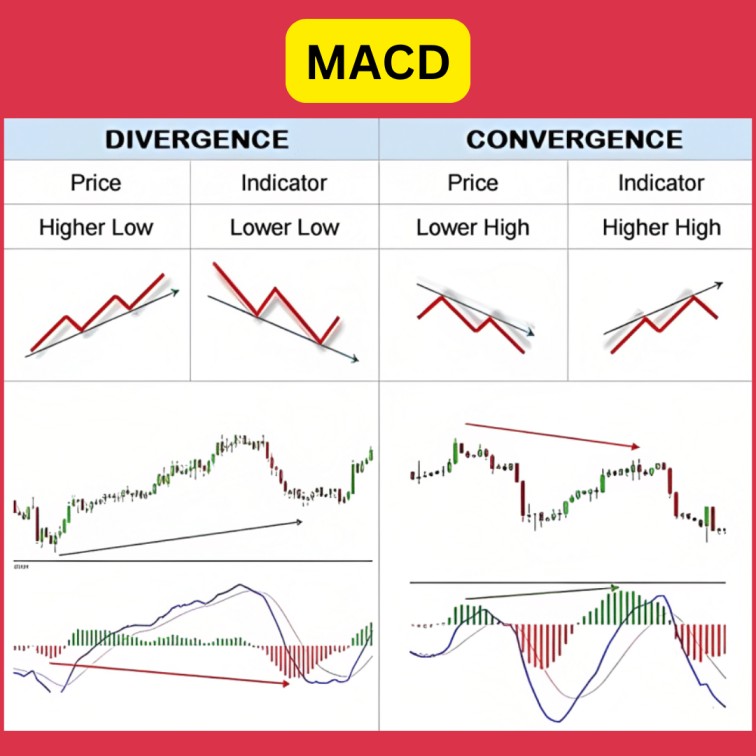
MACD Divergence occurs when the movement of the MACD indicator starts to diverge or move in the opposite direction from the price action of an asset. This divergence is a key signal that can indicate a potential trend reversal.
There are two types of divergences traders look for:
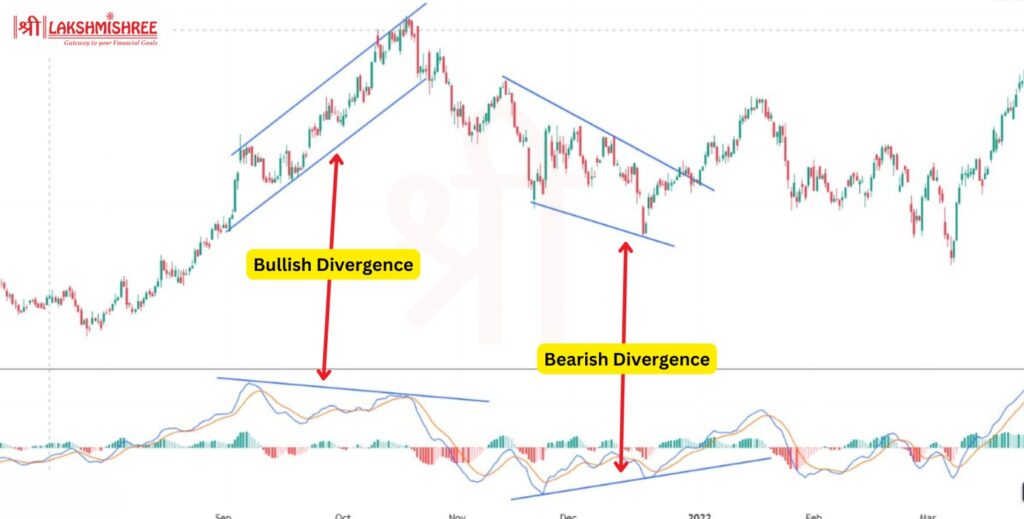
A bullish divergence forms when the price of an asset makes lower lows, but the MACD forms higher lows. This suggests that even though the price is falling, the selling momentum is weakening. Traders often consider this a signal that a reversal to the upside could be near.
A bearish divergence forms when the price of an asset makes higher highs, but the MACD makes lower highs. This indicates that even though the price is rising, the buying momentum is weakening. Traders see this as a warning that a downward reversal could be coming.
Practical Steps for Using Divergence:
MACD Indicator is versatile and can be applied to both day trading and swing trading, but the strategies differ based on the time frame:
Key Difference:
Traders use the MACD Indicator to identify trends, gauge momentum, and generate buy or sell signals. Here's how:
The MACD Indicator can be even more powerful when combined with other technical indicators. By using a multi-indicator approach, traders can confirm signals, minimize false alarms, and make more accurate predictions.
The RSI measures overbought or oversold conditions. When combined with MACD, the RSI can help confirm the strength of a trend. For example, if MACD signals a buy but the RSI is in an overbought condition, traders may reconsider their entry to avoid potential reversals. Conversely, if both MACD and RSI give buy signals, the trade has a higher probability of success.
Traders often use MACD with longer-term moving averages like the 50-day or 200-day moving average. If the price is above these averages and MACD signals a buy, it reinforces the bullish trend. On the flip side, if the price is below the moving averages and MACD signals a sell, it indicates a strong bearish trend.
Bollinger Bands help traders assess volatility and potential breakout points. When combined with MACD, traders can look for situations where the price touches the outer bands, while MACD crossovers confirm the momentum behind these moves. This strategy is commonly used to identify breakout trades or trend continuations.
In simple terms, the MACD Indicator (Moving Average Convergence Divergence) is a powerful tool for spotting trends and momentum changes in the market. Whether a beginner or an expert, using MACD can help you identify the best times to buy or sell stocks. While MACD is effective, it's best used alongside other indicators like the RSI or moving averages for even stronger signals. The MACD can significantly improve trading decisions with the right settings and proper strategy.
The full form of MACD is Moving Average Convergence Divergence. It's a momentum indicator used in technical analysis to identify changes in a trend's strength, direction, momentum, and duration.
A MACD crossover occurs when the MACD line crosses above or below the signal line. When the MACD line crosses above the signal line, it’s a bullish crossover, suggesting upward momentum (buy signal). When the MACD line crosses below the signal line, it’s a bearish crossover, indicating downward momentum (sell signal).
MACD divergence occurs when the MACD indicator and the asset’s price move in opposite directions. A bullish divergence happens when the price makes lower lows while MACD makes higher lows, signalling a potential upward reversal. Conversely, a bearish divergence occurs when the price makes higher highs while MACD makes lower highs, suggesting a potential downward reversal.
The standard and most widely used settings for the MACD Indicator are 12, 26, and 9. These represent the 12-day EMA (fast line), the 26-day EMA (slow line), and the 9-day EMA (signal line). However, some traders adjust these to shorter periods (like 8, 17, and 9) for day trading to capture faster market movements.
MACD and RSI serve different purposes. MACD is great for identifying trend momentum and potential reversals, while RSI helps determine overbought and oversold conditions. Many traders use both indicators together for better accuracy.
Disclaimer: This article is for educational purposes only and should not be considered financial advice. Always conduct your research and consider consulting with a financial advisor before making any investment decisions.
