Posted on February 20, 2026 under Trading by Kaushal Kashyap
Best Time Frame for Swing Trading in India 2026 — 15-Min, 1H, 4H or Daily Chart?
Choosing the right time frame in swing trading can make all the difference between a profitable trade and a missed opportunity. The right time frame helps you align with market trends, filter out unnecessary noise, and make well-timed entries and exits. But with so many options—4-hour, daily, or weekly charts—how do you know which one works best?
In this guide, we’ll explore the best time frame for swing trading, its advantages and drawbacks, and how to choose the one that suits your trading style.
Table of Content
What is Swing Trading?
Swing trading is a trading strategy that focuses on capturing short- to medium-term price movements. The best time frame for swing trading depends on your trading style, as positions can be held for a few days to several weeks. Unlike day trading, where trades are closed before the market shuts, swing trading allows traders to ride market trends for longer, aiming to maximize profits from price swings.
This strategy involves using swing trading patterns and technical indicators to identify the best entry and exit points. Common patterns like head and shoulders, double tops and bottoms, and the cup and handle help traders predict potential trend reversals or continuations. Understanding these signals and choosing the right time frame for swing trading can improve trade accuracy and profitability.
What Are Timeframes in Trading?
Timeframes in trading refer to the time period that a trader uses to study and, subsequently, trade. It is a time period within which the price fluctuation is observed, followed by decisions being called for. The significance of timeframes lies in how they impact a trader's approach to the market. The shorter the time frame, the more frequent the trading opportunities will be, but so will the noise and volatility. Longer time frames will smooth out short-term fluctuations, enabling traders to focus on broader trends.
5-Minute Timeframe: Ideal for scalpers and very short-term traders looking to capitalize on quick, small price movements. It requires constant monitoring and is highly sensitive to market noise.
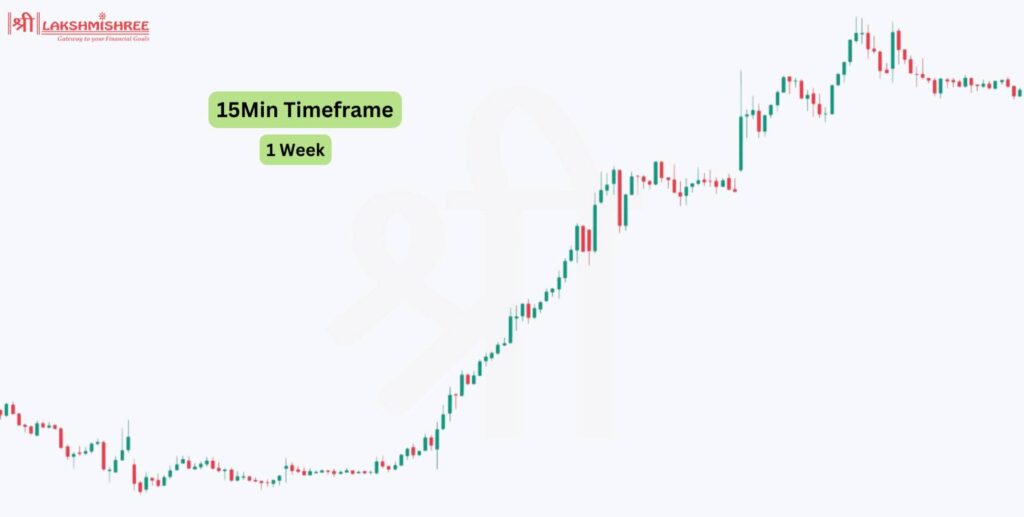
15-Minute Timeframe: Used by day traders for slightly longer trades. It balances quick trading opportunities more clearly than the 5-minute timeframe. Suitable for those who want to trade actively but with a bit more data to inform decisions.
4-Hour Timeframe: Popular among swing traders looking to catch medium-term price movements. This timeframe reduces noise seen in shorter intervals and provides a clearer view of trends without requiring constant monitoring.
Daily Timeframe: Spans an entire trading day, smoothing out most of the intraday noise. It's popular among swing traders who want to capture short- to medium-term trends without the need for constant monitoring.
Weekly Timeframe: Covers price movements over a week, allowing traders to focus on more significant, longer-term market trends. It reduces the frequency of trading decisions and is suitable for traders looking for more stability and less noise.
Each timeframe serves different purposes and is chosen based on a trader's style, strategy, risk tolerance, and market outlook.
Why Does the Time Frame Matter in Swing Trading?
The timeframe you choose in swing trading affects how you identify trends, manage risk, and execute trades. Shorter time frames, like the 4-hour chart, provide frequent signals and faster trades but come with higher volatility and require active monitoring. In contrast, longer time frames, such as the weekly chart, offer a clearer view of market trends with less noise but require more patience.
Here’s how different time frames impact trade duration:
4-Hour Time Frame – Trades typically last 1 to 2 weeks, allowing for more opportunities but requiring constant attention.
Daily Time Frame – Trades usually last 2 to 4 months, offering a balance between stability and frequency.
Weekly Time Frame – Positions can extend from 3 months to a year, focusing on long-term trends with fewer but more significant trades.
Best Time Frames for Swing Trading
Selecting the right swing trading time frame is crucial for analyzing trends, managing risk, and timing your trades effectively. The best time frames for swing trading in 2026 include the daily, weekly, and 4-hour charts, each offering unique advantages.
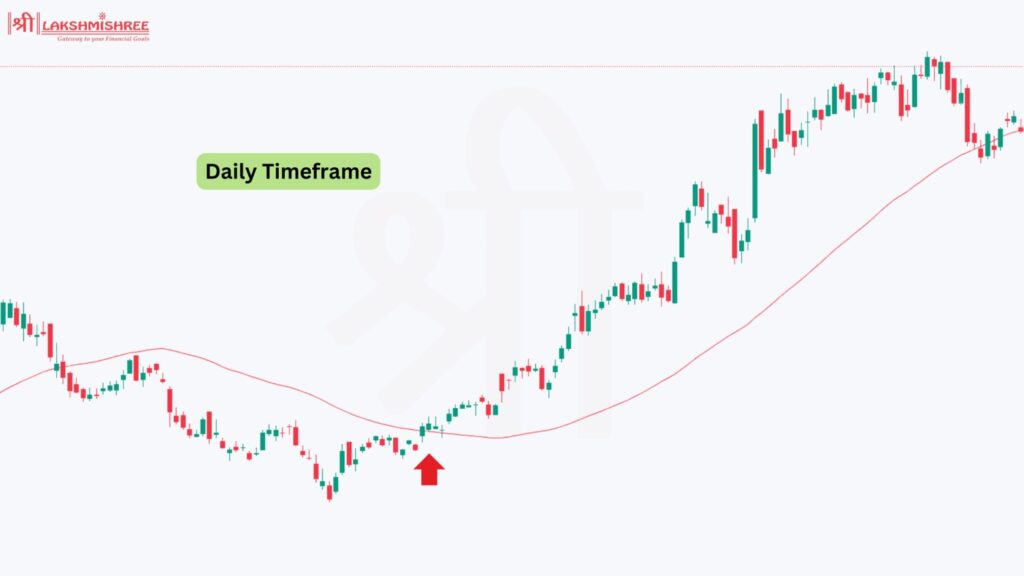
1. Daily Time Frame
(Crossing 50-days MA)
Pros:
Reliable Signals: Swing traders often favour The daily time frame because it provides reliable signals. Since each candlestick represents a full day of trading, you get a comprehensive view of the market's behaviour over time. This makes it easier to spot trends and identify strong entry and exit points.
Easier Trend Analysis: Trends are much more apparent in the daily time frame; therefore, it becomes easier to filter short-term noises from those that are of real market movements. This could be especially helpful in markets that are very volatile, where price action can become quite misleading over the short term.
Cons:
Slower Trade Frequency: While the daily time frame offers clear trends, it also means fewer trading opportunities. Since you're waiting for daily candles to close, trades are less frequent compared to shorter time frames. This can be a downside if you're looking for more action or quicker results.
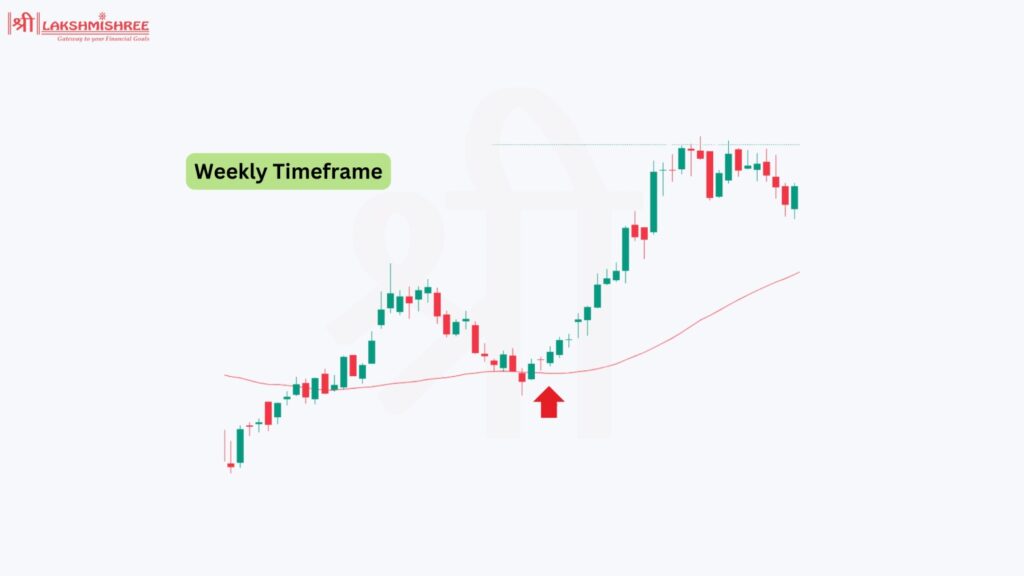
2. Weekly Time Frame
(Crossing 50-days MA)
Pros:
Clearer Long-Term Trends: The weekly time frame is ideal for traders who want to focus on long-term trends. Each candlestick encompasses a whole week and smoothens out a lot of the short-term noises that can obscure the bigger picture.
Less Noise, More Clarity: The weekly time frame reduces the impact of daily market volatility, offering a clearer view of the market's overall direction. It can also result in more assured trading decisions and less second-guessing.
Cons:
Longer Holding Periods: Since you would be trading on a weekly time frame, this means one has to hold their positions for a period longer than just a few days, at times running into several weeks or even months. This will increase the chances of drawdowns, particularly if the market is going against your position during the hold period.
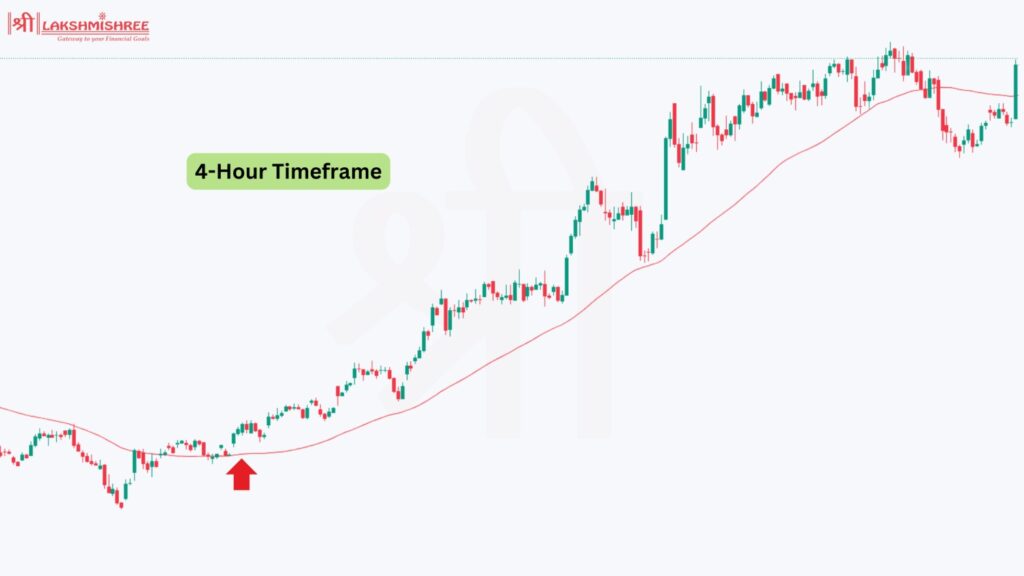
3. 4-Hour Time Frame
(Crossing 50-days MA)
Pros:
More Frequent Trading Opportunities: This time frame of 4 hours falls somewhere in between the intraday and daily charts, offering more frequent trading opportunities than the daily or weekly charts. That makes it favourable to those who want their actions animated frequently. You can take multiple swings within a week, depending on market conditions.
Quicker Signals: Using the 4-hour time frame provides trading signals faster than using the daily or weekly charts. In this way, you can make quicker decisions with a potential for faster profits since you can enter and exit trades based on shorter-term market movements.
Cons:
Higher Chance of False Breakouts: The 4-hour time frame can often show false breakouts because there is more market noise and smaller price changes. This means that the price might look like it’s breaking out of a trend or pattern but then quickly reverse direction. Traders using the 4-hour chart need to be careful with these false breakouts, as they can cause you to enter or exit trades too early, which could lead to losses if you’re not careful.
Which Timeframe is Best for Swing Trading: Right Time Frame for You
The best timeframe for swing trading depends on your strategy, but generally, traders use the daily, weekly, and 4-hour charts. The daily time frame is the most balanced, offering reliable signals and clear trend analysis while minimizing short-term noise. The weekly time frame is ideal for those focusing on long-term trends, as it smooths out market fluctuations but requires patience. The 4-hour time frame provides more frequent trading opportunities but demands active monitoring and carries a higher risk of false signals.
For most traders in 2026, the daily time frame is the best choice, offering a mix of accuracy, flexibility, and sustainability. If you have limited time for trading, avoid charts below the 1-hour time frame, as they require constant attention and are better suited for day trading.
The Advantages of Using Multiple Time Frames
Better Market Perspective – Using multiple time frames helps you see the bigger trend while considering short-term price movements.
Stronger Trade Signals – When a signal aligns across multiple time frames, it becomes more reliable and reduces false signals.
Improved Entry & Exit Points – The weekly chart identifies the overall trend, the daily chart confirms it, and the 4-hour chart pinpoints the best entry and exit points.
Reduces Market Noise – A higher time frame smooths out price fluctuations, helping you avoid getting caught in sudden price swings.
More Accurate Trading Decisions – Combining multiple time frames increases accuracy and helps filter out weak trade setups.
Common Mistakes to Avoid When Choosing a Swing Trading Time Frame
Selecting the best time frame for swing trading can significantly impact your success, but there are common pitfalls that traders should be aware of.
Overtrading on Shorter Time Frames: Frequent signals on shorter time frames like the 4-hour chart can lead to impulsive decisions and increased transaction costs.
Ignoring the Broader Market Context: Focusing solely on one time frame, especially a short one, can cause you to miss the overall trend and bigger picture.
Failing to Adapt to Market Conditions: Sticking to a fixed time frame without adjusting to market volatility can expose you to unnecessary risks and reduce your strategy's effectiveness.
Conclusion
The best time frame for swing trading depends on your strategy and availability. The daily chart is the most preferred choice, offering a balance between trend clarity and manageable trade frequency. The 4-hour time frame works for those who want more opportunities but requires active monitoring, while the weekly chart suits traders focusing on long-term trends with fewer trades. For the best results, using multiple time frames—such as combining the daily and 4-hour charts—can improve accuracy and trade timing.
Frequently Asked Questions
What is the most recommended time frame for beginner swing traders?
The daily time frame is usually recommended for beginners because it does a good balance between capturing market trends and minimizing noise to make reliable trading opportunities easier to identify.
Is swing trading profitable?
Yes, swing trading can be profitable if executed with a well-thought-out strategy, proper risk management, and the right time frame. The daily time frame is particularly effective for maximising profitability while managing risk.
Which time frame is Best for swing trading?
The 1-day (daily) time frame is considered the best for swing trading. It balances capturing significant price swings while filtering out the noise, making it easier to spot reliable trading signals and manage trades effectively
Can using multiple time frames improve trading results?
Absolutely. Analysing multiple time frames helps confirm trends and trading signals, providing a more comprehensive view of the market and improving the accuracy of your trades.
How do I adjust my time frame during periods of high market volatility?
During high volatility, consider using shorter time frames to react quickly to price swings, but always cross-check with longer time frames to ensure you’re aligned with the broader trend.
How often should I review and adjust my time frame strategy?
It’s a good idea to regularly review your strategy, especially after major market events or changes in volatility, to ensure that your chosen time frame continues to align with market conditions and your trading goals.
How to select stocks for swing trading?
Selecting stocks for swing trading involves looking for those with clear, predictable price patterns, good liquidity, and volatility. Stocks that are influenced by strong trends or news events often provide the best opportunities for swing trading.
What are the best swing trading indicators?
Some of the best swing trading indicators include Moving Averages, Relative Strength Index (RSI), and MACD. These indicators help identify trends, overbought or oversold conditions, and potential entry or exit points.
Disclaimer: This article is for educational purposes only and should not be considered financial advice. Always conduct your research and consider consulting with a financial advisor before making any investment decisions.
Ayush is a seasoned financial markets expert with over 3years of experience. He has a passion for breaking down complex financial concepts into simple, digestible terms. Through his 50+ articles, Ayush has helped countless individuals navigate the often intimidating world of finance.