Intraday trading in India has become highly popular among retail traders looking for quick profits within a single trading session. To succeed in this fast-moving market, it’s important to use the best indicator for intraday trading that suits your strategy and market conditions. Technical indicators like RSI, Bollinger Bands, MACD, and EMA help traders identify trend direction, price momentum, and volatility—key factors for making accurate buy and sell decisions.
In this guide, we’ll explore the top indicators used by Indian intraday traders in 2026, how they work, and how to combine them for better results.
Intraday trading indicators are essential tools traders use to analyse and predict market behaviour within a single trading day. These indicators help traders identify price trends, market momentum, and potential reversal points. By interpreting these signals, traders can make informed decisions about when to enter or exit a trade, thereby maximising their profits and minimising their risks.
Common intraday trading indicators include Bollinger Bands, which measure market volatility; the Relative Strength Index (RSI), which indicates overbought or oversold conditions; and the Exponential Moving Average (EMA), which smooths out price data to identify trends more clearly. Each best indicator for intraday offers unique insights, and when used together, they provide a comprehensive view of the market’s movements, helping traders navigate the fast-paced world of intraday trading.
Intraday indicators are vital because they offer immediate insights into the stock market's short-term movements. Unlike long-term trading, intraday trading requires quick decision-making, and these indicators help traders identify potential entry and exit points within a single trading day.
Also Read: Best Intraday Trading Tips & Strategies | Expert Advice 2026
Here are the indicators for day trading in India that every day trader should know. Each indicator below includes a quick use-case to match search intent and improve usability.
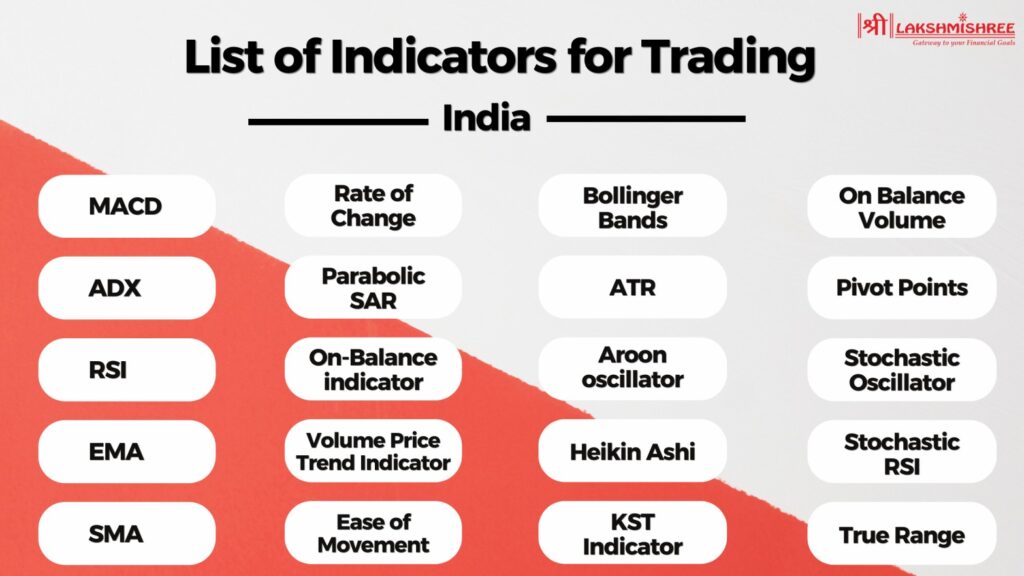
Understanding the best technical intraday trading indicators is essential for maximising success in fast-paced trading environments. Below, we delve into intraday traders' most effective indicators, offering practical applications and examples.
| Indicator | Use Case |
|---|---|
| 1. Bollinger Bands | Volatility + entry/exit signals |
| 2. RSI | Overbought/oversold zones |
| 3. EMA | Trend detection in price movement |
| 4. MACD | Trend + momentum confirmation |
| 5. Parabolic SAR | Spotting trend reversals |
| 6. Pivot Points | Intraday support/resistance levels |
Bollinger Bands are a widely-used technical analysis tool created by John Bollinger. They consist of three lines: the middle band, which is a 20-day simple moving average (SMA); an upper band, set at +2 standard deviations from the SMA; and a lower band, set at -2 standard deviations from the SMA. These bands reflect the price volatility of a stock. When market volatility is high, the bands widen, and when volatility is low, the bands contract.
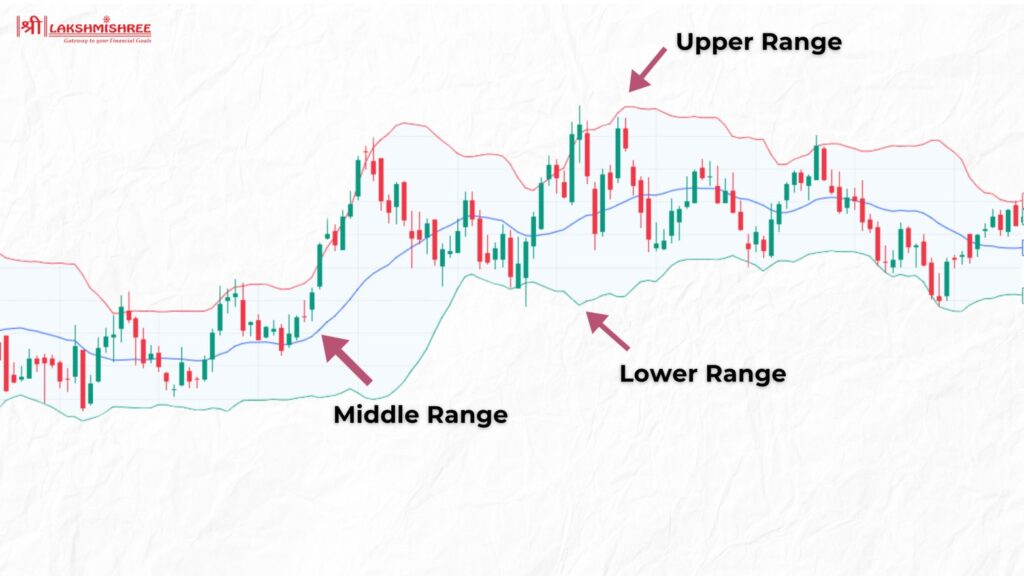
Intraday traders use Bollinger Bands to gauge a stock's price range and volatility. When the stock price touches the upper band, it suggests that the stock may be overbought, signalling a potential sell opportunity. Conversely, when the stock price touches the lower band, it indicates that the stock may be oversold, signalling a potential buy opportunity. The continuous fluctuation of stock prices between the upper and lower bands helps traders to identify potential entry and exit points.
The Relative Strength Index (RSI) is one of the best technical indicator; it is a momentum oscillator that measures the speed and change of price movements. Developed by J. Welles Wilder, it ranges from 0 to 100 and helps traders identify overbought and oversold conditions in the market. An RSI value above 70 typically indicates that a stock is overbought, suggesting a potential sell signal, while an RSI value below 30 indicates that a stock is oversold, suggesting a potential buy signal.
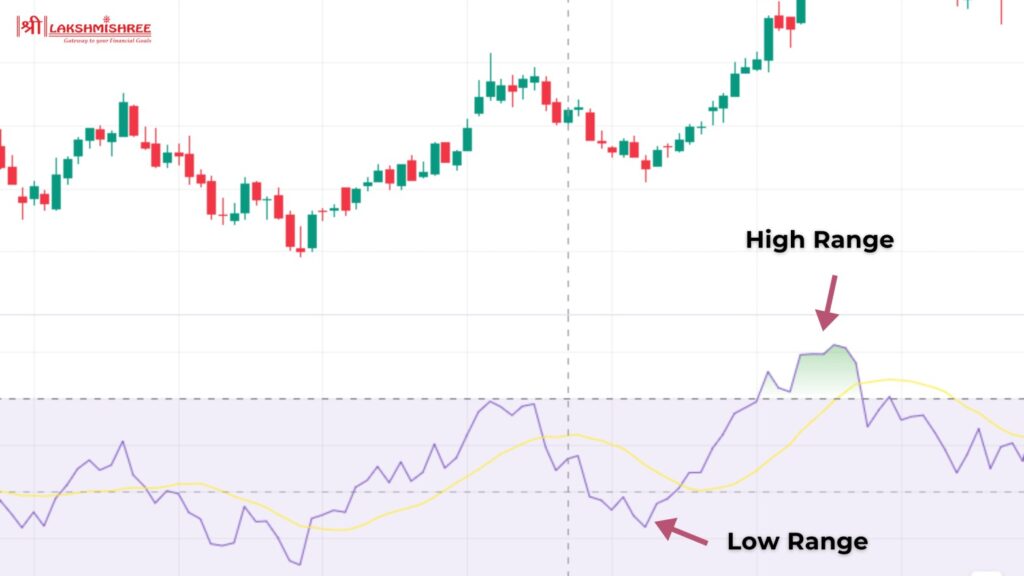
RSI is calculated using the average of upward and downward price changes over a specified period, usually 14 days. This calculation helps traders understand the strength of recent price movements. For intraday traders, RSI can be particularly useful in identifying potential reversals and entry or exit points.
The Exponential Moving Average (EMA) is another highly effective tool and one of the best trading indicators. Unlike the Simple Moving Average (SMA), which treats all data points equally, the EMA assigns more weight to recent prices, allowing it to respond more quickly to market changes.
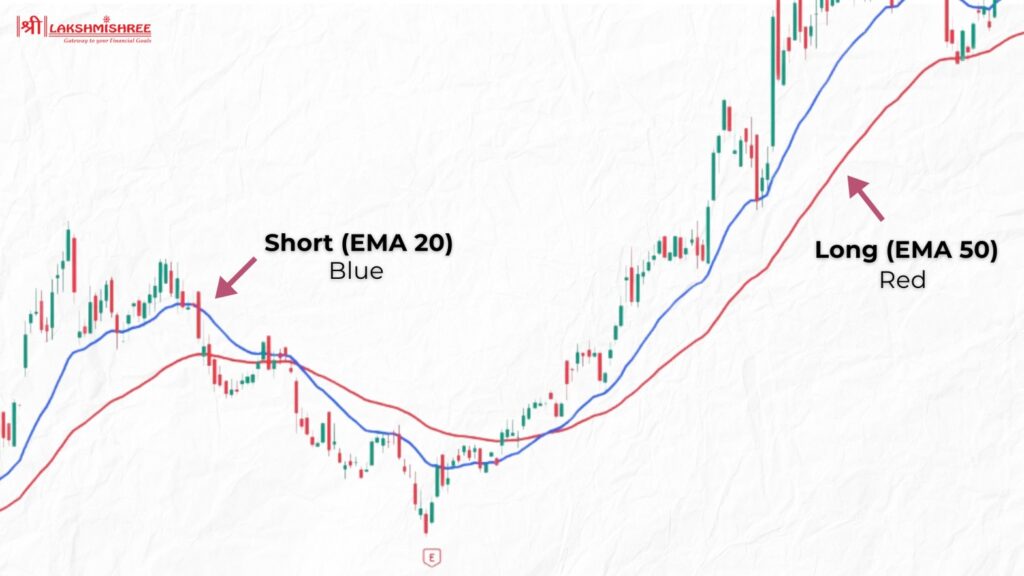
EMAs are particularly helpful for identifying trends and spotting potential reversals. For instance, when a short-term EMA crosses above a longer-term EMA, it signals a bullish trend, indicating a buying opportunity. On the other hand, when a short-term EMA crosses below a longer-term EMA, it often points to a bearish trend, signalling a potential sale.
By incorporating the EMA into their strategies, intraday traders can gain better insights into market trends and efficiently improve their decision-making for entering and exiting trades.
Read More: 7 Best Indicators for Options Trading in 2026
MACD (Moving Average Convergence Divergence) is a widely used momentum indicator in intraday trading. It tracks the difference between the 12-day and 26-day Exponential Moving Averages (EMA) of a stock's price. This difference forms the MACD line. A separate 9-day EMA, known as the signal line, is then plotted on top to generate buy and sell signals.
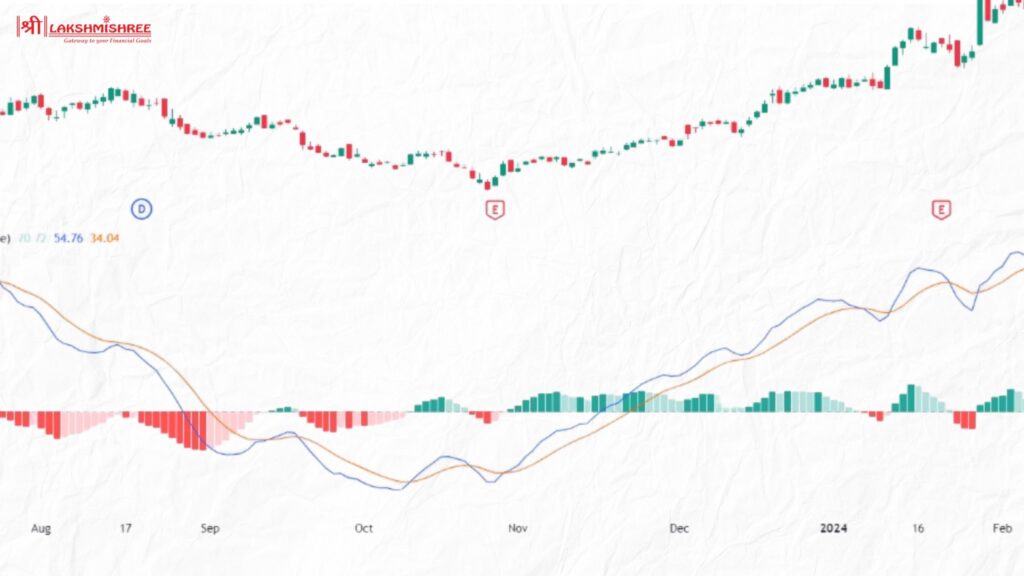
For intraday traders in India, MACD helps spot trend direction and momentum changes.
MACD works best in trending markets like Nifty or large-cap stocks, helping traders time entries and exits based on momentum strength.
The Parabolic SAR (Stop and Reverse) is one of the best indicators for intraday used to identify the direction of an asset's momentum and potential reversal points. It appears as a series of dots above or below the price chart: dots below indicate an uptrend, while dots above indicate a downtrend. As the trend continues, the dots move closer to the price, signalling a potential reversal when they cross over.
Intraday traders use the Parabolic SAR to set trailing stop-loss orders. This method allows them to lock in profits as the price moves favourably, with the stop-loss level adjusting dynamically. The Parabolic SAR is especially useful in trending markets, helping traders stay in profitable trades longer and exit at optimal points.
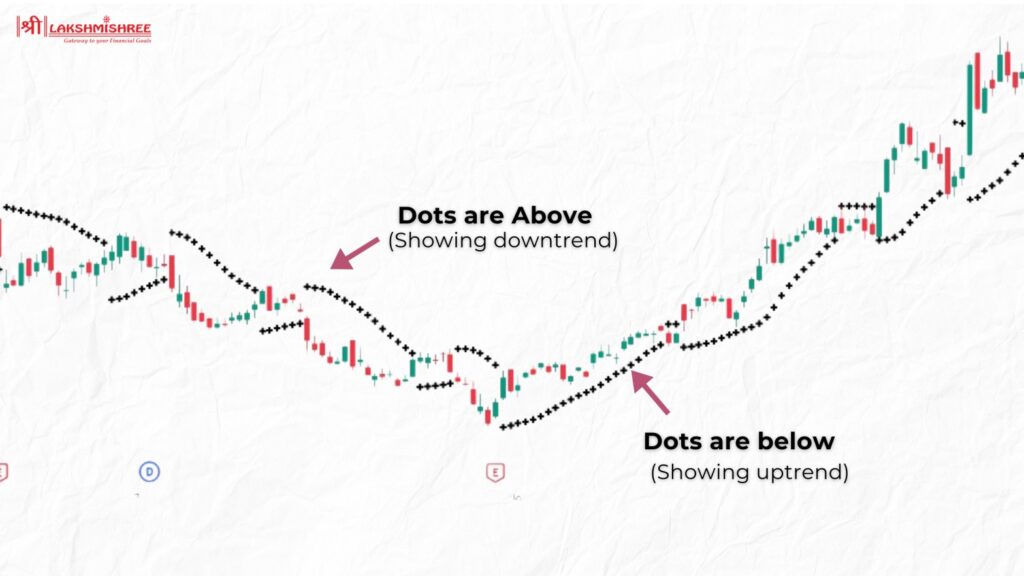
In this chart, you can see how the Parabolic SAR dots indicate the direction of the trend. During an uptrend, the dots are below the price, signalling traders to hold or enter long positions. As the price rises, the dots move closer, providing a trailing stop level. When the trend reverses, the dots switch to above the price, signalling traders to exit long positions or consider short positions.
Pivot Points are one of the best indicators for intraday trading, helping traders identify potential support and resistance levels within the market. These levels are derived from the previous day's high, low, and closing prices, offering a valuable guide for spotting trends and predicting possible market reversals.
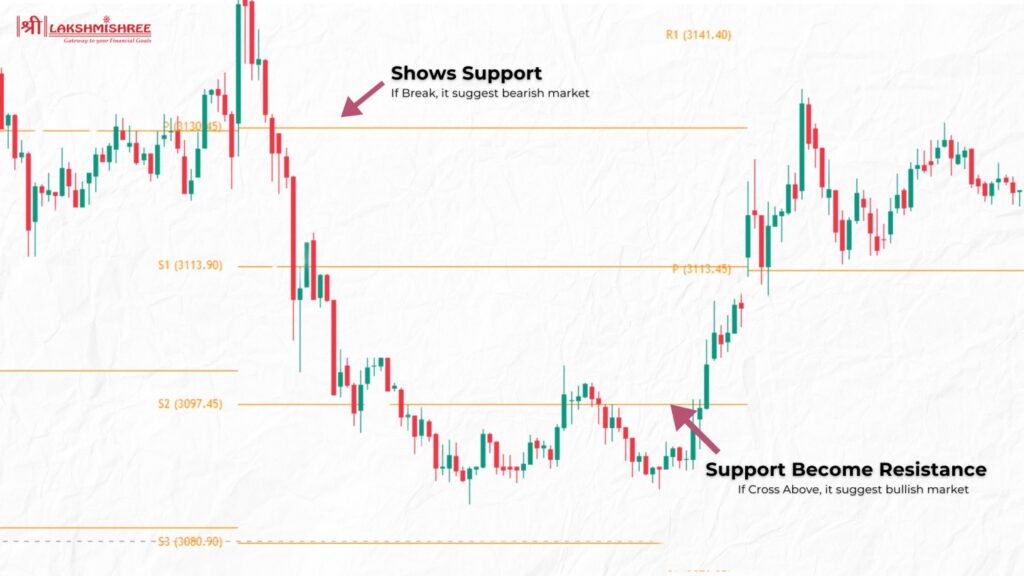
The central Pivot Point is calculated as the high, low, and close average from the prior trading day. From this point, additional support (S1, S2) and resistance (R1, R2) levels are determined, giving traders a broader view of price movement possibilities.
To use Pivot Points effectively, traders plot these levels on charts and monitor how prices interact with them. If the price stays above the central Pivot Point, it signals bullish momentum and potential buying opportunities. Conversely, bearish sentiment may prevail when the price dips below Pivot Point, indicating potential selling opportunities. This indicator is particularly useful for making quick decisions in fast-paced trading environments.

Intraday indicators provide crucial information that helps traders make quick and informed decisions. They offer insights into:
1. Market Trends: Indicators like moving averages and trend lines show the market's overall direction, helping traders align their strategies with the current trend. They make it easier to spot reversals before they happen.
2. Volatility: Tools like Bollinger Bands and ATR measure market volatility, indicating potential price swings and helping traders manage risk. Volatility insights guide entry and exit timing.
3. Momentum: Oscillators such as RSI and MACD gauge the strength and speed of price movements, signalling potential entry and exit points. Momentum indicators are vital in identifying short-term opportunities.
4. Volume Analysis: Indicators like volume and On-Balance-Volume (OBV) track trading activity, confirm price trends, and identify potential reversals. High-volume trends often signify stronger price moves.
Technical analysis tools are essential for intraday traders to analyse market conditions and make informed decisions. These tools help traders interpret price data, identify trends, and develop effective strategies.
1. Charting Software: Platforms like TradingView and MetaTrader allow traders to visualise price movements, customise charts, and apply various indicators, providing a clear view of market trends.
Lakshmishree offers access to premium TradingView charts, which support multiple indicators within a single chart.
2. Trend Lines: Drawing trend lines on price charts helps identify the market direction, support, and resistance levels, guiding entry and exit points.
3. Support and Resistance: Support is a price level where a stock tends to find buying interest, preventing it from falling further. Resistance is a price level where a stock tends to find selling interest, preventing it from rising further.
4. Candlestick Patterns: Patterns like doji and hammer provide insights into market sentiment and potential reversals, helping traders anticipate price movements.
5. Fibonacci Retracement: This tool plots horizontal lines at key Fibonacci levels, indicating potential support and resistance levels where price corrections may occur.
To choose the best intraday trading indicators, consider market trends, your trading time frame, and the type of strategy. Combining tools like EMA with RSI can reduce false signals and improve entry-exit timing. Always backtest your setup before using it in live trades. If you’re new to trading, having a reliable Demat Account is equally important for fast execution and order tracking.
Here are the most important factors to keep in mind:
For options trading, technical analysis is crucial in identifying profitable opportunities. Choosing the best indicator for option trading can help traders decide when to enter or exit options contracts. Below are some of the most effective indicators for option traders:
By incorporating these indicators, option traders can enhance their decision-making process, manage risk, and improve their overall trading strategy.
Also Read: Best Intraday Trading Tips & Strategies | Expert Advice 2026
When selecting the best indicators for intraday trading, it's essential to weigh their advantages and limitations:
| Indicator | Pros | Cons |
|---|---|---|
| Bollinger Bands | Measures volatility effectively, highlights potential breakouts. | Can give false signals in range-bound markets. |
| Relative Strength Index (RSI) | Helps identify overbought and oversold conditions. | Less effective in trending markets. |
| Exponential Moving Average (EMA) | Responds quickly to recent price changes, ideal for trending markets. | Prone to noise and false signals. |
| MACD | Combines trend-following and momentum features. | Delayed signals in volatile markets. |
| Parabolic SAR | Provides clear stop-loss levels. | Works best in trending markets, not in choppy conditions. |
Many traders misuse indicators and end up with false signals. Here's what to avoid while trading intraday in India. These common mistakes can lead to poor entries, late exits, and unnecessary losses even with the best intraday trading indicators:
Using technical indicators wisely is key to making fast and smart intraday trading decisions. Tools like RSI, Bollinger Bands, MACD, and EMA help identify momentum shifts, trend direction, and volatility setups. But no single tool works in isolation. For better results, combine two or more complementary indicators, match them with market conditions, and test your strategy in a demo environment before going live. Stick to your risk rules and stay consistent — that’s how you grow in the fast-moving world of day trading in India.
💡 Want to practice live trading with these tools?
Open your free Lakshmishree Demat account and get access to real-time charts, expert research, and faster order execution.
The best indicators for intraday trading include Bollinger Bands, Relative Strength Index (RSI), Exponential Moving Average (EMA), Moving Average Convergence Divergence (MACD), and Volume. These indicators are best for trading to help traders identify trends, measure momentum, and gauge market volatility.
Intraday trading indicators are important because they show live price action, trend strength, and momentum. They help intraday traders make fast, informed decisions and reduce the risk of emotional or delayed entries.
Intraday indicators can be reliable when used with proper strategy. No indicator is 100% accurate. Combining multiple tools and applying strict risk management improves reliability in volatile intraday markets.
For long-term investing, indicators like the Simple Moving Average (SMA) and Exponential Moving Average (EMA) are often used to identify long-term trends. These indicators help investors decide when to buy or sell based on overall market direction.
Bollinger Bands are a volatility-based indicator that uses a 20-day simple moving average (SMA) and two outer bands. They help intraday traders identify overbought or oversold conditions and forecast breakout potential.
No intraday indicator guarantees 100% accuracy. While tools like Bollinger Bands and RSI are helpful, market conditions can change, so combining indicators and managing risk effectively is important.
Disclaimer: This article is for educational purposes only and should not be considered financial advice. Always conduct your research and consider consulting with a financial advisor before making any investment decisions.
