Posted on February 25, 2025 under Trading by Kaushal Kashyap
5 Best Indicators for Swing Trading: Top Indicator
Swing trading is a widely used trading strategy where traders aim to profit from short-to-medium-term price movements, typically holding stocks for a few days to weeks. Unlike day trading, where positions are closed within a single day, swing trading allows traders to ride market trends while minimizing excessive short-term volatility.
Using the best indicators for swing trading is crucial to succeed in swing trading. These indicators help traders analyze price movements, identify trends, and determine the right entry and exit points. In this guide, we will explore the top swing trading indicators, how they work, and how you can use them to improve your trading strategy.
Table of Content
What is Swing Trading?
Swing trading is the process of capturing gains in a financial instrument over a short to medium period, typically days to weeks. Unlike day trading, with swing trading, one doesn't have to close all positions by the end of the trading day. Trades are held as long as the present momentum stays, which could mean less than an hour or extend to several days.
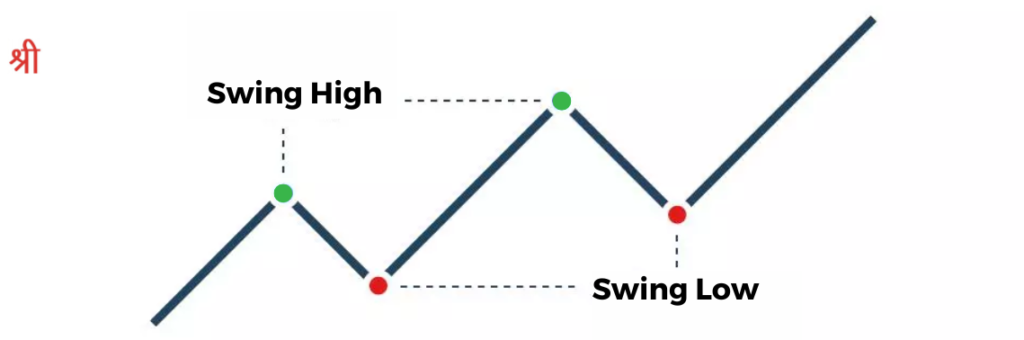
Swing trading involves monitoring two critical price movements:
Swing Highs: These occur when the market reaches a peak before reversing direction. This presents an opportunity for a short trade, where the aim is to sell high and buy back at a lower price.
Swing Lows: These happen when the market hits a bottom and then bounces back. This provides an opportunity for a long trade, where the goal is to buy low and sell at a higher price.
Swing trading indicators are essential for traders to analyze market data and make informed trading decisions. These indicators act as technical analysis tools that help in identifying market trends, momentum, and potential price reversals.
Enhancing Decision Making: The swing trading indicators are meant to inform the trader of the trend and price action of the market and hence the best time to have an entry or exit position.
Improving Accuracy: The indicators help traders get on their journey toward a reduction of guesswork in trading. They provide data-driven insight and improve accuracy in trading decisions.
Identifying Trends: Indicators identify the trend of the market at an early stage, and due to this, traders can capitalize on upward or downward movements.
Measuring Momentum: Indicators such as the Relative Strength Index (RSI) compute the momentum of price changes to convey some notion of the strength and potential continuation of a trend.
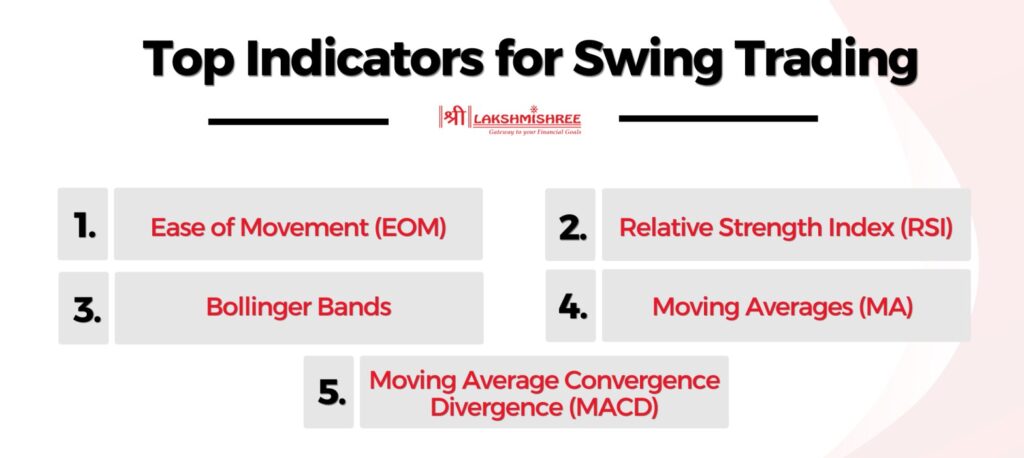
To maximize profits in swing trading, traders use technical indicators to analyze price trends and spot high-probability trade setups. Below are the top 5 best indicators for swing trading, widely used by professional traders to improve trade accuracy and boost profitability.
1. Ease of Movement (EOM)
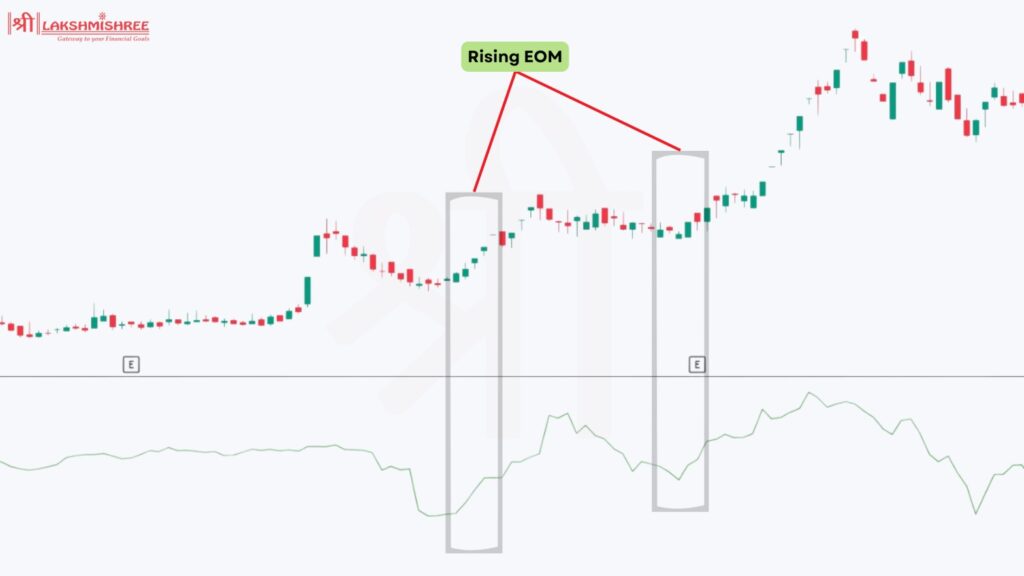
Ease of Movement (EOM) is a volume-based indicator showing the relationship between price movement and volume. It is useful in understanding how easily the price of a stock is moving and whether there is a significant volume behind the changes in prices.
How to Use: It is calculated by subtracting today's low price from today's high price and then again dividing it by volume before finally smoothing it over a number of days. The key signals that occur in the EOM are where the bar crosses above or below the zero line. A plus EOM reflects an uptrend, indicating that price is moving up easily on less volume. A negative EOM indicates a downtrend.
Practical Application: Use EOM to determine the trend's strength. For example, if EOM is rising and the price is moving up, that confirms a strong uptrend. Conversely, if EOM is falling and the price is moving down, it confirms a strong downtrend.
Example Chart:
2. Relative Strength Index (RSI)
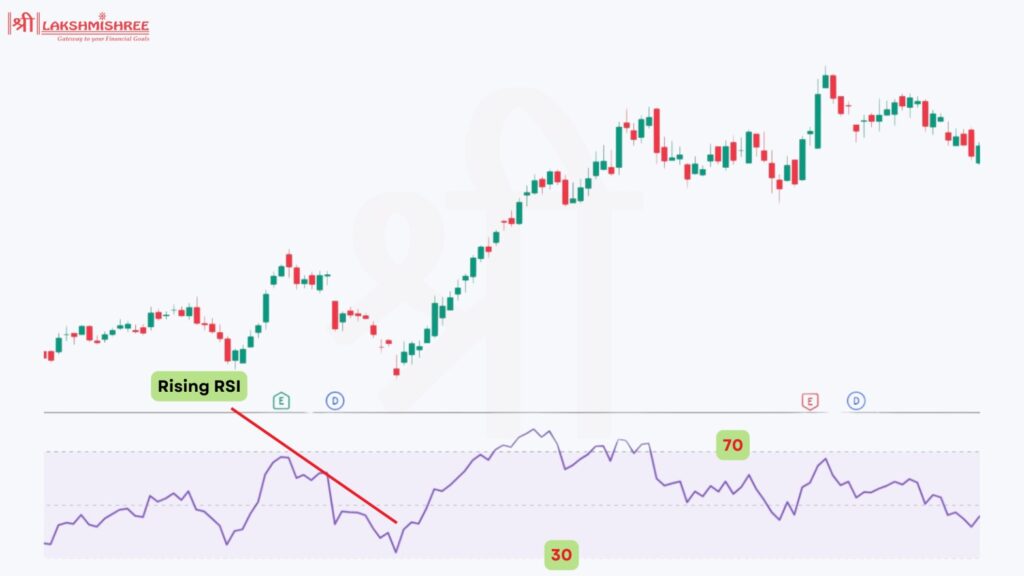
The Relative Strength Index is one of the best swing trading indicators, and it is a type of momentum oscillator that measures speed and change in price movements. It ranges from 0 to 100 and is applied to assess overbought or oversold conditions in the market.
How to Use: It is calculated by comparing the magnitude of recent gains against recent losses. If the RSI reading is above 70, then that flags the situation as indicating the stock is overbought and due for a pullback. An RSI below 30 suggests that the stock is oversold and ready for a rebound.
Practical Application: Use RSI to pinpoint places that could indicate a potential reversal. For instance, if the RSI is moving above 70 and starts to decline, this may be a sell signal. If it is below 30 and begins to rise, it may be a buy signal.
Example Chart:
3. Bollinger Bands
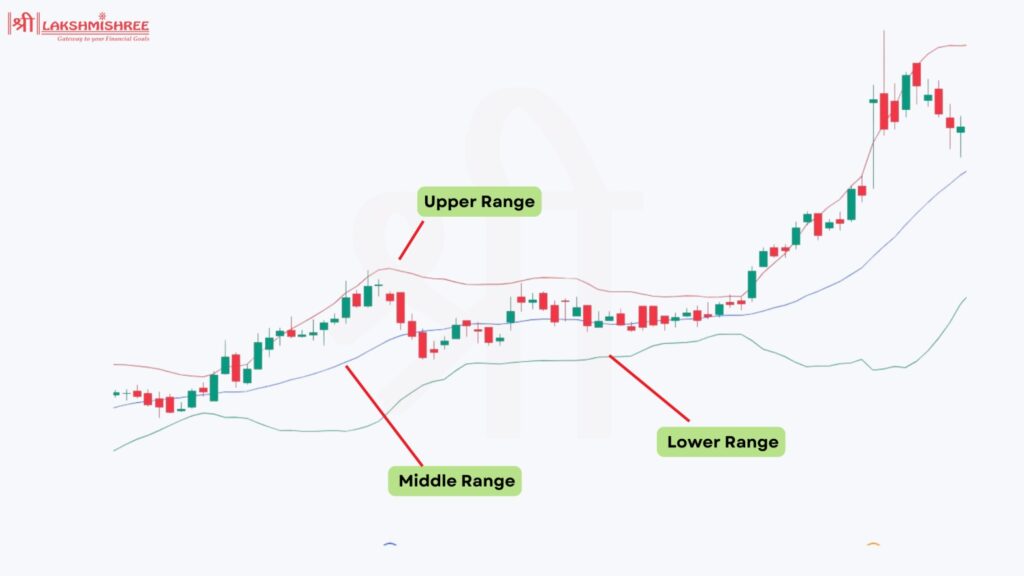
Bollinger Bands consist of a middle band (usually a 20-day moving average) and two outer bands that represent standard deviations away from the middle band. They help identify volatility and potential price reversals.
How to Use: If the price touches the upper band, it may be overbought. If it touches the lower band, it may be oversold. Bollinger Bands can also signal periods of high or low volatility. A squeeze—bands coming close to one another—would suggest a breakout from periods of low volatility; wide bands would simply denote high volatility.
Practical Application: Using Bollinger Bands to identify breakout opportunities and confirm trends. For example, when the price breaks above the upper band with increasing volume, this could be interpreted as a sign that an uptrend is brewing. In the same vein, if the price breaks below the lower band, then a downtrend may have begun.
Example Chart:
4. Moving Averages (MA)
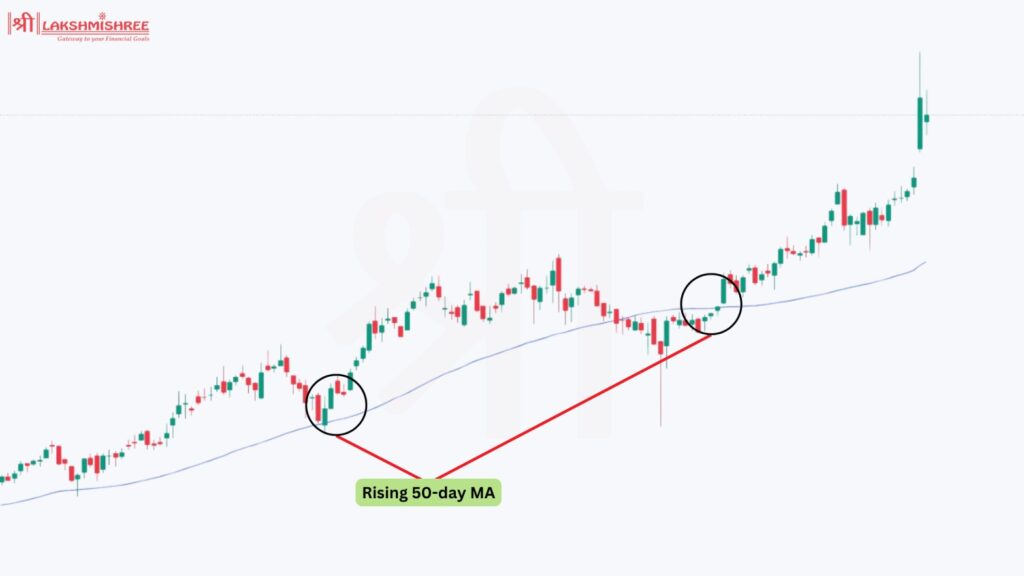
Moving Averages (MA) are among the most reliable indicators for swing trading, helping traders identify the overall market trend by smoothing out price fluctuations. The two main types are the Simple Moving Average (SMA) and the Exponential Moving Average (EMA).
How to Use: Moving averages are calculated by averaging the closing prices over a specified period. A short-term MA (e.g., 20-day) crossing above a long-term MA (e.g., 50-day) indicates a buy signal (Golden Cross), while the reverse indicates a sell signal (Death Cross).
Practical Application: Identify the trend directions and possible reversal points through moving averages. For example, if the price is greater than the moving average, then one could indicate an uptrend is taking place. And where the price is less than the moving average, one would expect a downtrend. Use crossovers to generate signals for entry and exit.
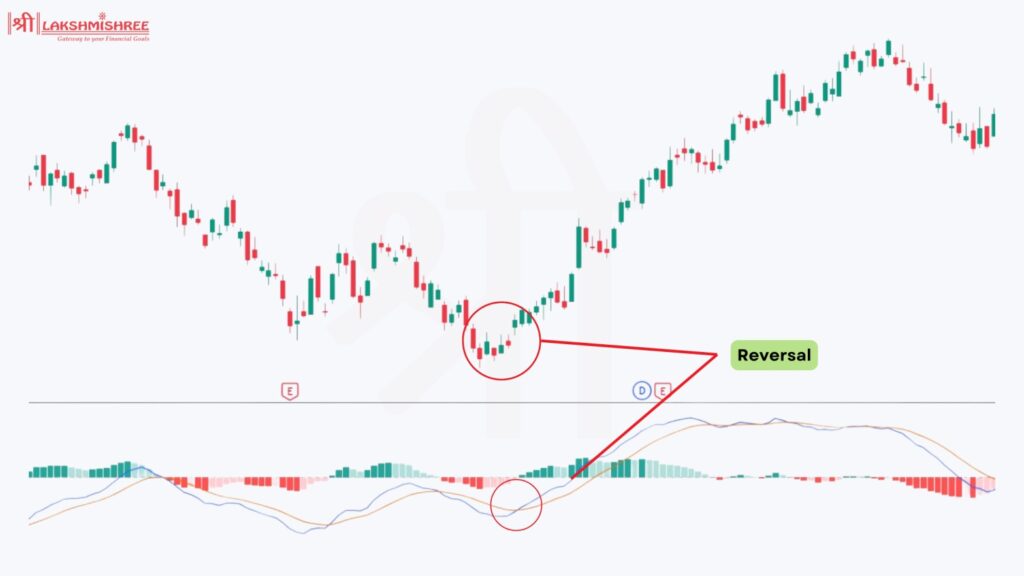
How to Use: The MACD line is the difference between the 12-day and 26-day EMAs. The signal line is the 9-day EMA of the MACD line. The histogram shows the difference between the MACD line and the signal line. When the MACD line crosses above the signal line, it indicates a buy signal. When it crosses below, it indicates a sell signal.
Practical Application: Use it to determine the reversal of a trend and its strength. For example, a bullish crossover—the MACD line crossing above the signal line—could be an indication that an uptrend may occur, while a bearish one may indicate the possibility of a downtrend.
Example Chart:
Information Offered by Swing Trading Indicators
Swing trading indicators are very important in giving relevant information to the trader for making a worthwhile decision. They provide valuable information on:
Entry and Exit Points: The moving average and Bollinger Bands show entry and exit points to help in trade timing for profitable trades.
Trend Reversals: Another strong tool, like the stochastic oscillator along with support and resistance levels, for giving indications of a possible change in market direction, thus enabling traders to project what is going to happen and to act accordingly.
Volatility: Measures like Bollinger Bands and Average True Range (ATR) provide insights into market volatility, helping traders assess risk and make informed decisions based on potential price swings.
Volume Analysis: Indicators such as On-Balance Volume (OBV) and Volume Weighted Average Price (VWAP) track trading activity, confirm trends, and highlight potential reversals by showing the strength behind price movements.
Best Patterns for Swing Trading
Mastering swing trading patterns helps traders spot trend reversals and continuation trends, improving entry and exit strategies.
Head and Shoulders: A bearish reversal pattern with three peaks, signaling a downtrend when the price breaks below the neckline.
Cup and Handle: A bullish continuation pattern resembling a tea cup, where a breakout above resistance signals upward momentum.
Double Tops & Bottoms: Indicate trend reversals—double tops suggest a bearish move, while double bottoms hint at a bullish reversal.
When using swing trading indicators, it's important to follow best practices to maximize their effectiveness and avoid common pitfalls. Here are some suggestions for using swing trading indicators:
Combine Multiple Indicators: Putting multiple indicators together can give a more comprehensive view of the market and confirm the signals given. For example, moving averages combined with RSI will produce a clearer view of the trend direction and momentum.
Adjust Indicator Settings: These settings are different for each indicator, depending on various stocks and different market conditions. For example, you may want to set up the period as a 20-day moving average in one stock and a 50-day moving average in another. Play with these different settings until you have figured out what really works best for your trading style and the kind of stocks being traded.
Stay Informed: Market conditions can change rapidly, so it's important to stay informed about news and events that could impact your trades. Use indicators as part of a broader strategy that includes fundamental analysis and staying updated on market news.
Practice with a Demo Account: Always practice any of the swing trading indicators in a demo account before actual trading. This gives you the time to try out different strategies and settings without putting your capital at risk.
Keep a Trading Journal: Keep a trading journal where you record each trade you make and what indicators you used to make the trade. This helps a trader to know what works and what doesn't, thus enabling him to refine his strategy over time.
Conclusion
Using the best indicators for swing trading can increase your chances of executing profitable trades. Technical indicators like RSI, MACD, Bollinger Bands, and Moving Averages help traders identify trends, assess market momentum, and determine optimal entry and exit points.
To improve your swing trading strategy, experiment with different indicators and combine multiple tools for better accuracy. No single indicator is foolproof, so always use proper risk management strategies alongside technical analysis.
Frequently Asked Questions
1. What are the best indicators for swing trading?
The best swing trading indicators are RSI, MACD, Bollinger Bands, and moving averages. These tools help traders identify trends, measure momentum, and determine entry and exit points.
2. Which is the best volume indicator for swing trading?
On-Balance Volume (OBV) is highly regarded for swing trading as it shows the relationship between volume and price movement. Volume Weighted Average Price (VWAP) is also useful for identifying the average price traders are willing to pay.
3. How many indicators should I use for swing trading?
Using 2-3 indicators is often sufficient. Combining different types, like a momentum indicator with a trend indicator, provides a comprehensive market view without overwhelming analysis.
4. Can I use swing trading indicators for day trading?
Yes, many swing trading indicators, like RSI and MACD, can be applied to day trading. However, the time frames will be shorter, and the signals may require faster responses.
5. What time frames are best for swing trading?
Swing traders typically use daily and weekly charts to identify trends and patterns. Four-hour charts can also be useful for fine-tuning entry and exit points.
6. How do I backtest swing trading strategies?
Backtesting involves applying your swing trading strategy to historical data to see how it would have performed. Use trading platforms like TradingView or MetaTrader, which offer backtesting features.
7. What tools are needed for swing trading?
The very basic tools will include a good trading platform, charting software, and access to real-time data. At the same time, a good grasp of technical analysis concepts and risk management practices is also necessary for success.
Disclaimer: This article is for educational purposes only and should not be considered financial advice. Always conduct your research and consider consulting with a financial advisor before making any investment decisions.
Ayush is a seasoned financial markets expert with over 3years of experience. He has a passion for breaking down complex financial concepts into simple, digestible terms. Through his 50+ articles, Ayush has helped countless individuals navigate the often intimidating world of finance.