logo-lakshmshree
Posted on  October 28, 2024 under  by Ayush Maurya

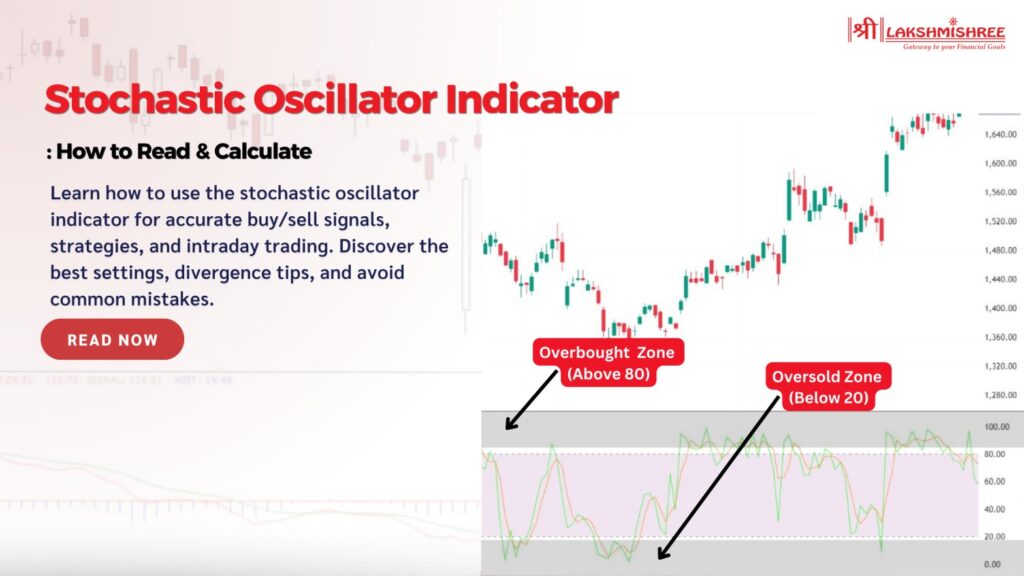
Stochastic Oscillator Indicator: How to Read & Calculate

In trading, timing is everything. Whether you're looking for the ideal moment to enter or exit, finding reliable signals can make all the difference. That’s where the stochastic oscillator indicator shines. This powerful tool helps traders spot overbought and oversold conditions, making it easier to anticipate potential reversals in the market.

But how exactly does it work, and how can you use it effectively? This guide will walk you through everything—from understanding its basics to applying advanced strategies.

What is the Stochastic Oscillator?

The stochastic oscillator is a momentum indicator that compares a stock’s closing price to its price range over a specific period, typically 14 periods. It’s designed to show where the stock’s price is relative to its recent high and low, helping traders identify whether it is potentially overbought or oversold. This can be especially useful in volatile markets, where quick shifts in momentum can signal entry and exit points for traders.

Two lines on the chart represent this indicator: the %K line, the main line, and the %D line, which is a moving average of %K. By observing the movement and interaction of these lines, traders can gain insights into potential reversals and trend strength, helping them make more informed trading decisions.

How to Read the Stochastic Oscillator Indicator

It helps traders understand where a stock’s price sits within its recent range by using a scale from 0 to 100. Here’s a simple breakdown of what different readings mean:

  • Above 80: If the oscillator is above 80, the stock is considered overbought, trading near its recent price range. This suggests that the price might soon be due for a pullback or decline.
  • Below 20: When the reading falls below 20, the stock is seen as oversold. This means it’s trading near the bottom of its recent range, which could indicate a potential bounce or upward movement.

In addition, readings above 50 mean the stock is trading in the upper part of its recent range, while below 50 indicates it’s in the lower part. These levels give traders a quick snapshot of the stock’s momentum.

Key Signals to Watch: One of the most important signals in the oscillator is the crossover between the %K line and the %D line:

  • %K crosses above %D: This is a buy signal, showing potential upward momentum.
  • %K crosses below %D: This is a sell signal, indicating possible downward movement.

Crossovers in overbought (above 80) or oversold (below 20) zones are considered stronger signals. For instance, if the %K line crosses below the %D line when the oscillator is above 80, it strongly indicates that the stock might start declining. Similarly, a crossover below 20 suggests the stock could be set to rise.
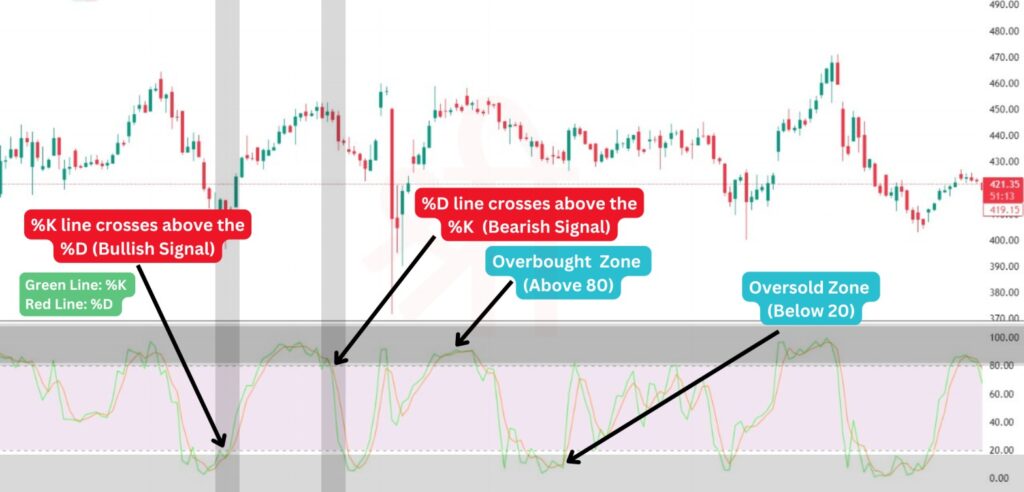
How to Read the Stochastic Oscillator

Stochastic Oscillator Calculation

It relies on two key components, the %K line and the %D line, to gauge momentum by comparing the closing price of an asset to its price range over a specific period.

Formula of Stochastic Oscillator for Calculating the %K Line

The %K line represents the current price's position relative to the asset's price range over the last 14 periods (which could be days, hours, or minutes, depending on the timeframe you’re analysing). Here's the formula:

  • CP = The most recent closing price
  • L14 = The lowest price of the asset in the past 14 trading sessions
  • H14 = The highest price of the asset in the past 14 trading sessions

This calculation results in a percentage value between 0 and 100, showing where the current price stands relative to the recent high and low prices.

Formula of Stochastic Oscillator for Calculating the %D Line

The %D line, on the other hand, is a smoothed version of the %K line. It’s calculated as the 3-period moving average of %K and serves as a signal line to identify potential reversals.

Where:

  • H3 = Highest price of the asset in the last 3 trading sessions
  • L3 = Lowest price of the asset in the last 3 trading sessions

The %D line smooths out the fluctuations in %K, providing a clearer view of the trend direction.

Key Points to Remember

  • %K is the fast line, reacting more quickly to price changes, while %D is the slower, smoothed line.
  • The 80 and 20 levels are commonly used thresholds for overbought (above 80) and oversold (below 20) conditions.
  • In an uptrend, the %K line generally stays close to its highs, while in a downtrend, it stays near its lows.

Lakshmishree automatically calculates the %K and %D values, so traders don’t have to perform these calculations manually. 

Start Investing - LISPL Investment

Stochastic Oscillator Strategy

Using the indicator effectively often comes down to applying it with specific strategies. Here, we’ll cover two popular strategies: Overbought/Oversold and Crossover. Both approaches can help traders identify potential entry and exit points, particularly in range-bound markets.

1. Overbought/Oversold Strategy

The Overbought/Oversold Strategy focuses on the 80 and 20 levels of the oscillator, which represent overbought and oversold conditions:

  • Overbought Signal: The asset is considered overbought when the oscillator reading goes above 80. Rather than selling immediately, many traders wait for the oscillator to drop back below 80, which serves as a sell signal.
  • Oversold Signal: The asset is considered oversold when the oscillator falls below 20. A buy signal is generated once the oscillator rises above 20, indicating a potential price increase.

This strategy is especially useful when the market moves within a defined range, as overbought/oversold levels help pinpoint possible reversals.
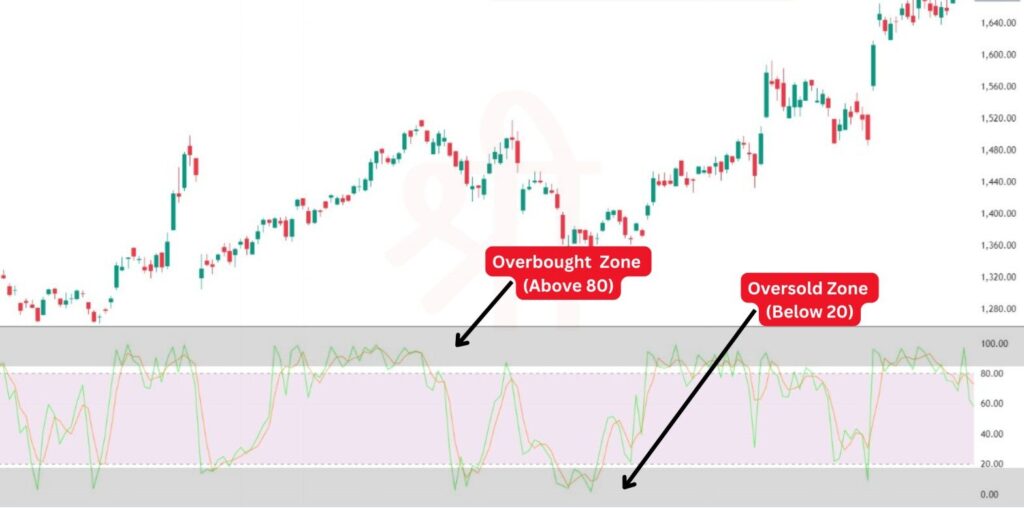
Overbought/Oversold Strategy: Stochastic Oscillator

2. Crossover Strategy

The Crossover Strategy is based on the relationship between the %K and %D lines. This strategy can generate both buy and sell signals when these two lines cross each other in specific zones:

  • Buy Signal: A buy signal occurs when the %K line crosses above the %D line in the oversold area (below 20). This suggests the asset may be gaining upward momentum.
  • Sell Signal: A sell signal is generated when the %K line crosses below the %D line in the overbought area (above 80), indicating a possible price reversal.

This strategy is often more effective in a range-bound market and may produce false signals during strong trends. However, combining it with other indicators, such as moving averages or RSI, can enhance its reliability.
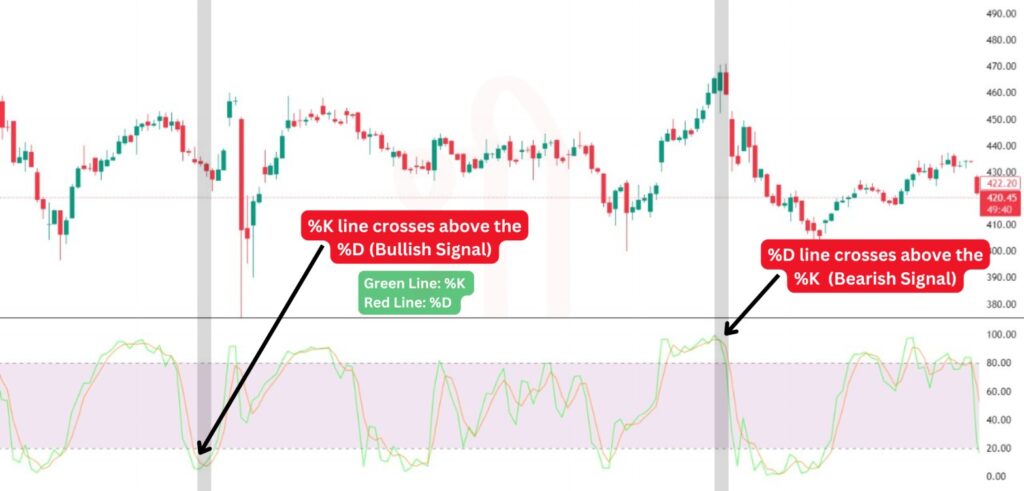
Crossover Strategy: Stochastic Oscillator

Stochastic Oscillator Divergence: A Powerful Signal

The divergence strategy is used to identify potential trend reversals by observing discrepancies between price action and the stochastic indicator.

  • Bullish Divergence: Occurs when the price makes a lower low, but the oscillator forms a higher low. This suggests that selling pressure is weakening, signalling a potential upward reversal. Before entering, wait for confirmation, like a price increase or a crossover.
  • Bearish Divergence: This happens when the price reaches a higher high while the stochastic indicator shows a lower high. This indicates that buying momentum is slowing, hinting at a possible downward reversal. Again, waiting for a confirmed price drop before making a trade is wise.

This strategy works well in range-bound markets, where reversals are more predictable. Used carefully, the divergence strategy can help you spot shifts in momentum and time your trades more effectively.

Stochastic Oscillator Indicator Best Settings

Choosing the right stochastic oscillator settings can optimize the indicator’s accuracy based on your trading style and asset type. Here’s a quick guide:

  • Default Settings: The standard setting is usually 14, 3, 3 (14-period lookback, 3-period %K smoothing, and 3-period %D smoothing). This works well for general analysis but may require adjustments depending on the market.
  • Short-Term Trading (Intraday):
    • Settings: Try 5, 3, 3 for quicker response.
    • Purpose: It helps capture rapid movements and is ideal for high-volatility assets.
  • Long-Term Trading (Position/Swing):
    • Settings: Consider 21, 5, 5 for smoother signals.
    • Purpose: Reduces false signals in volatile markets, making it suitable for stocks or other assets with longer holding periods.

Adjusting your indicator settings based on the asset and timeframe can greatly improve signal reliability, helping you align the indicator with your specific trading strategy.

Relationship Between Stochastic Oscillator and RSI Strategy

The stochastic oscillator and Relative Strength Index (RSI) are popular momentum indicators but have different strengths. Here’s how they compare and how combining them can enhance your trading strategy:

  • Primary Focus:
    • Stochastic Oscillator: Measures momentum by comparing the closing price to a range over a set period, highlighting overbought (above 80) and oversold (below 20) levels.
    • RSI: Measures the speed and change of price movements to identify overbought (above 70) and oversold (below 30) conditions.
  • Combining Both for Better Accuracy:
    • When both indicators show overbought or oversold signals, it can strengthen the case for a potential reversal.
    • For example, if the oscillator indicates overbought conditions while the RSI is also above 70, it provides a stronger signal for a possible downward reversal.
  • Ideal for Trend Confirmation:
    • Use the oscillator indicator for pinpointing entry/exit points, while the RSI can help confirm the broader trend.
    • Stochastic is useful for shorter moves in range-bound markets, while RSI provides a broader market sentiment check.

Combining the stochastic oscillator indicator and RSI strategy can improve accuracy in identifying potential trade setups, reducing false signals, especially in volatile markets.

Start Investing - LISPL Investment

Limitations of the Stochastic Oscillator Indicator

  • False Signals in Strong Trends: The oscillator often gives repeated overbought or oversold signals, leading to inaccurate trade entries. Use it with other trend-confirming indicators to avoid this.
  • Less Reliable in High Volatility: Volatile markets can cause erratic oscillator movements, making interpreting harder. Smoothing settings or combining with other indicators can help filter out noise.
  • Lagging Nature: As a lagging indicator, the oscillator is based on historical price data, which can result in delayed signals. Real-time confirmation tools can offset this delay.

Final Thoughts

The stochastic oscillator indicator is valuable for traders looking to gauge market momentum, identify potential reversals, and enhance their entry and exit points. When used with the right settings and combined with other indicators, it can help reduce false signals and improve trading accuracy.

However, like any indicator, it’s essential to understand its limitations and adapt its use based on market conditions. Experimenting with different oscillator settings and integrating additional tools can refine your trading strategy and give you a competitive edge.

Frequently Asked Questions (FAQs)

1. What are the best stochastic oscillator settings for scalping?

For scalping, a faster setting like 5, 3, 3 is often used to capture short-term price movements and increase responsiveness.

2. How is the stochastic oscillator different from the RSI?

While both are momentum indicators, the oscillator compares closing prices to a recent range, whereas the RSI measures the speed and change of price movements. Both can complement each other for better accuracy.

3. Can the stochastic oscillator be used for long-term trading?

Yes, but longer settings like 21, 5, 5 are typically preferred for more stable signals in long-term trades, as they reduce sensitivity to short-term price fluctuations.

4. What’s the difference between the ultimate and stochastic oscillators?

The ultimate oscillator combines multiple timeframes to provide a broader view of momentum, while the stochastic focuses on a single period’s high-low range. Each has its own strengths depending on the trading strategy.

5. Is stochastic oscillator divergence a reliable reversal signal?

Divergence can indicate a potential reversal, but waiting for confirmation is essential, as prices can continue trending despite divergence.

6. How can I improve accuracy when using the stochastic oscillator indicator?

Combining the stochastic oscillator with other indicators like RSI or moving averages and adjusting settings based on market conditions can help improve signal accuracy.

Disclaimer: This article is intended for educational purposes only. Please note that the data related to the mentioned companies may change over time. The securities referenced are provided as examples and should not be considered as recommendations

Ayush Maurya

Written by Ayush Maurya

Ayush is a seasoned financial markets expert with over 3years of experience. He has a passion for breaking down complex financial concepts into simple, digestible terms. Through his 50+ articles, Ayush has helped countless individuals navigate the often intimidating world of finance.

open-account-ad-2

Social Share

Subscribe to Our Newsletter

Loading
CIN No U74110MH2005PLC157942     |    Member Ship Details     |    BSE-3281     |    NSE-12817     |    MCX-55910     |    DP:IN-DP-CDSL-490-2008     |    DPID:12059100    |    SEBI Regn. No.: INZ000170330     |    Mutual Fund: ARN-77739    |    Research Analyst: registration number INH000014395
logo-lakshmshree-white
Lakshmishree Investment & Securities Ltd. was incorporated in 2005. We are a Corporate Member of NSE, BSE, MCX and Depository Participant with CDSL.
Most Popular in LISL
Copyright @ 2024 © Lakshmishree Investment & Securities Ltd. All Right Reserved.