logo-lakshmshree
Posted on  September 27, 2024 under  by Anshul Jain

VWAP Indicator (Volume Weighted Average Price): How to Use

Finding the right price to buy or sell in the stock market can be tricky. Many traders struggle to understand if they're making the right decision at the right time. This is where the VWAP indicator comes in handy. It helps traders know the average price of a stock throughout the day by factoring in both price and volume.

In this blog, we'll explain the VWAP indicator, how to use it effectively, and why it’s important for making smart trading decisions. If you want to improve your trading strategy, this guide is the perfect place to start.

What is VWAP?

The VWAP indicator, or Volume Weighted Average Price, is a technical tool that traders use to understand the average price of a stock, adjusted for its trading volume, throughout the day. Unlike traditional price averages, the VWAP indicator reflects price movement and considers how much volume is traded at each price level. This makes it more accurate for identifying fair entry and exit points.

It’s especially useful for intraday traders and portfolio managers who want to make informed decisions. In simple terms, the VWAP indicator shows whether a stock is trading above or below its average price for the day, helping traders identify overvalued or undervalued positions. Stocks trading below the indicator are often considered cheap, while those above the indicator are seen as more expensive.

Best VWAP Indicator Settings for Day Trading

The VWAP indicator is typically used on intraday charts, meaning it resets at the start of each new trading day. Most traders use VWAP on short time frames like 1-minute or 5-minute charts, but it can be applied to any timeframe depending on your trading style.

Some key settings to keep in mind:

  • Time Frame: The most common use of the VWAP indicator is on intraday charts (like 1-minute, 5-minute, or 15-minute), but it’s important to remember that VWAP always resets with each new trading session.
  • Chart Type: Traders often use candlestick charts to see price movement in relation to the VWAP line. The VWAP appears as a smooth line that traders use to track the average price.
  • Customisation: Some platforms allow you to adjust the VWAP’s settings, like its colour and thickness, but the core calculation stays the same. There’s also an option for Anchored VWAP, where traders can manually set the start point for VWAP, like after significant events such as earnings announcements or market news.

The VWAP indicator doesn’t require complex settings to be useful, but knowing how to apply it to different timeframes and charts can enhance your trading decisions.

How is VWAP Calculated?

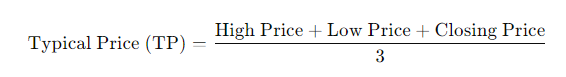
The VWAP indicator (Volume Weighted Average Price) is calculated using intraday data, starting from the opening of the market and ending with its close. It tracks the typical price of a stock throughout the trading day, factoring in both the stock’s price and the volume of shares traded. This allows traders to see whether a stock is trading above or below its daily average price.

Its calculation may sound complicated, but it follows a simple step-by-step process that combines price and volume to give a more accurate picture of market activity. Though most trading platforms calculate VWAP automatically, understanding how it’s computed can give traders an edge in making better trading decisions.

VWAP Formula

The VWAP formula is straightforward:

VWAP Formula

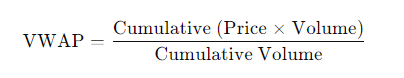
Here’s how it breaks down:

  1. Typical Price: First, you calculate the typical price of the stock by averaging the high, low, and closing prices of the stock for the period.

  2. Price × Volume: Multiply this typical price by the trading volume during the same time period.
  3. Cumulative Volume: Add up the trading volume throughout the day to get the cumulative volume.
  4. VWAP: Finally, divide the total value of (Price × Volume) by the cumulative volume to get the VWAP.

VWAP Calculation Example

This section will give a clear picture of how traders use VWAP to determine the average price based on both price and trading volume.

Let’s assume the following data for a stock during a specific time period:

  • High Price: ₹100
  • Low Price: ₹95
  • Closing Price: ₹97
  • Volume: 50,000 shares

1. Calculate the Typical Price (TP):

2. Multiply the Typical Price by the Volume:

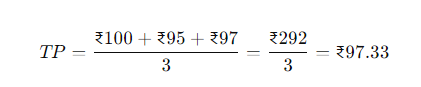
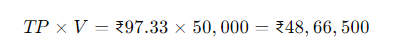
Next, multiply the Typical Price by the volume of shares traded in that period:

3. Track the Cumulative Volume (CV):

Let’s assume that the cumulative volume at this point is 78,000 shares.

4. Calculate VWAP:

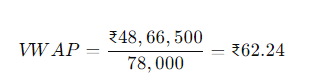
Thus, the VWAP for this period is ₹62.24. Traders would use this value to assess whether the stock is currently trading at a fair price. The stock might be undervalued if the current price is below ₹62.24. If it's trading above this, it could be considered overvalued

Start Investing - LISPL Investment

How to Trade Using the VWAP Indicator

The Volume Weighted Average Price is a powerful tool that traders use to improve their trading strategies in various ways. While the VWAP helps you gauge whether a stock is overvalued or undervalued based on price and volume, combining it with other indicators like the MACD or stochastic can enhance its effectiveness. Let's explore some practical methods to trade using Volume Weighted Average Price effectively.

1. VWAP as Support and Resistance

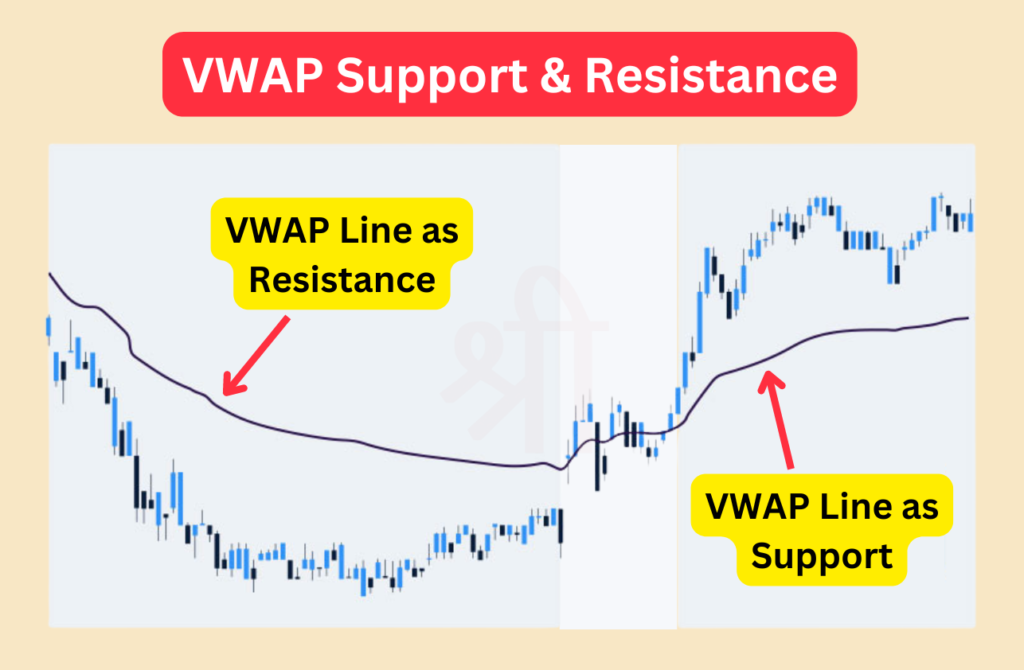
One of the most common ways traders use the VWAP indicator is to identify key support and resistance levels. The VWAP line acts as a simple visual guide:

  • Support: If the stock is trading above the indicator line, it acts as support. Traders often consider this a bullish sign, where the indicator line holds the price above it.
  • Resistance: When the stock is trading below the VWAP Indicator, the line acts as a resistance level. In this case, it suggests that the stock might struggle to break above this level.

Additionally, the direction of the VWAP line helps determine the current trend:

  • An upward-sloping VWAP line indicates a bullish trend.
  • A downward-sloping VWAP line signals a bearish trend.
VWAP as Support and Resistance

2. Entry and Exit Points

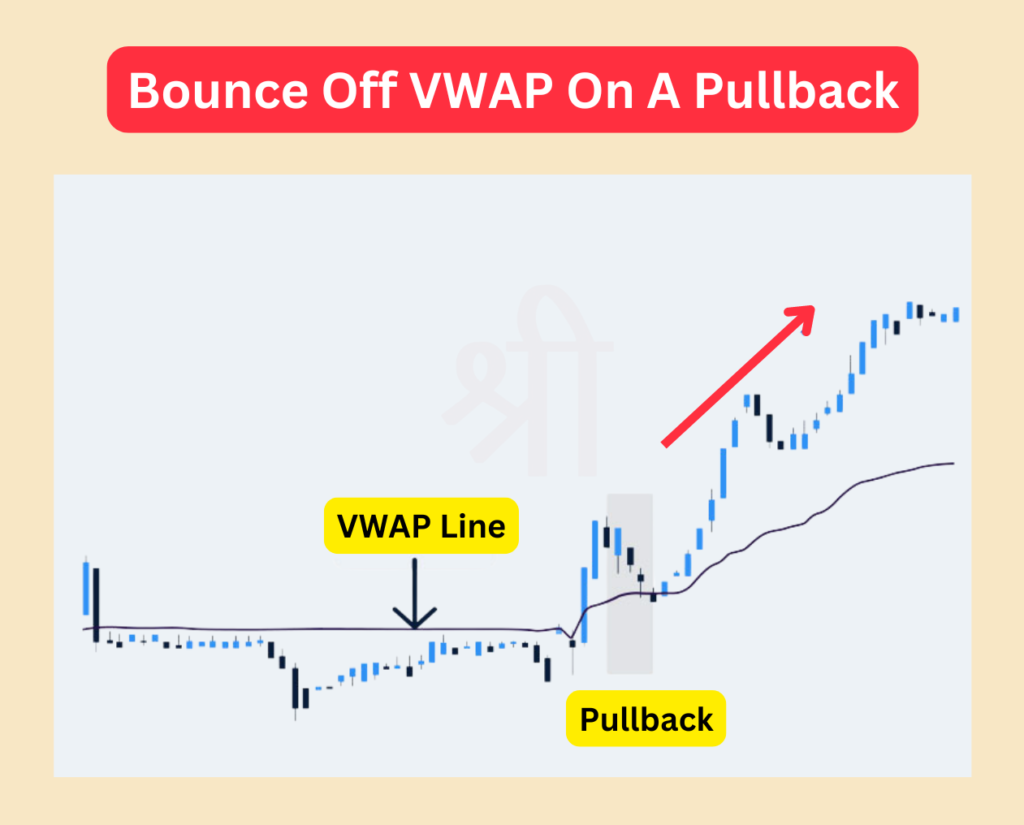
The indicator is incredibly helpful for finding entry and exit levels. Here’s how it works:

  • Entering a Trade: A trader looking to go long might wait for the stock to break above the VWAP, confirming the stock is gaining strength. Another strategy is to wait for the price to pull back and "bounce" off the VWAP line, which could indicate a buying opportunity.
  • Exiting a Trade: It can act as a potential exit target for traders who are already long if the stock falls below the VWAP line. Similarly, traders looking to take profits can set an indicator line as their exit point once the stock price reaches it.

Some traders use VWAP envelopes (upper and lower bands) to help identify when to buy or sell. For instance, when the price returns towards the VWAP after touching the envelope lines, it signals a potential entry or exit point.

VWAP Indicator Entry and Exit Points

3. Gauging Relative Strength or Weakness

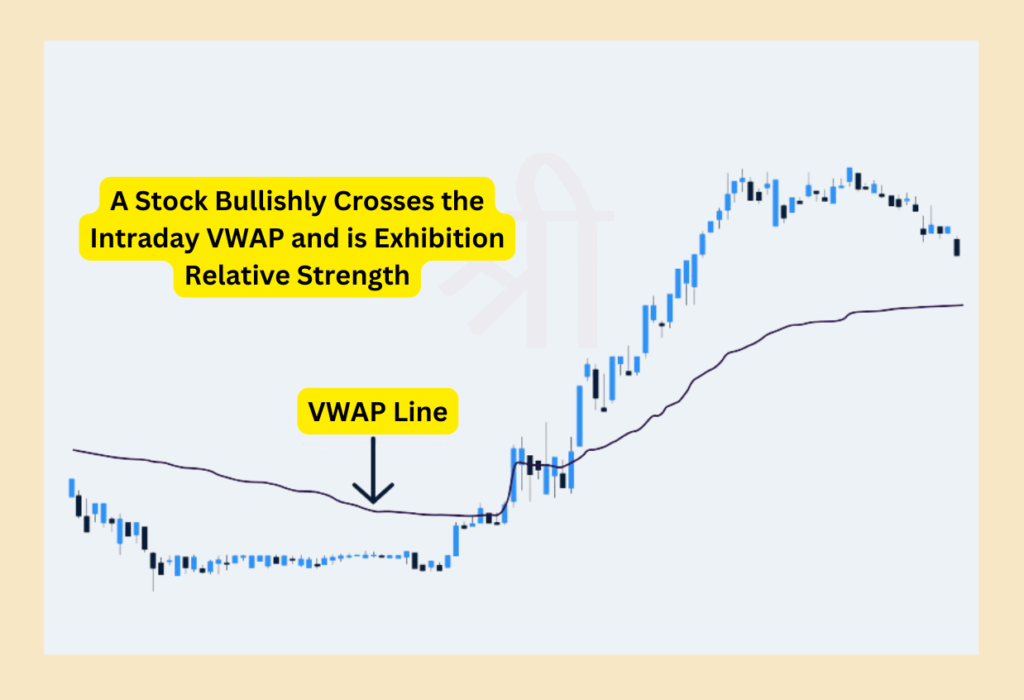
The VWAP indicator can also be used to gauge a stock's relative strength or weakness.

  • Relative Strength: A stock trading above the indicator line shows strength—it’s trading above the average price for the day, and traders might consider this bullish.
  • Relative Weakness: A stock trading below the indicator line shows weakness, indicating it’s underperforming compared to its daily average price. Traders may view this as a bearish signal.

By comparing the VWAP of a stock to the VWAP of its benchmark index or peer stocks, traders can quickly understand whether the stock is stronger or weaker than the market. This is particularly useful for traders looking to short-sell or buy stocks based on their relative performance.

For instance, shorting a stock that’s trading above the indicator line could be risky, as it may experience a short squeeze—a rapid upward movement in price. However, shorting a stock that’s trading below VWAP aligns your trade with the existing trend, minimizing risk.

VWAP Gauging Relative Strength or Weakness

4. Trading VWAP Price Crosses

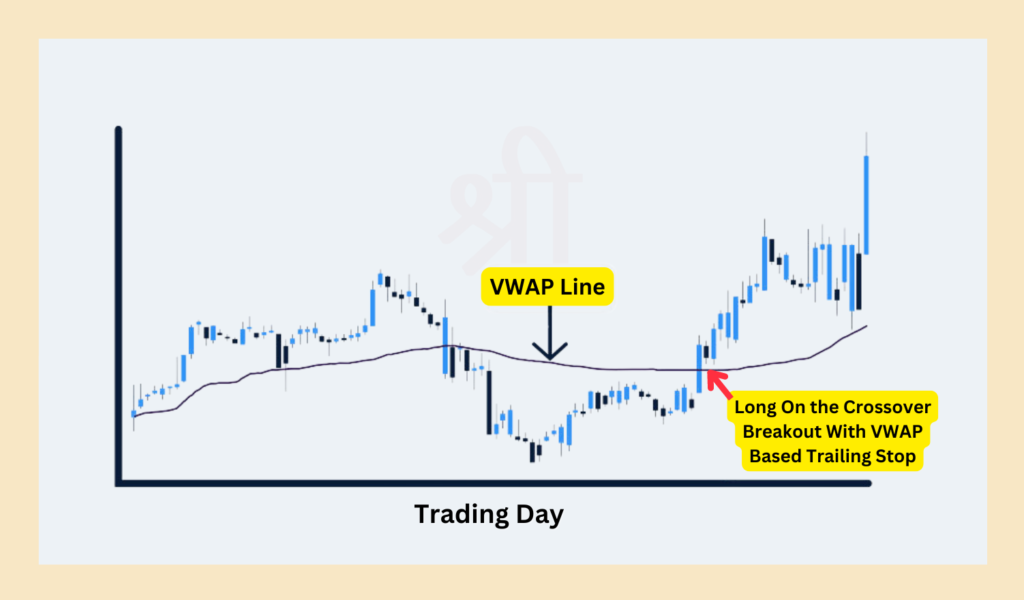
Another popular strategy is to trade when the price crosses the VWAP line.

  • Bullish VWAP Crossover: When the stock price moves from below the Volume Weighted Average Price to above it, it can signal a breakout. Traders often see this as a signal to go long, assuming the stock is gaining strength and momentum.
  • Bearish VWAP Crossunder: When the stock price moves from above the Volume Weighted Average Price to below it, it can signal a breakdown. This might trigger traders to short-sell the stock, as it indicates the price is weakening.

Traders often use this indicator as a stop-loss level. For example, if you enter a long trade after a breakout above VWAP, you might set a stop-loss just below the indicator line to limit potential losses if the trade goes against you.

Trading VWAP Price Crosses

What is Anchored VWAP?

While the standard Volume Weighted Average Price indicator resets every day, Anchored VWAP is a more flexible version that allows traders to set a custom starting point for the calculation. This starting point can be any significant event in the stock's price history, such as earnings reports, market news, or major announcements.

Key Features of Anchored VWAP:

  1. Custom Start Point:
    Unlike traditional Volume Weighted Average Price, which always begins with the market’s opening bell, Anchored VWAP can be "anchored" to any point in time. Traders can choose to anchor it at key events such as:
  2. More Accurate Insights:
    By allowing traders to set specific points from which to start calculating VWAP, the Anchored VWAP gives a more precise view of how the stock has performed since that event. This makes it particularly useful for long-term investors who want to track price movements over time.
  3. Dynamic Support and Resistance:
    Just like the standard Indicator line, the Anchored VWAP acts as a dynamic support or resistance line. If the price stays above the Anchored line, it suggests strength in the stock. If it falls below, it signals weakness.
  4. Trend Analysis:
    Anchored VWAP is often used for trend analysis after significant market events. For example, after an earnings announcement, traders might anchor the VWAP from the day of the announcement to see if the stock is trading above or below its average price since then.

Example of Anchored VWAP:

Imagine a stock announces a new product launch, and you want to track its price performance since that announcement. You can "anchor" the VWAP to the day of the announcement. This will give you a custom price line that shows how the stock has been valued (taking volume into account) since that key date, helping you make more informed trading decisions.

Why Is Trading Volume Important in Technical Analysis?

Trading volume plays a key role in technical analysis because it shows the strength behind price movements. Volume tells you how many shares are being traded, helping traders confirm whether price trends are solid or weak.

Key Reasons Why Volume Matters:

  • Confirms Price Trends: A price move with a high volume is considered stronger and more reliable than one with a low volume. For example, an uptrend with a high volume indicates strong buying interest, while a low volume may suggest the trend could reverse.
  • Identifies Breakouts: Volume spikes often occur before major price breakouts, helping traders anticipate when a stock is about to make a significant move.
  • Supports VWAP Analysis: Since the VWAP indicator is volume-weighted, higher volume makes it more accurate in identifying fair prices for the day.
Start Investing - LISPL Investment

VWAP Trading Strategy

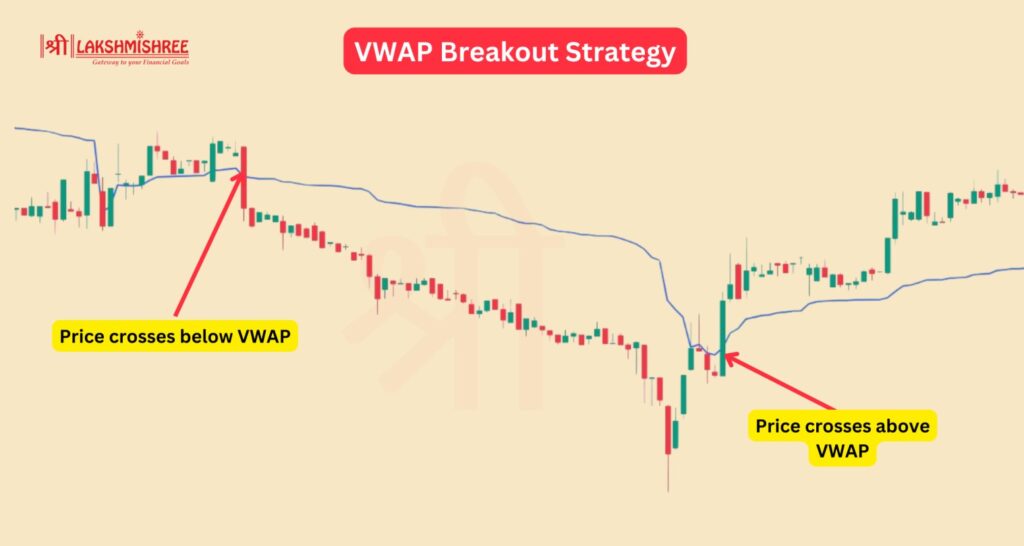
The Volume Weighted Average Price is a versatile tool for intraday trading. Let’s go over three common VWAP trading strategies:

1. VWAP Breakout Strategy

This strategy involves buying or selling when the price breaks above or below the Volume Weighted Average Price line.

  • Go long when the price crosses above VWAP, signalling an uptrend.
  • Go short when the price crosses below VWAP, indicating a downtrend.

Traders often combine this strategy with other momentum indicators, like the MACD, to confirm the strength of the breakout.

VWAP Breakout Strategy

2. VWAP Bounce Strategy

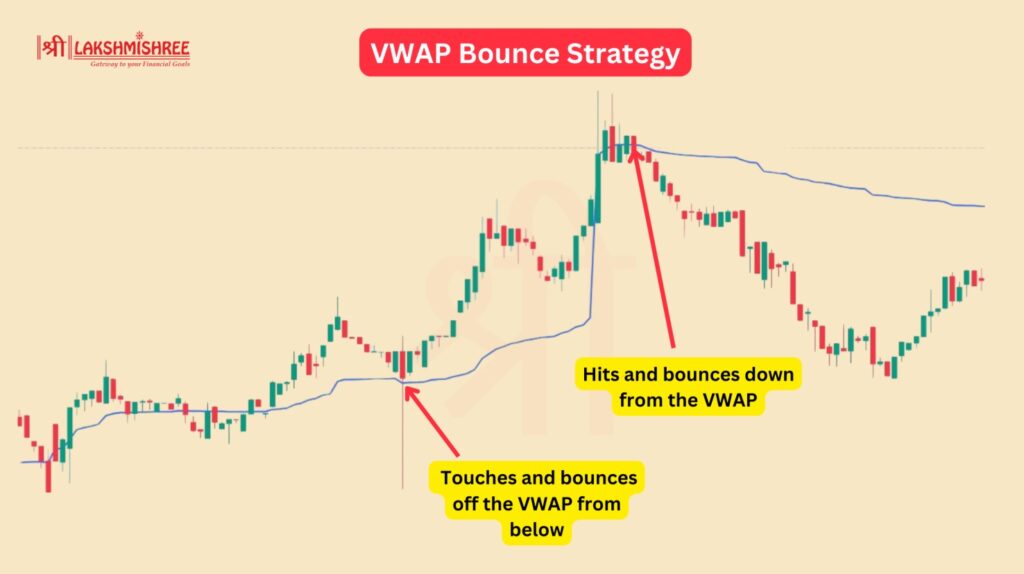
Here, traders use the Indicator line as a dynamic support or resistance level.

  • Buy when the price touches and bounces off the VWAP from below, indicating strength.
  • Sell when the price hits and bounces down from the VWAP, signalling weakness.

This strategy is especially useful in range-bound markets.

VWAP Bounce Strategy

3. VWAP Cross Strategy

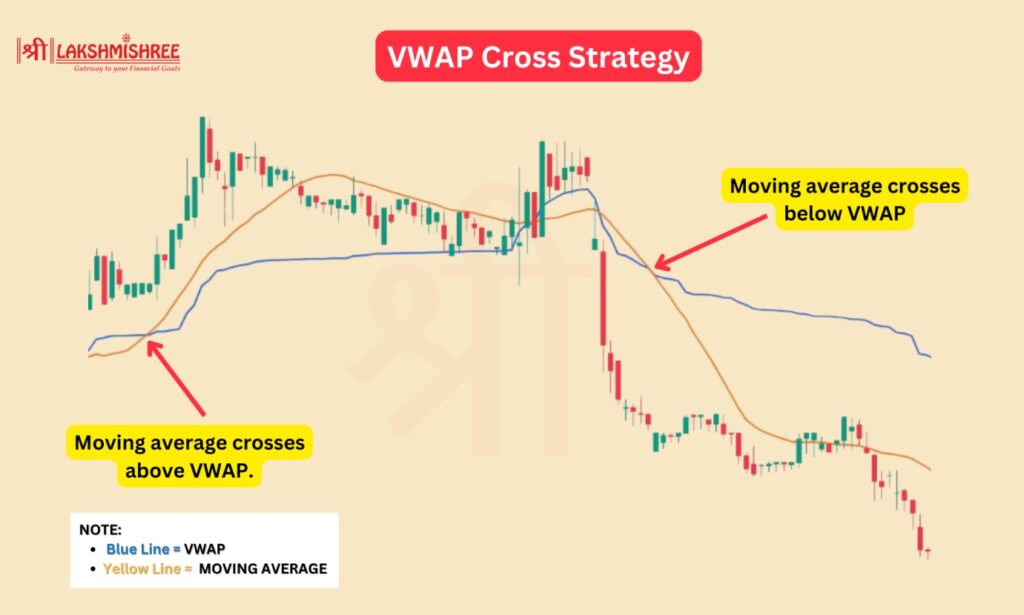
Volume Weighted Average Price crossovers can indicate potential entry or exit points when combined with moving averages.

  • Bullish Cross: Enter long when a short-term moving average crosses above the VWAP Indicator.
  • Bearish Cross: Enter short when the moving average crosses below the VWAP Indicator.
VWAP Cross Strategy

Benefits and Limitations of VWAP

Benefits

  1. Fair Price Benchmark: VWAP provides a true average price, factoring in both price and volume, helping traders assess whether a stock is trading at a fair price.
  2. Dynamic Support/Resistance: It acts as a natural support and resistance level, making spotting potential buy or sell zones easier.
  3. Trend Confirmation: It helps confirm whether a stock is trending upward or downward, making it valuable for traders looking to align with market trends.

Limitations

  1. Lagging Indicator: Based on past data, reacting to fast price movements is slower.
  2. Best for Intraday Trading: Since It resets daily, it’s not effective for swing or long-term trading.
  3. Less Useful in Low-Volume Stocks: It heavily relies on volume data, so the signals can be less reliable in low-volume stocks.

Combining VWAP with Other Technical Indicators

To get the most out of the Volume Weighted Average Price indicator, it’s useful to combine it with other technical indicators:

  • VWAP + Moving Averages: Combining it with short-term or long-term moving averages helps identify stronger trade signals. A crossover of a moving average above or below VWAP can indicate potential buy or sell signals.
  • VWAP + MACD: The MACD is excellent for confirming breakouts. For example, if the stock breaks above VWAP and the MACD, it signals bullish momentum, which strengthens the case for entering a long position.
  • VWAP + RSI: The Relative Strength Index (RSI) helps traders identify overbought or oversold conditions. If a stock is trading below VWAP and the RSI shows oversold conditions, it may be an ideal time to buy.

Conclusion

The VWAP indicator is a highly valuable tool for intraday traders, providing a clear view of a stock’s average price while taking volume into account. It helps identify key support and resistance levels, make better entry and exit decisions, and confirm market trends. While It is best suited for short-term trading, combining it with other indicators like the MACD, RSI, or moving averages can make it even more powerful and reliable.

Frequently Asked Questions

1. What is the full form of the VWAP?

VWAP stands for Volume Weighted Average Price. It shows the average price a stock has traded at throughout the day, adjusted for trading volume.

2. How is VWAP calculated?

The Volume-Weighted Average Price is calculated by multiplying the typical price by the volume and then dividing by the total volume. The formula is: VWAP = (Cumulative (Price * Volume) ÷ (Cumulative Volume)

3. Is VWAP useful for long-term trading?

No, VWAP is primarily an intraday indicator. It resets at the beginning of each trading session and is best used for short-term or day trading.

4. What is the difference between VWAP and moving averages?

VWAP considers both price and volume, while moving averages only consider the price. This makes it more effective at reflecting a stock’s true average price for the day.

5. Can VWAP be used with other indicators?

Yes! VWAP indicator works best when combined with other technical indicators like MACD, RSI, or moving averages to confirm trade signals and improve decision-making.

Disclaimer: This article is intended for educational purposes only. Please note that the data related to the mentioned companies may change over time. The securities referenced are provided as examples and should not be considered as recommendations.

Anshul Jain

Written by Anshul Jain

Anshul Jain is a seasoned Technical Analyst with nearly two decades of experience navigating the Indian stock markets. He leverages his MBA in Finance and SEBI registration to provide insightful analysis and strategic guidance. His proven track record and deep understanding of market dynamics make him a valuable asset in the financial industry.

open-account-ad-2

Social Share

Subscribe to Our Newsletter

Loading
CIN No U74110MH2005PLC157942     |    Member Ship Details     |    BSE-3281     |    NSE-12817     |    MCX-55910     |    DP:IN-DP-CDSL-490-2008     |    DPID:12059100    |    SEBI Regn. No.: INZ000170330     |    Mutual Fund: ARN-77739    |    Research Analyst: registration number INH000014395
logo-lakshmshree-white
Lakshmishree Investment & Securities Ltd. was incorporated in 2005. We are a Corporate Member of NSE, BSE, MCX and Depository Participant with CDSL.
Most Popular in LISPL
Copyright @ 2024 © Lakshmishree Investment & Securities Ltd. All Right Reserved.