Every business needs to track its financial performance, but how do they do it? This is where the trading account format and profit and loss account format comes into play. These statements help determine how much a business earns, spends, and ultimately, how profitable it is.
In this blog, we’ll break down these financial accounts in a simple way. You'll learn what a trading account is, how it works, and how it connects with a profit and loss account to assess a company’s financial health.
A trading account is a financial statement used to determine the gross profit or loss of a business for a given period. It records all direct income and expenses related to buying and selling goods. This account is the first step in preparing the final accounts of a business, and it helps assess how efficiently a company is managing its core trading activities.
Key Features of a Trading Account:
1. Tracks direct income (like sales revenue) and direct expenses (like purchase costs)
2. Helps in calculating gross profit or gross loss
3. Used by businesses, accountants, and investors to analyze financial performance
In accounting, every transaction has two sides – Debit (Dr.) and Credit (Cr.). In a trading account, these terms are used to classify different types of financial activities.
A trading account format consists of various elements that help businesses calculate their gross profit or loss. It includes details of income from sales and the direct costs associated with those sales. The account is divided into two sides – Income (Cr.) side and Expenditure (Dr.) side – to track all relevant transactions.
1. Items of Income (Cr. Side)
These represent the revenue generated from trading activities.
2. Items of Expenditure (Dr. Side)
These are the direct costs incurred to purchase or manufacture goods.
Important Notes
Also Check: 14 Best Investment Options in India 2026: Safe Plans
Gross Profit is the key figure derived from a trading account. It shows a business's profit from selling goods before deducting indirect expenses.
Gross Profit Formula:
Gross Profit=(Sales−Sales Returns)+Closing Stock−(Opening Stock+Purchases−Purchase Returns+Direct Expenses)
Step-by-Step Calculation Example:
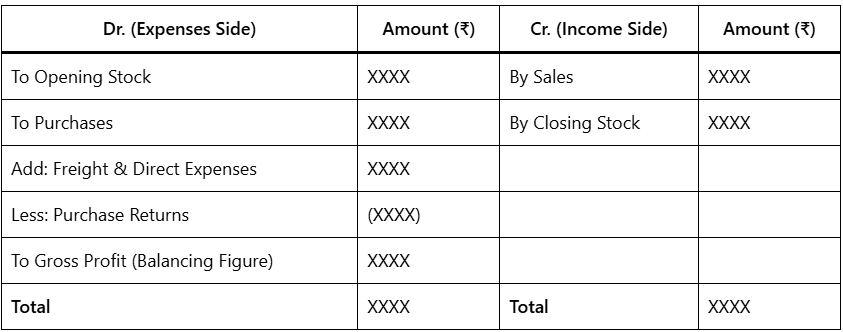
A trading account is prepared to determine the gross profit or loss of a business by recording all direct expenses and revenues related to the purchase and sale of goods. It is usually presented in a T-format, which consists of two sides:
Debit (Dr.) Side: Records all direct expenses, such as opening stock, purchases, and other direct costs.
Credit (Cr.) Side: Includes revenue items, such as total sales and closing stock.
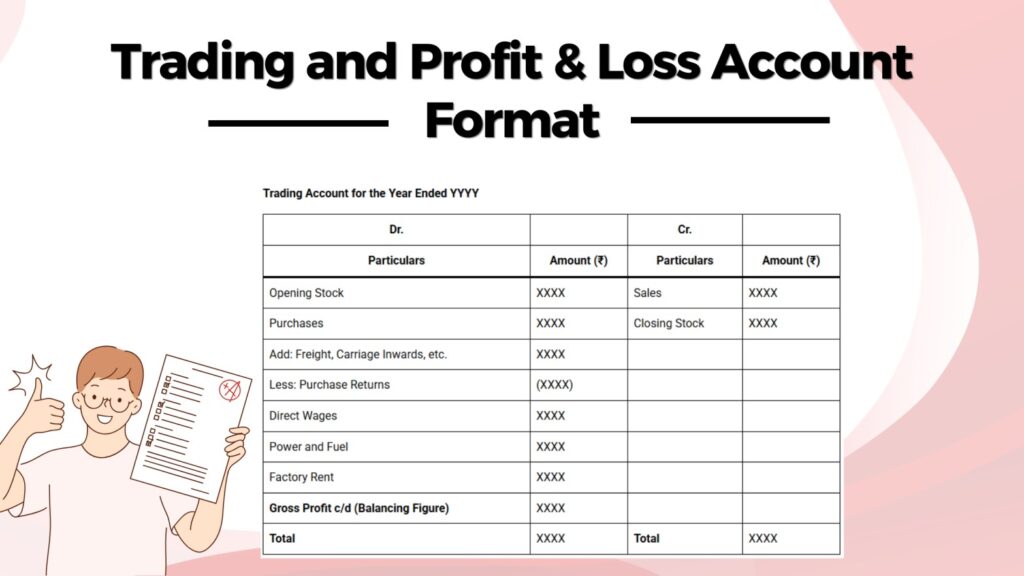
Here’s a standard trading account format Example:
Trading Account for the Year Ended YYYY
| Dr. | Cr. | ||
|---|---|---|---|
| Particulars | Amount (₹) | Particulars | Amount (₹) |
| Opening Stock | XXXX | Sales | XXXX |
| Purchases | XXXX | Closing Stock | XXXX |
| Add: Freight, Carriage Inwards, etc. | XXXX | ||
| Less: Purchase Returns | (XXXX) | ||
| Direct Wages | XXXX | ||
| Power and Fuel | XXXX | ||
| Factory Rent | XXXX | ||
| Gross Profit c/d (Balancing Figure) | XXXX | ||
| Total | XXXX | Total | XXXX |
This format helps in analyzing a company's trading performance before moving on to the profit and loss account. Now, let's look at an example for better clarity.

Let’s take an example to understand how to prepare a trading account with actual figures.
Example: Financial Data of XYZ Traders (as of December 31, 2024)
Now, we will apply these figures in the trading account format:
Trading Account for the Year Ended 31st December 2024
| Dr. | Cr. | ||
|---|---|---|---|
| Particulars | Amount (₹) | Particulars | Amount (₹) |
| Opening Stock | 60,000 | Sales | 3,80,000 |
| Purchases | 2,50,000 | Closing Stock | 85,000 |
| Add: Freight and Wages | 35,000 | ||
| Less: Purchase Returns | (15,000) | ||
| Gross Profit c/d | 1,30,000 | ||
| Total | 4,65,000 | Total | 4,65,000 |
Gross Profit Calculation:
Gross Profit =(Sales+Closing Stock)−(Opening Stock+Purchases−Purchase Returns+Direct Expenses)
Gross Profit =(₹3,80,000+₹85,000)−(₹60,000+₹2,50,000−₹15,000+₹35,000)
Gross Profit =₹4,65,000−₹3,35,000
Gross Profit =₹1,30,000
Thus, XYZ Traders made a Gross Profit of ₹1,30,000 for the year.
A profit and loss account (P&L account) is a financial statement that shows a business’s net profit or loss over a specific period. It summarises all revenues and expenses, helping businesses understand whether they are making money or running at a loss.
This account follows the trading account in the final accounts of a business. While a trading account focuses on gross profit, the profit and loss account takes it further by deducting operating expenses, taxes, and other costs to determine the net profit.
A profit and loss account is divided into two sections:
1. Gross Profit Calculation (Carried from Trading Account)
2. Deduct Indirect Expenses
3. Add Indirect Income
4. Calculate Net Profit or Loss
Net Profit = (Gross Profit + Other Income) - (Operating & Indirect Expenses)
The net profit is then transferred to the capital account in the balance sheet, which helps in future business planning.
A Profit and Loss (P&L) Account summarises a company’s financial performance by listing revenues, expenses, and net profit or loss over a specific period. Here are some of the key components:
A Profit and Loss (P&L) Account is prepared to determine the net profit or loss of a business over a specific period. It follows a T-format, where:
Profit and Loss Account for the Year Ended YYYY
| Dr. (Expenses Side) | Amount (₹) | Cr. (Income Side) | Amount (₹) |
|---|---|---|---|
| To Gross Loss b/d (if any) | XXXX | By Gross Profit b/d (if any) | XXXX |
| To Salaries & Wages | XXXX | By Discount Received | XXXX |
| To Office Rent & Utilities | XXXX | By Commission Earned | XXXX |
| To Printing & Stationery | XXXX | By Interest Received | XXXX |
| To Postage & Telephone | XXXX | By Bad Debts Recovered | XXXX |
| To Insurance | XXXX | By Investment Income | XXXX |
| To Advertising & Promotion | XXXX | By Other Incomes | XXXX |
| To Bad Debts | XXXX | ||
| To Interest on Loans | XXXX | ||
| To Depreciation & Amortisation | XXXX | ||
| To Miscellaneous Expenses | XXXX | ||
| To Net Profit (Balancing Figure) | XXXX | ||
| Total | XXXX | Total | XXXX |
To help you better understand a Profit and Loss (P&L) Account, here’s a simplified breakdown of its key components:
Let's apply this format with an example. Continuing from the Trading Account example, we will calculate the net profit for the year.
Given Data from ABC Traders (as of 31st December 2024)
Profit and Loss Account Example for ABC Traders for the Year Ended 31st December 2024
| Dr. (Expenses Side) | Amount (₹) | Cr. (Income Side) | Amount (₹) |
|---|---|---|---|
| To Salaries & Wages | 20,000 | By Gross Profit b/d | 1,00,000 |
| To Office Rent & Utilities | 10,000 | By Discount Received | 5,000 |
| To Printing & Stationery | 3,000 | By Commission Earned | 4,000 |
| To Postage & Telephone | 2,000 | By Interest Received | 3,000 |
| To Advertising & Promotion | 5,000 | By Bad Debts Recovered | 2,000 |
| To Bad Debts | 4,000 | ||
| To Interest on Loans | 6,000 | ||
| To Depreciation & Amortisation | 8,000 | ||
| To Miscellaneous Expenses | 2,000 | ||
| To Net Profit (Balancing Figure) | 50,000 | ||
| Total | 1,10,000 | Total | 1,10,000 |
Net Profit Calculation
Net Profit= Total Income−Total Expenses
Net Profit= 1,00,000+5,000+4,000+3,000+2,000)−(20,000+10,000+3,000+2,000+5,000+4,000+6,000+8,000+2,000)
Net Profit= 1,14,000 - 64,000
Net Profit= ₹50,000
A Trading Account and a Profit and Loss Account serve different purposes in financial reporting. While a Trading Account determines the gross profit or loss from buying and selling goods, the Profit and Loss Account calculates the net profit or loss after deducting operating expenses and other financial costs.
| Basis | Trading Account | Profit and Loss Account |
|---|---|---|
| Purpose | Determines gross profit/loss | Calculates net profit/loss after all expenses |
| Records | Direct expenses (e.g., purchases, wages, freight) | Indirect expenses (e.g., salaries, rent, depreciation) |
| Components | Sales, Purchases, Closing Stock, Direct Costs | Operating Expenses, Other Income, Taxes, Net Profit |
| Balance Transfer | Gross profit/loss is transferred to P&L Account | Net profit/loss is transferred to Capital Account |
| Position in Accounts | Prepared before the Profit & Loss Account | Prepared after the Trading Account |
| Focus Area | Cost of goods sold (COGS) & gross profitability | Overall financial performance & net earnings |
A Memorandum Trading Account is a non-official internal document businesses use to determine profitability before preparing formal financial statements.
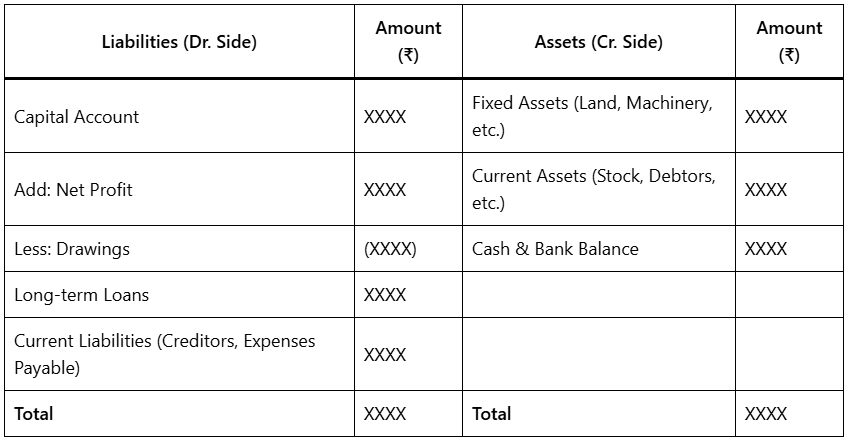
A Balance Sheet is part of financial statements that determine the financial position of a business at the end of an accounting period. It includes assets, liabilities, and equity, showcasing the company’s net worth.
A trading and profit and loss account format is an essential financial tool that helps businesses measure their revenue, expenses, and overall profitability. It plays a vital role in tracking financial performance and making informed business decisions. By maintaining a well-structured P&L account, companies can improve cost management and financial transparency. A strong grasp of profit and loss accounting leads to smarter financial management and long-term success.
The profit and loss account format follows a structured approach where income and expenses are recorded to determine net profit or loss. It consists of revenue, cost of goods sold (COGS), operating expenses, and net profit. This format helps businesses track financial performance and make informed decisions.
To prepare a profit and loss account, start by listing total revenue, then subtract COGS to calculate gross profit. Deduct all operating expenses, taxes, and other costs to determine net profit or loss. A well-prepared P&L statement gives insights into business profitability and financial health.
A trading and profit and loss account format includes two sections: the trading account, which calculates gross profit, and the P&L account, which determines net profit. The trading account records direct incomes and expenses, while the profit and loss account includes operating costs and other indirect expenses.
A balance sheet complements the trading account by showing a company’s financial position at a specific time. While the trading account records income and direct expenses, the balance sheet lists assets, liabilities, and equity, offering a broader financial perspective.
A trading account focuses on direct revenues and expenses, helping determine gross profit, while a profit and loss account includes operating expenses and taxes to calculate net profit. The trading account assesses business efficiency, whereas the P&L account provides a complete financial summary.
A balance sheet complements the trading account by showing a company’s financial position at a specific time. While the trading account records income and direct expenses, the balance sheet lists assets, liabilities, and equity, offering a broader financial perspective.
Disclaimer: This article is for educational purposes only and should not be considered financial advice. Always conduct your research and consider consulting with a financial advisor before making any investment decisions.
