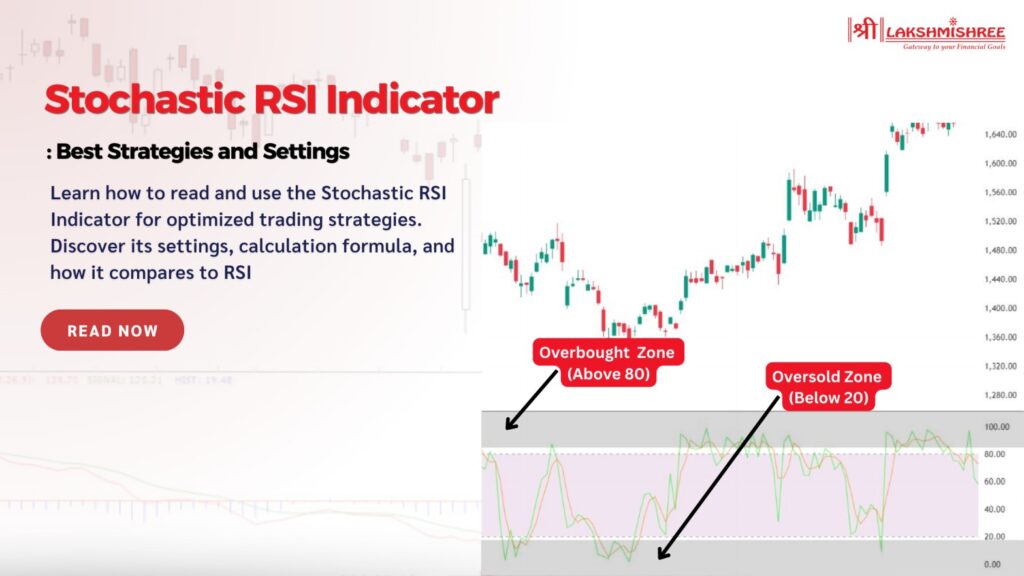
When it comes to trading and investing, there are so many tools out there it’s easy to feel overwhelmed. You might have heard of popular indicators like the RSI (Relative Strength Index) or the Stochastic Oscillator, but maybe you’re looking for something that combines both strengths. That’s where the Stochastic RSI Indicator steps in – a powerful tool that helps you spot trends, identify reversals, and time your trades with greater precision.
In this guide, we’ll walk you through everything you need to know about the Stoch RSI, from understanding its settings to using it in real-world strategies.
The Stochastic RSI Indicator is a unique blend of popular technical analysis tools: the Relative Strength Index (RSI) and the Stochastic Oscillator. While the traditional RSI measures the speed and change of price movements, the Stoch RSI adds another layer by calculating the RSI’s own position relative to its range. Simply, it tells you whether a stock or asset is overbought or oversold and how strong the momentum is in those zones.
This combination can be especially helpful for traders who want a more sensitive tool that responds faster to price changes. Using the indicator, you can get earlier signals of potential reversals or trend continuations, giving you an extra edge when making buy or sell decisions.
The Stoch RSI Indicator might initially sound complicated, but it’s pretty straightforward once you understand its signals. Unlike the regular RSI, which measures the price momentum of a stock or asset, the Stoch RSI focuses on the RSI’s own movements. It tells you whether the RSI itself is "overbought" or "oversold," providing a more sensitive view of market conditions.
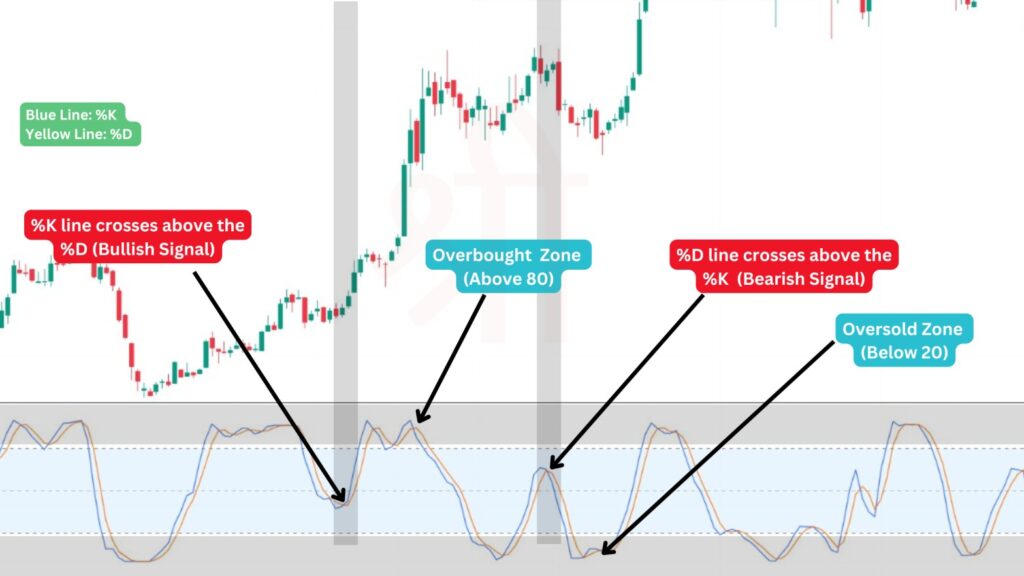
The indicator ranges from 0 to 100. Here’s what the key levels mean:
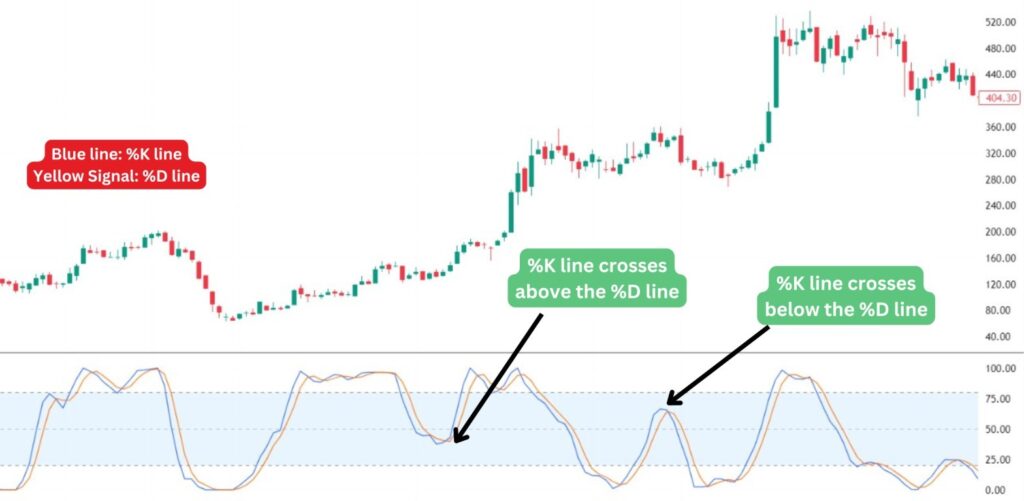
One of the best ways to read the Stochastic RSI is by watching for crossovers. The indicator has two lines – %K and %D – which represent two different moving averages of the RSI. When the %K line crosses above the %D line, it can signal a potential buying opportunity, especially if this crossover happens when the value is in the oversold zone (below 20). Conversely, if the %K line crosses below the %D line in the overbought zone (above 80), it might be a signal to consider selling.
The Stoch RSI is calculated in two main steps:
Here, the Lowest RSI and Highest RSI refer to the lowest and highest RSI values over a specific period (usually 14 days). This formula scales the RSI to 0 and 1, or 0 to 100 if multiplied by 100.
Let’s dive into three popular trading strategies to help you maximise this indicator: Identifying Overbought/Oversold conditions, Divergence Trading, and Trading Crossovers.
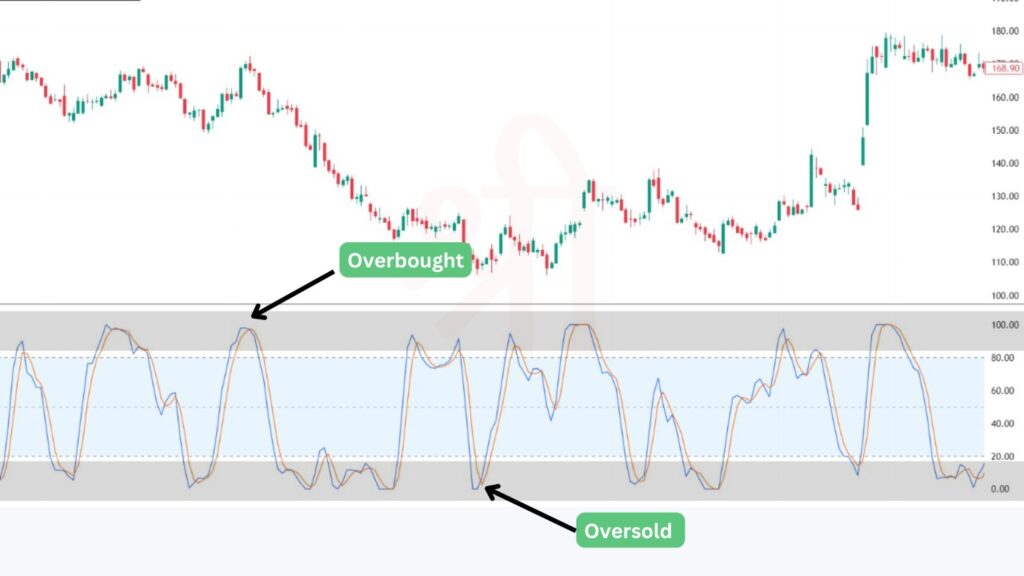
One of the main ways traders use the Stoch RSI is to detect when an asset might be "overbought" or "oversold." Here’s what that means:
By watching for these extreme levels, traders can spot potential reversal points. However, using this method cautiously is essential, as overbought or oversold signals alone don’t guarantee a reversal. They simply indicate that a trend might be losing strength, which could present an opportunity if other indicators or patterns confirm it.
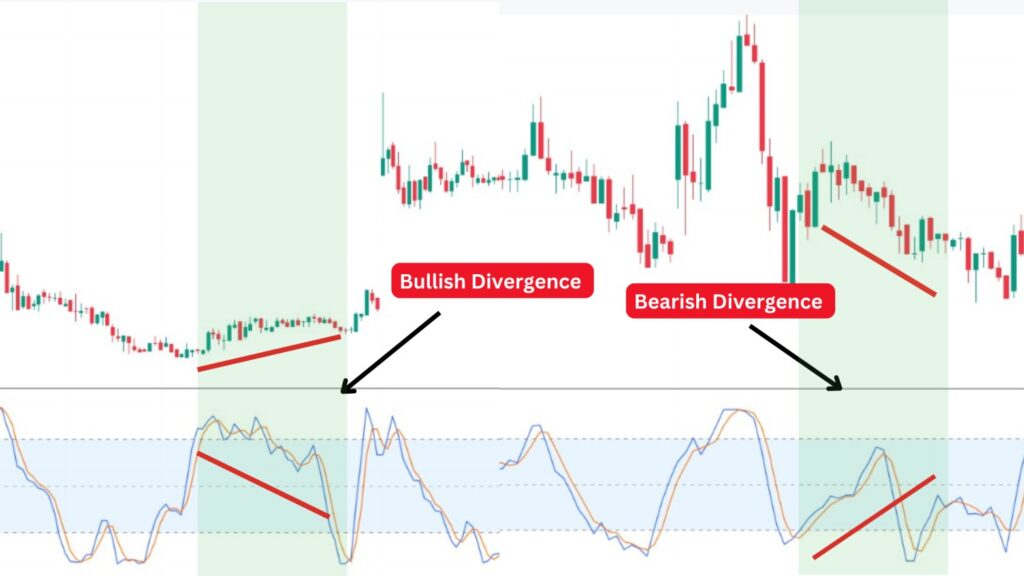
Divergence trading is a powerful technique, and the indicator can make it even more effective by providing early warnings of potential trend reversals. A divergence occurs when the direction of the Stochastic RSI differs from the price trend, signalling that momentum might be shifting.
Another popular Stochastic RSI strategy involves trading based on crossovers between the %K line (the faster-moving line) and the %D line (the slower-moving signal line). Crossovers can indicate potential buy or sell signals, depending on their direction and where they occur.
The standard Stochastic RSI settings are typically set to a 14-period lookback with three additional parameters: %K (often set to 3), %D (a smoothing parameter, usually set to 3), and the RSI length (typically 14).
Here’s a breakdown of these key settings:
The RSI (Relative Strength Index) and the Stochastic Oscillator are both popular momentum indicators. They serve slightly different purposes and work best in different situations.
When to Use Each:
The RSI is generally more effective in trending markets, which helps confirm an ongoing trend's strength. Meanwhile, the Stochastic Oscillator tends to work better in range-bound or sideways markets, where it can highlight potential reversal points as the price oscillates between support and resistance levels. Understanding the nuances between RSI vs. Stochastic allows traders to pick the right tool based on market conditions, enhancing their strategy's accuracy.
The RSI tends to work best in trending markets, while with the Stochastic Oscillator, one can confirm the strength of a continuing trend. It works best in range-bound or sideways markets since this oscillator can pinpoint reversal levels when the price oscillates between areas of support and resistance. Knowing the subtleties between RSI versus Stochastic enables traders to choose the right tool given the market conditions, thereby enhancing their strategy's precision.
Using the Indicator alone can be insightful, but combining it with other indicators can provide stronger signals and improve decision-making.
While the Stochastic Oscillator and the Stochastic RSI share similarities, they are distinct indicators with different applications.
Key Difference: The Stochastic Oscillator is directly based on price, while the Stochastic RSI is based on the RSI, making it more volatile and sensitive. Traders who need quicker signals may prefer the Stoch RSI, while those focused on broader trends might stick to the Stochastic Oscillator.
The Stochastic RSI Indicator is a powerful tool that combines the strengths of both the RSI and the Stochastic Oscillator, providing traders with a more sensitive approach to identifying overbought and oversold conditions. By using this indicator strategically, traders can gain early insights into potential trend reversals and fine-tune their entry and exit points.
However, like any indicator, the Stoch RSI works best when used alongside other tools and technical analysis methods.
The two lines in the Stochastic RSI are the %K line (fast-moving line) and the %D line (signal line). The %K line tracks the actual Stoch RSI values, while the %D line is a moving average of %K, helping to smooth out the signals.
The Stochastic RSI indicates whether the RSI itself is overbought or oversold. It ranges between 0 and 1 (or 0 to 100), helping traders spot potential reversal points in momentum faster than using the standard RSI.
Both have their strengths; RSI is generally better for broader trend analysis, while the Stochastic RSI is more sensitive, providing quicker signals. The choice depends on your trading style and market conditions.
A potential buy signal occurs when the Stoch RSI dips below 0.2 (oversold) and then rises, indicating a possible trend reversal. Confirming this signal with other indicators can improve accuracy.
This setting refers to a 14-period RSI with a 14-period Stochastic calculation and a 3-period %K and 3-period %D. This is a common setup, providing balanced sensitivity without excessive "noise."
Yes, the Stochastic RSI is suitable for intraday trading as it’s highly responsive to price changes. Traders often use it on shorter timeframes to identify quick entry and exit points, but combining it with other indicators is recommended for confirmation.
Disclaimer: This article is intended for educational purposes only. Please note that the data related to the mentioned companies may change over time. The securities referenced are provided as examples and should not be considered as recommendations