Ever wondered how some traders seem to have a sixth sense about market movements? They might just be using price action trading. This powerful technique relies on directly reading price movements and patterns from charts without the clutter of indicators. By focusing on the purest form of market data, traders can make informed decisions based on the actual price behaviour. Curious to dive into the world of price action trading?
Let's discuss how understanding these price movements can transform your trading strategy and help you confidently navigate the markets.
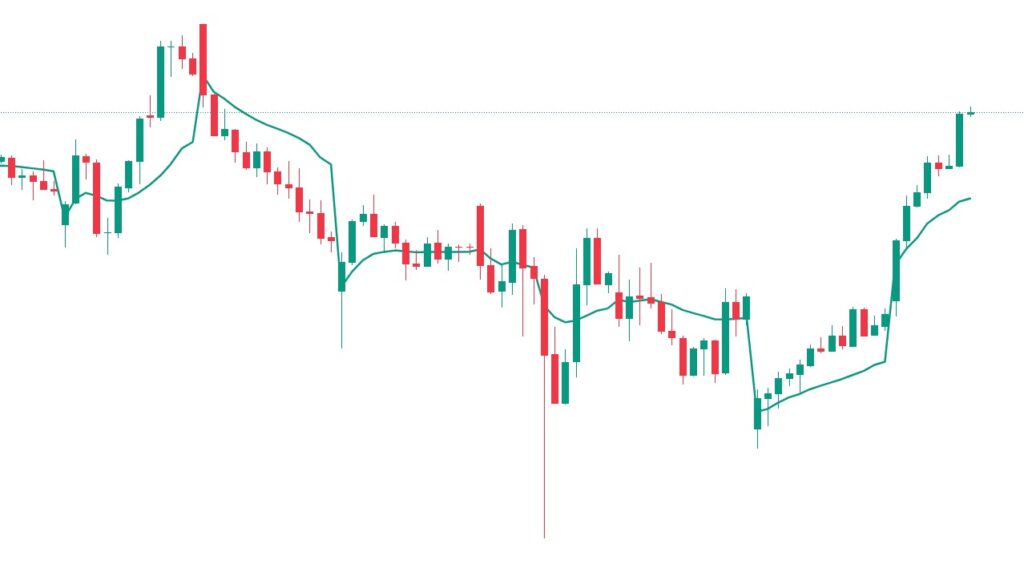
Price action in the share market refers to the movement of a stock's price plotted over time. It's the foundation upon which traders build their strategies. Unlike other indicator-heavy trading methods, price action brings to light what the market is doing from its chart and patterns. This approach helps traders make decisions based on live data and captures the essence of market psychology. Be it a bullish trend or a bearish reversal, price action will help the trader decipher the exact conditions of the market.
Price action trading is a trading methodology based on the actual price changes of a security. The trader looks at a price chart and, from its analysis, identifies patterns and trends to project future price movements without indicators. By only dealing with price behaviour, one removes other possible noises that may blind a trader from the true direction the market is taking. This technique comes in simple and effective and, therefore, very popular even among beginners.
“History repeats itself in the markets; the past is a map for future price action”
Essentially, price action trading means studying past price data to forecast future market moves. Traders look at various chart patterns and candlestick formations to find opportunities and potential reversals. This approach requires a sharp eye and a good understanding of market psychology; traders must look for small hints in price changes that can show possible shifts in the market's direction. Whether it’s spotting a bullish pattern or identifying a double top, price action trading offers a solid method for making informed trading decisions.
Price action analysis helps traders get insight into the dynamics of the market in-depth. It aids traders in discovering prominent support and resistance levels, with which price tends to pause or reverse. Besides, these are critical factors regarding entry and exit in a trade. Price action underlines no trading zones—the zone at which the market is indecisive, and it is best to avoid taking positions.
Price action provides several insights:
Moreover, one can project in advance consolidation periods before a breakout due to sideways movement observation.
This price action further gives the market swings to the higher or lower side in the strength of a trend. Prices in an up-trending market are making higher swing highs and higher swing lows, while lower swing highs and lower swing lows define the down line.
Price action trading is popular among various types of traders, each using it to their advantage in different ways:
Each of these traders leverages price action trading to fit their specific trading style, benefiting from the clear insights it provides into market trends and movements.
Price action trading is not a one-size-fits-all methodology. It differs altogether while considering chart patterns, trading volumes, and overall market conditions. Basically, it means to analyze the raw price data without indicators. Swing traders and trend traders have adopted this approach with an eye on support and resistance lines to establish breakouts and consolidations.
To trade effectively with price action, consider the chart price movements first. Identify critical levels at which the price stopped and/or turned earlier. These are your support and resistance zones. Then, take into account the volume of trades at such levels. High volume near support and resistance can confirm the strength of these levels and indicate possible breakouts or reversals.
The image below is a chart with very clear support and resistance levels:
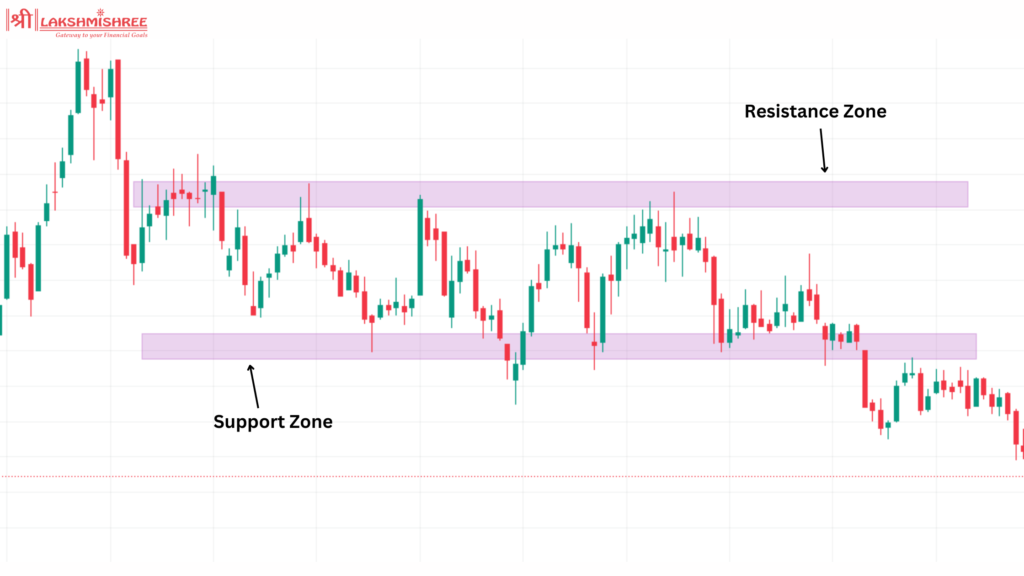
In this chart, notice how the price repeatedly bounces off the support level (marked by a horizontal line at the bottom). This indicates a strong support zone, where buying pressure prevents the price from falling further. Similarly, the price repeatedly hits the resistance level (marked by a horizontal line at the top) and then falls back, showing a strong resistance zone where selling pressure prevents the price from rising further.
When starting with price action trading, it's important to decide on your trading style. Here are three key approaches:

Definition and Examples: The flag and pole pattern is a continuation pattern often seen in strong trending markets. It starts with a sharp price movement (the pole), followed by a consolidation phase (the flag) that moves counter to the pole. This pattern suggests that the price will break out in the initial trend's direction after the consolidation period.
For example, in the chart below, the flag and pole pattern forms with three upper side moves and then breaks down to the upper side, indicating a continuation of the bullish trend. The traders can use this pattern in order to enter trades at a zone or for the identification of possible reversals.
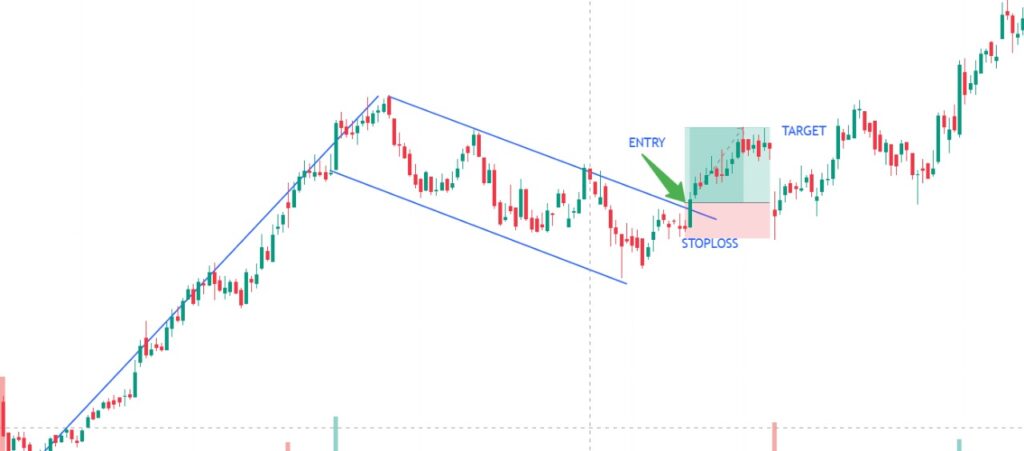
Stop-Loss and Target (Risk: Reward Ratio 1:2): To manage risk, set your stop-loss below the flag's low in an uptrend, while in a downtrend, place a stop above the flag's high. Usually, it is placed such that the target price is equal to the length of the pole; thus, giving you a potential reward that is twice your risk.
Definition and Examples: The cup and handle pattern is one of the bullish continuation patterns. It looks like a teacup on the chart. The price makes a bottom of a rounded type, which forms the cup. This gets formed by a smaller consolidation phase or a pullback that creates a handle. That's what the pattern says—a probable upside breakout.
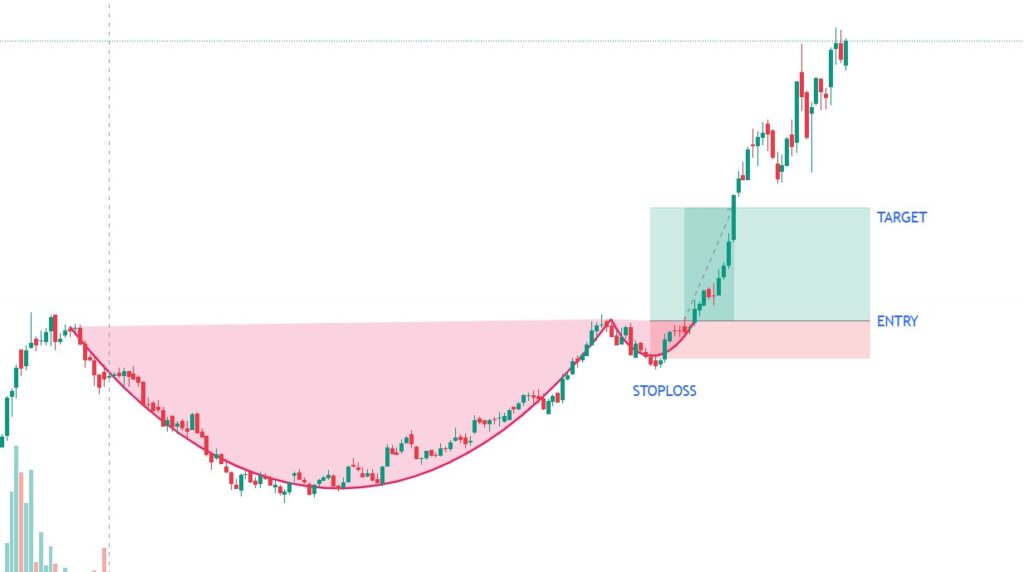
Stop-Loss and Target (Risk: Reward Ratio 1:3): It has a 1:3 risk-reward ratio. Place your stop-loss below the handle's low. The target price is usually measured by the depth of the cup that is added to the breakout point, giving you a risk-reward ratio of 1:3.
Check out our comprehensive guide on Cup and Handle Trading for a more detailed analysis and examples of trading the cup and handle pattern.
Definition and Examples: The double bottom is a reversal pattern and is considered bullish. It occurs after a downtrend has taken place. Visually, it looks like two prominent lows occurring around the same price, thus showing very strong support. This pattern indicates that the price is due to reverse and move higher.
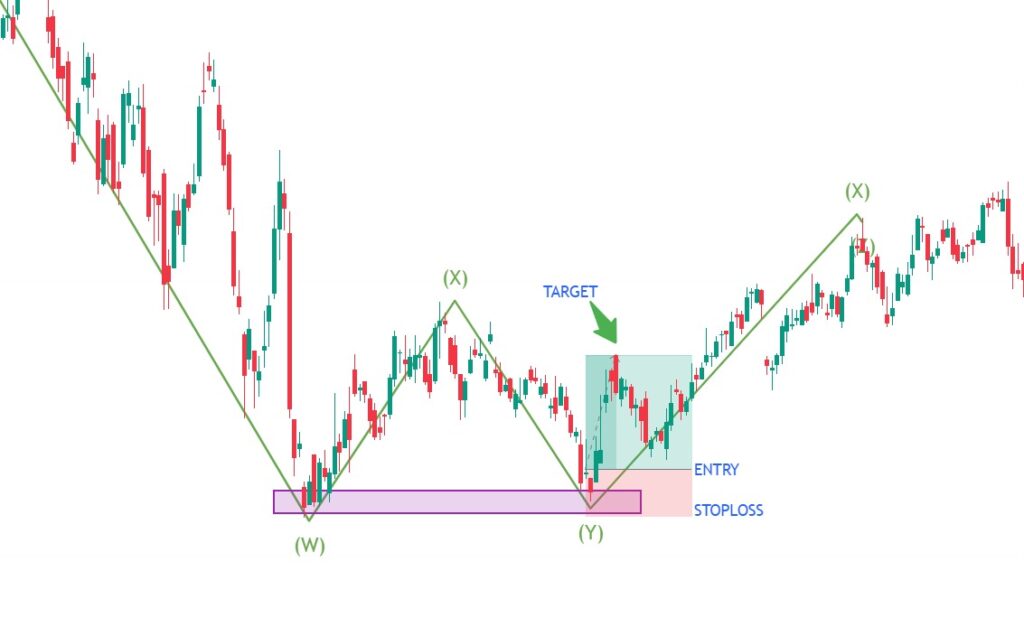
Stop-Loss and Target (Risk: Reward Ratio 1:2): Set the stop-loss below the second bottom. Generally, the width from the bottoms to the neckline gets projected above the point of breakout with an eye toward attaining a 1:2 ratio for risk-reward.
Definition and Examples: The double-top pattern is normally a bearish reversal pattern appearing after an uptrend. It forms two peaks around one particular significant level, thus showing very strong resistance. This means that the price may reverse and move lower.
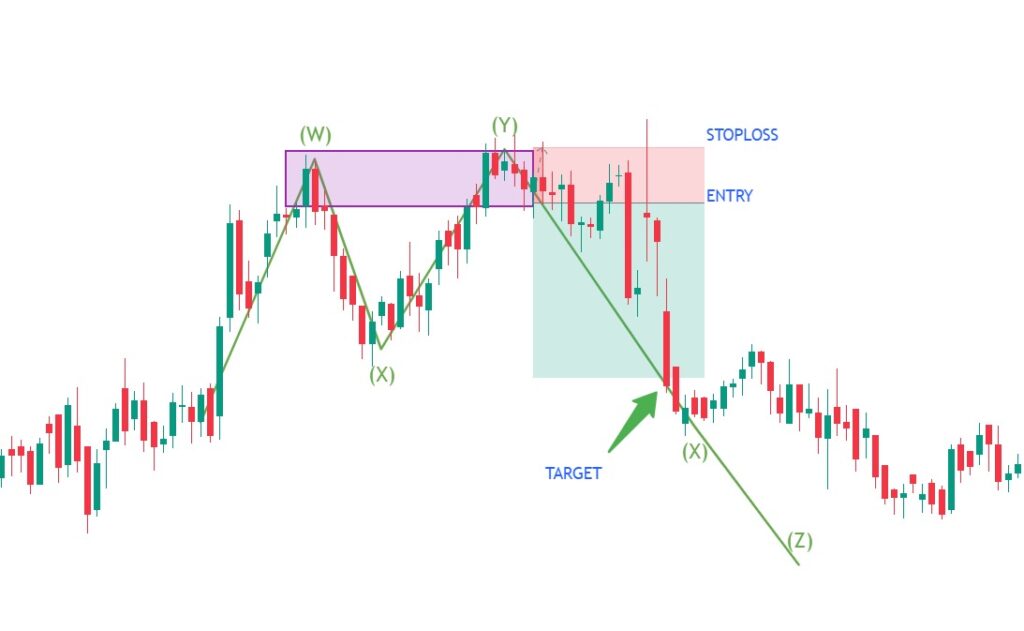
Stop-Loss and Target (Risk: Reward Ratio 1:3): Place a stop-loss above the second top to protect your position. The target price is usually the distance from the tops to the neckline, applied below the breakout point, providing a 1:3 risk-reward ratio.
While most price action traders simply use the raw price swings, some do incorporate indicators to confirm entry, stop-loss, and target levels. Indicators can help reinforce the idea that what one is seeing in price action is correct. Here are three popular indicators that work well with price action trading:
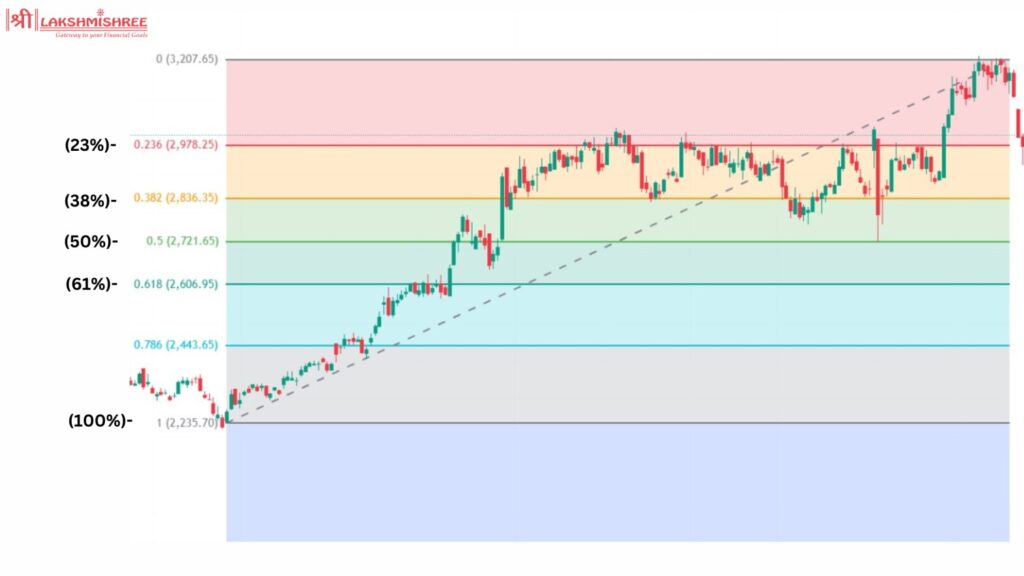
1. Fibonacci Retracements for Support and Resistance
Fibonacci retracements are drawn from a low to a high in an uptrend, or a high to low in a downtrend. They highlight potential pullback levels at 23.6%, 38.2%, 50%, 61.8%, and 100%. In strong trends, pullbacks are usually shallow, often reaching only the 38.2% level. However, it’s common for pullbacks to exceed the 50% and 61.8% levels in most trends. These levels help traders identify where the price might reverse, providing a good basis for setting entry and stop-loss points.
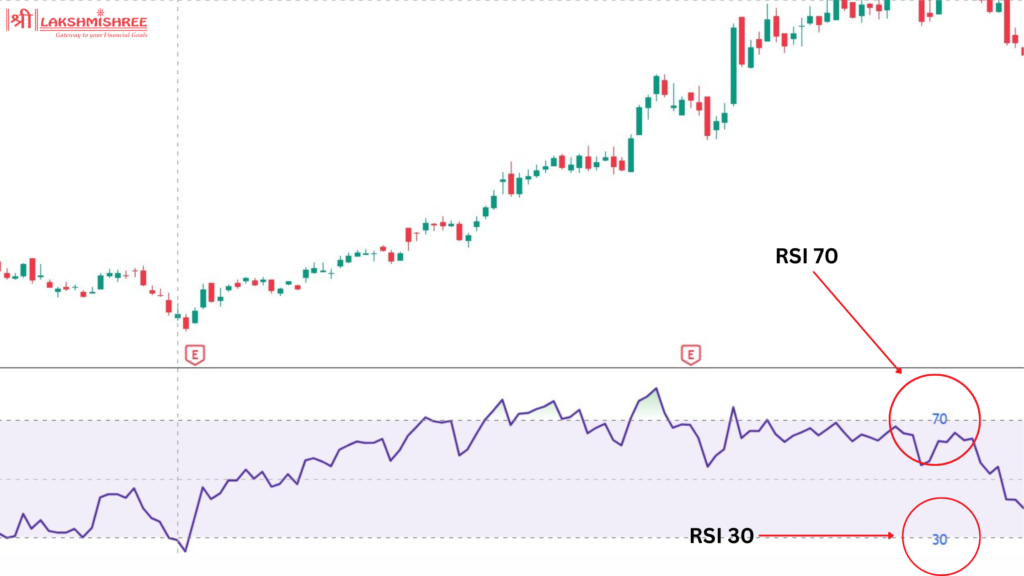
2. Relative Strength Index (RSI) for Momentum
The RSI measures the price's position within its 14-period price range. When the RSI is above 70%, the price is in the upper realm of its range, which signifies overbought conditions. On the other hand, an RSI below 30% indicates oversold conditions. Traders can further utilize RSI to confirm price action signals. For instance, in an uptrend, they would look to buy when the RSI moves below 30 and then rises above it, thus confirming a price action signal.
3. Volume Weighted Average Price (VWAP)
The VWAP indicator indicates the average price security trades for during a day, considering both volume and price. VWAP is useful in helping traders identify the true average price, which then becomes a benchmark for intraday trading. It is useful in spotting trend confirmations and getting entry and exit points correct. If the price is above VWAP, the sentiment of the market generally is bullish, while if it is below VWAP, then it is bearish.
These indicators are valuable tools for enhancing your price action trading strategy. They provide confirmation for what you observe in the price action, helping to validate your trading decisions. For a more comprehensive list of indicators and how to use them, check out our detailed blog on the Best Technical Indicators for trading.
Price action reading includes the analysis of price movements over some time. It is usually displayed on bar charts or line charts. The main aim is to establish the direction of price and volume, which sustains such movement. The money is moving up with rising volume—this means there's tremendous conviction in the market since people are investing at higher prices. This combination suggests a bullish trend and a potential continuation of the upward movement.
On the other hand, if the price is going up but the volume is thin, then one cannot rely on the price action. If the volume is light, that means few investors are participating, so such movement in price can never be convincing and may not be sustainable either. Looking closely at both price direction and volume, a trader has a better view of the strength of the trend and consequently makes better trading decisions.
A stock screener is a tool that filters stocks based on specific criteria such as price, volume, and financial ratios. It helps traders quickly narrow down a vast market to a manageable list of potential trades. Price action trading, on the other hand, involves analyzing price movements and patterns directly from charts to make trading decisions.
Price Action:
Stock Screener:
Combining both approaches can enhance trading strategies. Use a stock screener to identify potential trades quickly, and then apply price action analysis to refine entry and exit points.
1. Secrets of a Pivot Boss: Revealing Proven Methods for Profiting in the Market
2. How to Make Money Trading with Charts
3. Price Action Trading Secrets: Trading Strategies, Tools, and Techniques to Help You Become a Consistently Profitable Trader
4. Trading Price Action Reversals: Technical Analysis of Price Charts Bar by Bar for the Serious Trader
5. Trading in the Zone: Master the Market with Confidence, Discipline, and a Winning Attitude
Price action trading is a powerful approach for understanding market movements by focusing on price patterns and trends. While it has limitations, its simplicity and effectiveness make it a valuable tool for traders. You can enhance your strategy and make more informed decisions by incorporating additional elements like volume and complementary indicators. Keep learning and stay disciplined to navigate the markets using price action trading confidently.
Yes, price action trading can be profitable if done correctly. Traders can make informed decisions and identify high-probability trading opportunities by focusing on price movements and patterns. However, like any trading strategy, success depends on the trader's skill, discipline, and experience.
Price action is not calculated in the traditional sense. Instead, it involves analyzing historical price movements on charts to identify patterns, trends, support, and resistance levels. Traders use this analysis to predict future price movements and make trading decisions.
There is no single "best" indicator for price action trading, as it depends on individual preferences and strategies. Popular indicators that complement price action include Fibonacci retracements, Relative Strength Index (RSI), and Volume Weighted Average Price (VWAP).
While it is impossible to predict price action with 100% accuracy, skilled traders can use price action analysis to identify high-probability trade setups. By understanding patterns and market psychology, traders can make educated guesses about future price movements.
The key components of price action trading include analyzing price charts, identifying support and resistance levels, recognizing patterns (such as candlestick patterns), and understanding market trends and sentiment. Volume analysis is also often used to confirm price movements.
Volume plays a crucial role in price action trading as it confirms the strength of price movements. High volume near support or resistance levels indicates strong buying or selling pressure, respectively, and can signal potential breakouts or reversals. Low volume may suggest weak conviction and unreliable price movements.
Disclaimer: This article is for educational purposes only and should not be considered financial advice. Always conduct your research and consider consulting with a financial advisor before making any investment decisions.

