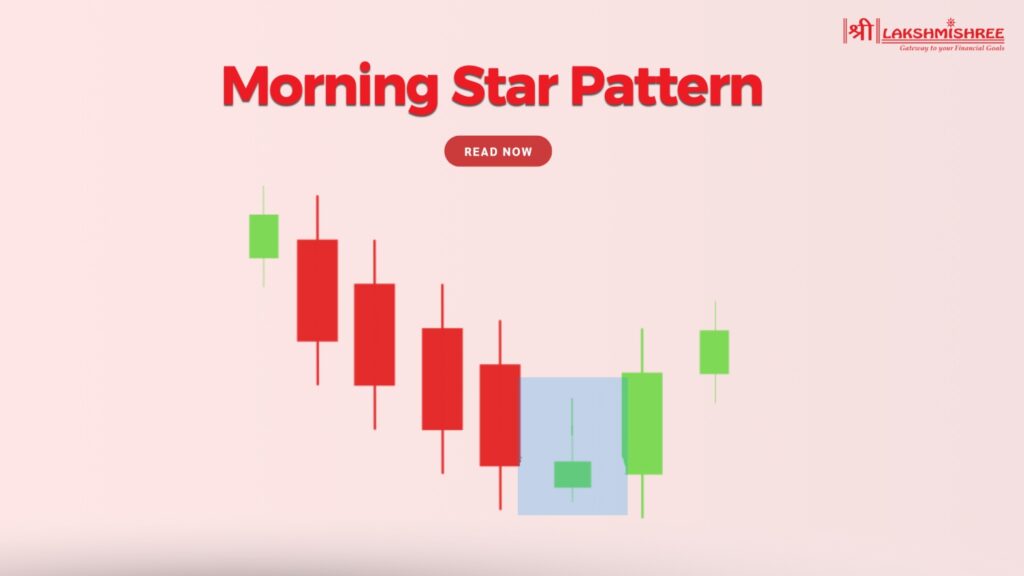
In trading, recognising the right patterns can make a big difference in making good decisions. One such important pattern is the Morning Star Pattern, which helps traders understand when the market might change direction—from going down to going up.
So why do traders in stocks and crypto trust the Morning Star Candlestick Pattern? Because it tells the story of fear, hesitation and finally hope as buyers take control. Whether you are new to trading or looking to improve your skills, learning about this pattern can help you take better trades. Let’s explore its structure, variations like the Morning Doji Star, and how you can use it effectively.
The Morning Star Pattern is a bullish pattern that signals a downtrend's end and an uptrend's start. Found at the bottom of a falling market, this pattern consists of three candles, each telling a story. The first candle, a long red one, shows strong bearish momentum and sellers are in control. The second candle, a small one, often a Doji, is market indecision. The third candle, a long green one, is a change of sentiment showing buyers are taking over, and the price is increasing.
The Morning Star Candlestick Pattern is considered a reversal signal because it shows the change of power from sellers to buyers. It allows you to find turning points in markets like stocks, forex or crypto. By knowing this pattern you can make better decisions and enter trades early in the trend reversal.
Three candles make up the Morning Star Pattern, each one important in signalling a reversal from bearish to bullish momentum. Let’s get into it:
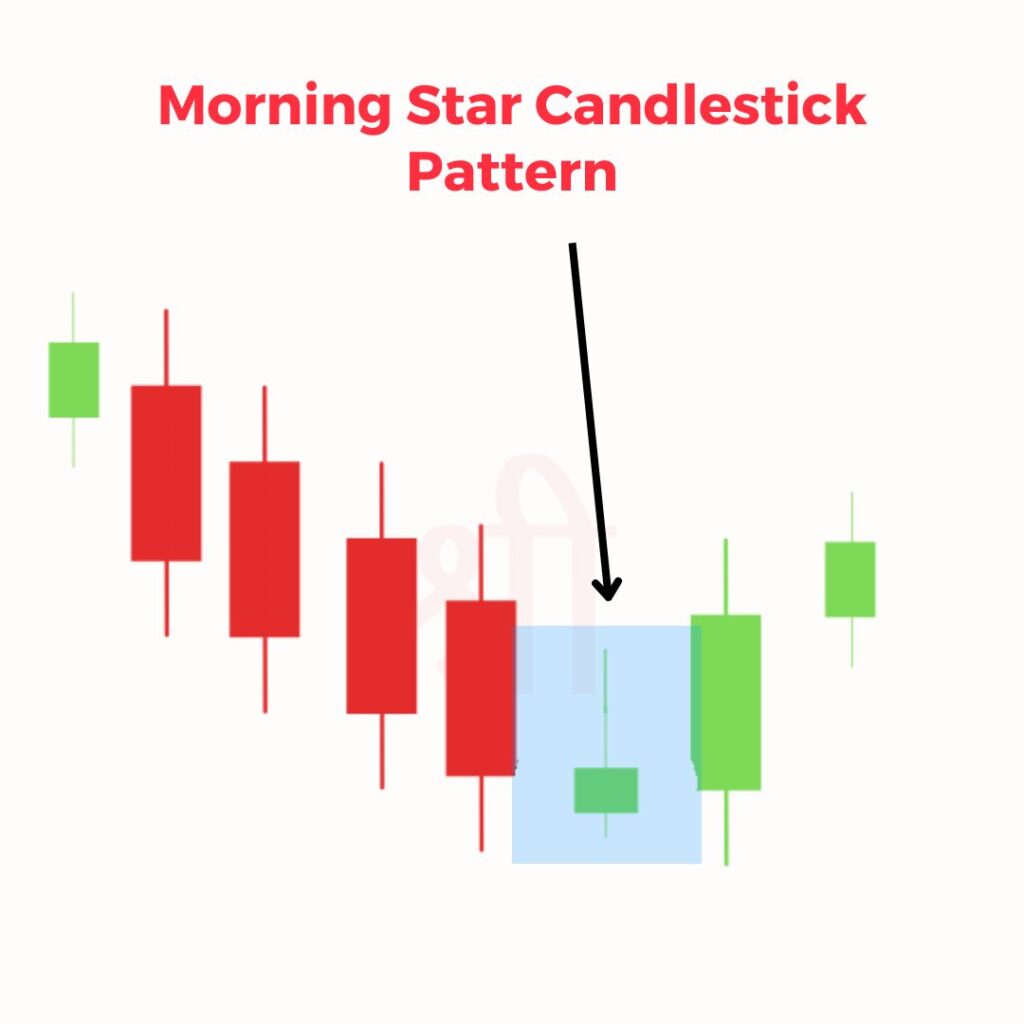
For this pattern to be valid, the green candle must close at least halfway into the body of the first red candle And the middle candle’s gap (below the first candle and above the third candle) is the icing on the cake and makes the pattern more robust.
The structure of the Morning Star Candlestick Pattern offers traders a visual story of the market's transition from bearish pessimism to bullish optimism.
Trading the Morning Star Candlestick Pattern is a combination of technical analysis with discipline and risk management. Follow these steps to get the most out of this reversal signal:
1. See the Pattern Clearly
Firstly see the Morning Star Pattern in a downtrend. Look for:
2. Check the Context
Before you get in the trade check for additional confirmations:
3. Wait for Confirmation
Be patient, Wait for the price to break above the high of the third candle to confirm bullish momentum. A breakout with increasing volume is even more confirmation. Don’t get in too early; false breakouts can happen in weak markets.
4. Get In Long
Once confirmed get in long with a plan:
5. Manage Risk
Risk management is key to long term success:
The Morning Star Pattern is a big shift in market sentiment so it’s fascinating from a technical and emotional perspective. It’s a tug of war between the bears and the bulls and gives us insight into the state of mind of the market participants.
This emotional journey – fear to hope – is why the Morning Star is a reliable bullish reversal signal. By understanding the crowd psychology behind this pattern, traders can make better decisions and anticipate reversals more confidently. Don’t forget to pair this with volume spikes.
The Morning Doji Star Pattern is a variation of the Morning Star Pattern and is an even stronger signal of a reversal. 3 candles form it and appear at the bottom of a trend where the sellers lose control of the buyers. The middle candle is a Doji, meaning the market is indecisive.
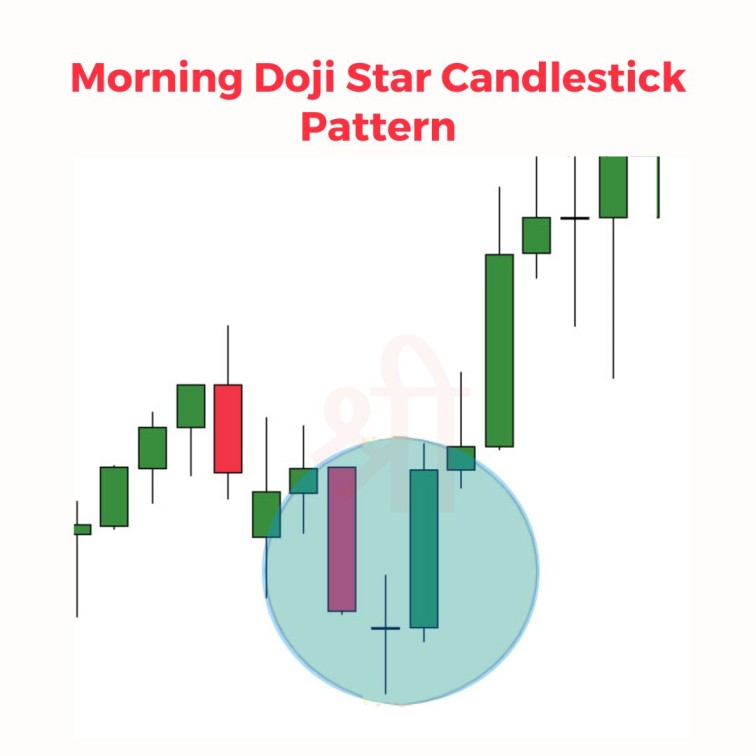
Here’s how it looks:
What makes the Morning Doji Star so powerful is the psychology behind it. The Doji is a complete balance between buyers and sellers, a critical point in market sentiment. Once the bullish third candle forms, it’s a strong indication the downtrend is over and an uptrend may start.
While the Morning Star is reliable, you should always confirm it by looking at volume spikes or support levels. The historical roots of this pattern go back to Japanese rice trading and it’s still relevant today so it’s a good reversal signal.
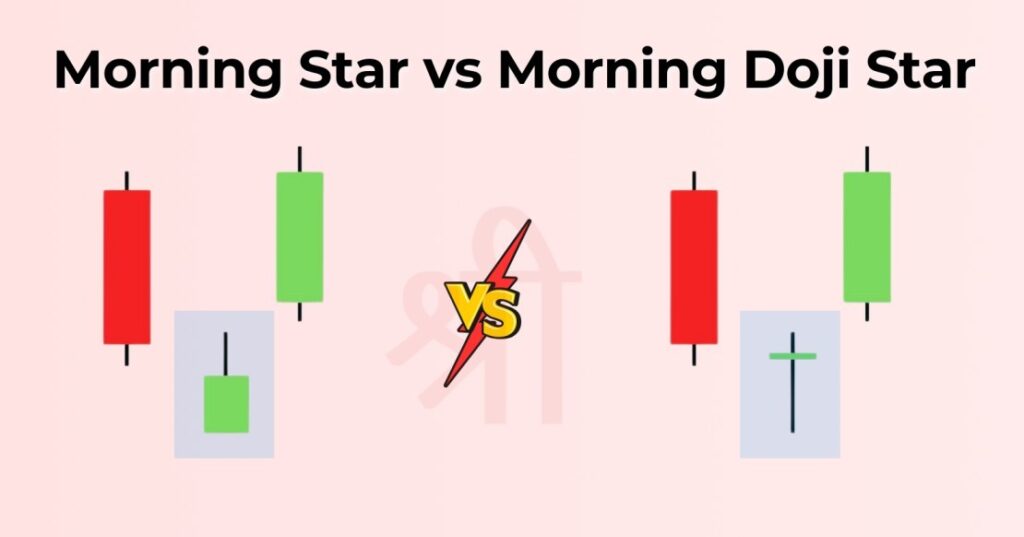
The Morning Star and Morning Doji Star are both bullish reversal patterns but the subtle differences give you different trading insights.
The Morning Star has a long bearish candle, a small-bodied candle (neutral or slightly bullish/bearish) and a bullish candle. The Morning Doji Star has a Doji in the middle instead of a small-bodied candle, so it’s a higher degree of market indecision. This makes the Morning Doji Star a stronger reversal signal since it captures the moment when neither buyers nor sellers are in control and sets up for a stronger bullish confirmation.
Another key difference is the Doji’s role in the Morning Doji Star Pattern. Its balanced open and close price visually highlights the market’s hesitation, making the subsequent bullish confirmation more significant. Traders often consider the Morning Doji Star a stronger signal, especially when accompanied by rising volume or other supportive indicators.
Both are good but the Morning Doji Star is more favourite for its clarity in showing a clear momentum change and gives traders more confidence to go long.
The Morning Star Pattern and the Evening Star Pattern are opposites. The Morning Star is a bullish reversal pattern that means an uptrend, and the Evening Star is a bearish reversal pattern that means a downtrend. Both are 3 candle patterns, but formation and interpretation depend on the market trend they appear in.
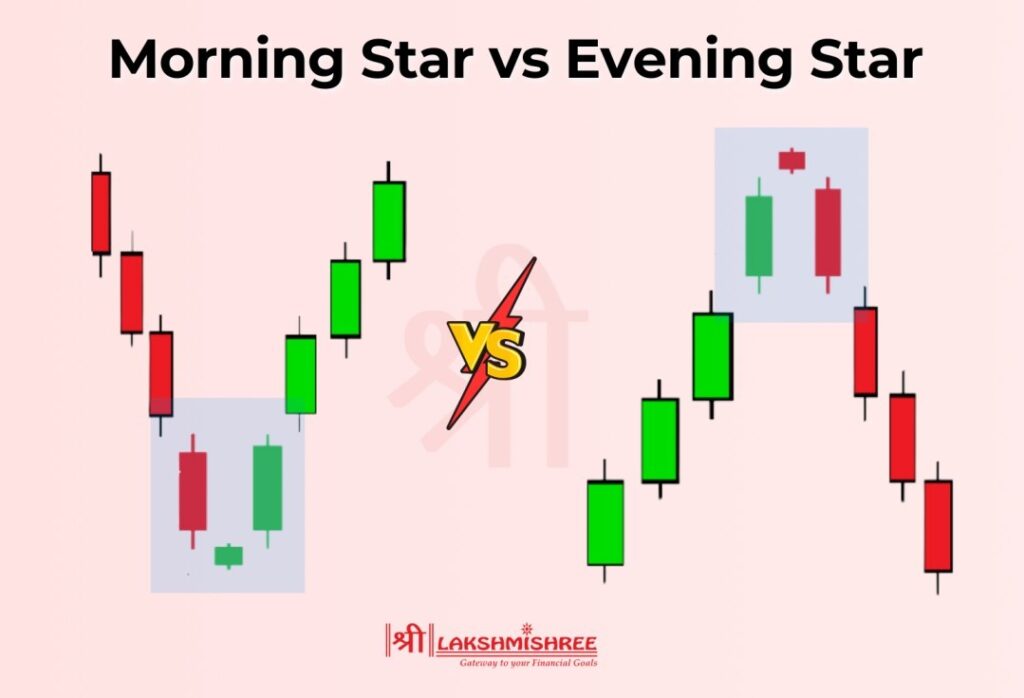
Here’s a quick comparison:
| Aspect | Morning Star Pattern | Evening Star Pattern |
|---|---|---|
| Trend Indication | Bullish reversal (appears at the bottom of a downtrend). | Bearish reversal (appears at the top of an uptrend). |
| First Candle | Long red candle showing strong selling pressure. | Long green candle showing strong buying pressure. |
| Second Candle | Small-bodied candle (neutral, red, or green). | Small-bodied candle (neutral, red, or green). |
| Third Candle | Long green candle confirming buyer control. | Long red candle confirming seller control. |
| Market Sentiment | Transition from bearish to bullish. | Transition from bullish to bearish. |
Although the Morning Star is a reliable reversal signal, traders make mistakes that affect their success. Here are the mistakes:
The Morning Star Candlestick Pattern takes at least 3 trading sessions to fully form as it consists of 3 candlesticks: the long bearish candle, the small-bodied "star" candle and the long bullish candle. Each candlestick is one trading session, so it takes at least 3 days to form. Wait for the market to close on the 3rd day before you can confirm and act on the pattern.
The Morning Star Pattern is a very reliable bullish reversal pattern that marks the end of a downtrend and the start of an uptrend. By knowing the structure—a long bearish candle, a small-bodied middle candle and a long bullish candle—traders can catch the reversal early. This pattern is most effective when used with volume confirmation, support levels and technical indicators.
Whether it’s the standard Morning Star or the Morning Doji Star, knowing these patterns and using disciplined risk management can help you grab the trades in the market.
The Morning Star Pattern is a bullish reversal candlestick pattern that forms after a downtrend. It consists of three candles: a long bearish candle, a small-bodied middle candle, and a long bullish candle, signalling a potential upward trend.
To trade the Morning Star Pattern, wait for confirmation of the third candle closing above the midpoint of the first candle. Enter long trades after breakout confirmation, set a stop-loss below the third candle, and target resistance levels while managing risk carefully.
The Morning Star is a bullish reversal pattern that appears at the bottom of a downtrend, signalling an upward reversal. In contrast, the Evening Star is a bearish reversal pattern that forms at the top of an uptrend, indicating a potential downward trend.
The Morning Doji Star replaces the middle candle of the Morning Star with a Doji, which reflects stronger market indecision. This makes the Morning Doji Star a more potent reversal signal than the standard Morning Star Pattern.
Confirmation comes when the third candle closes well above the midpoint of the first candle. Additional confirmation can be derived from higher trading volumes, support levels, or bullish signals from technical indicators like RSI or MACD.
Disclaimer: This article is for educational purposes only and should not be considered financial advice. Always conduct your research and consider consulting with a financial advisor before making any investment decisions.