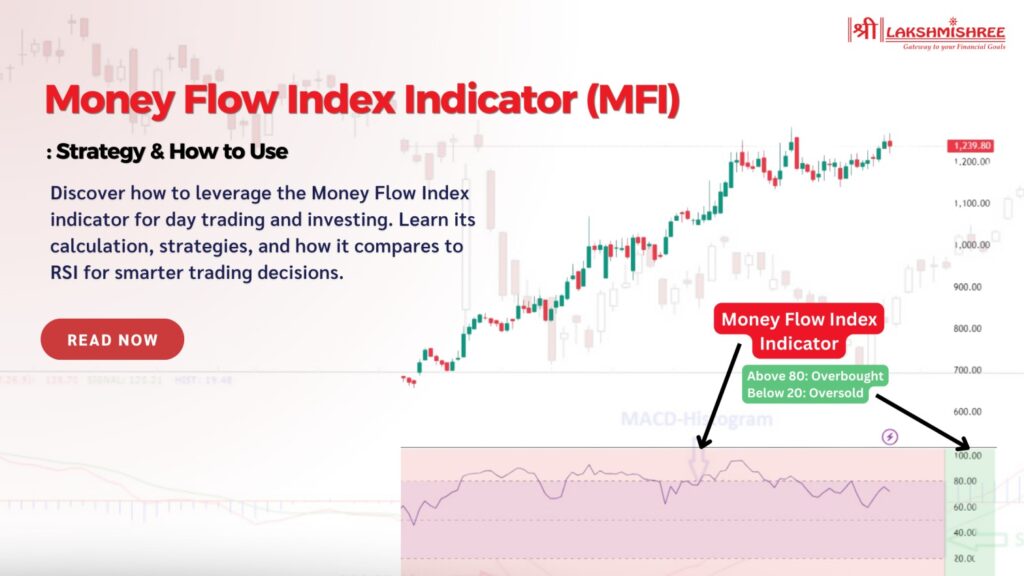
Ever feel like you're missing out on key market signals, especially when prices seem unpredictable? Well, you're not alone! Many traders struggle to find reliable indicators that help them spot potential buy and sell points. That’s where the money flow index indicator comes in. This tool doesn’t just look at price but also considers volume, giving you a clearer picture of the market’s momentum.
In this blog, we’ll break down everything you need to know about the money flow index indicator—how it works, how to calculate it, and, most importantly, how to use it for smarter trading decisions. If you're ready to step up your trading game, you're in the right place.
The Money Flow Index (MFI) is a technical analysis tool that helps traders identify buying and selling pressure in the market by using price and volume data. Unlike other indicators focusing solely on price movement, the MFI gives you a clearer picture of market momentum by considering the actual volume of trades. This makes it incredibly useful for spotting potential reversals or confirming trends.
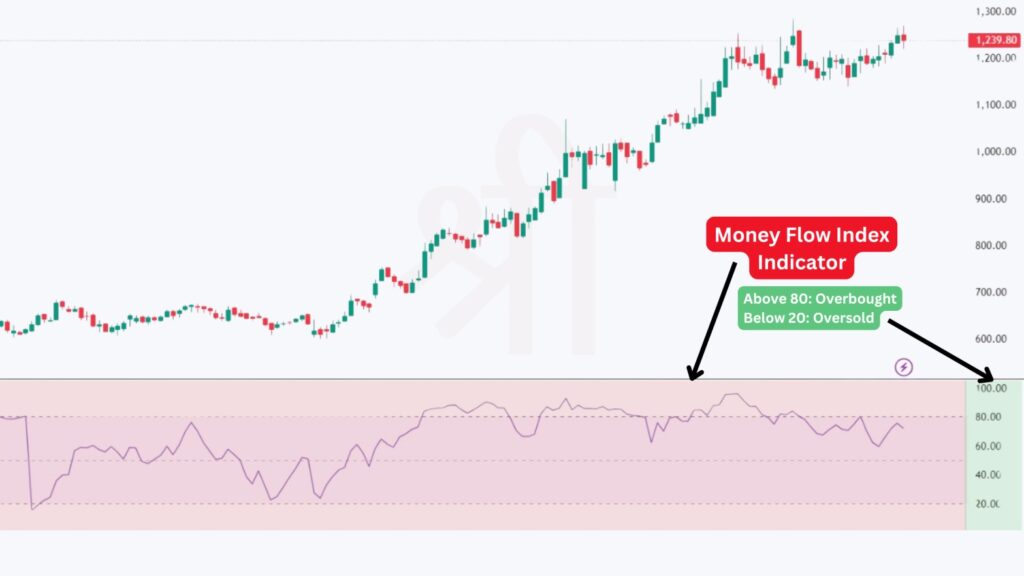
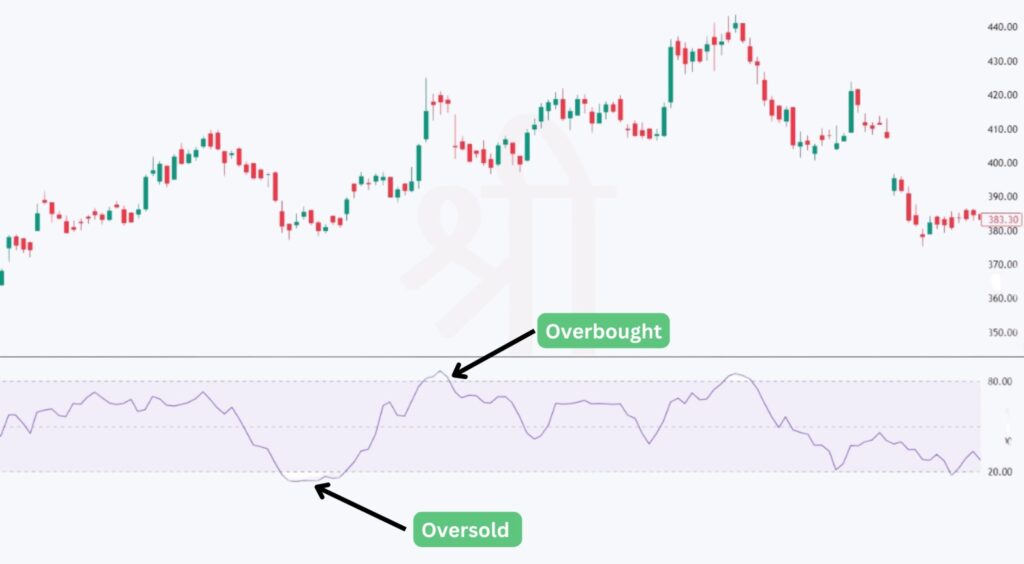
Traders often rely on the Money Flow Index indicator to detect overbought or oversold conditions. Typically, when the MFI crosses above 80, the market is considered overbought, suggesting a potential reversal downward. Similarly, when it dips below 20, it signals an oversold condition, hinting that prices might rise soon. So, if you're tired of relying on price action alone to make decisions, the MFI offers that extra edge by adding volume into the equation.
The MFI tracks positive money flow (when an asset's price closes higher than the previous period) and negative money flow (when it closes lower). It calculates these flows using the asset’s typical price, which is an average of its high, low, and closing prices, multiplied by the volume for that period. The MFI then compares the amount of money flowing into and out of the asset to generate a value between 0 and 100.
Here’s how it breaks down:
Combining both price and volume data, the MFI gives traders a more holistic view of the market’s strength, helping them to time their entries and exits better
Knowing the basic formula is important to understand the Money Flow Index (MFI). Here’s the formula breakdown:
Key points:
While the formulas might look a bit complex, don’t panic! lakshmishree platform calculates the MFI automatically, so you rarely need to do it manually.
Let’s break down the MFI calculation step by step so you get a clearer picture. Though manual calculation is possible, but you can also register on Lakshmishree, where the MFI is automatically displayed. Still, knowing how it’s calculated helps you understand how MFI values are generated.
Step-by-Step Calculation:
Do You Need to Calculate Manually?
Most traders don’t calculate the MFI by hand. Lakshmishree allows you to plot the MFI automatically in real-time, saving time and reducing errors. However, understanding the process helps you interpret the indicator more confidently.
Traders highly value the Money Flow Index (MFI) indicator for its ability to combine price and volume data to provide a more comprehensive market outlook. Here’s how you can use the MFI to improve your trading strategy.
One of the most common ways traders use the MFI is to detect overbought and oversold conditions. These levels suggest when a market might be ready for a reversal.
However, it’s important to note that prices can remain in these extreme conditions for a while, especially in strong trends. MFI values reaching 90 or 10 signal truly overbought or oversold levels, which occur less frequently and often point to an unsustainable price movement.
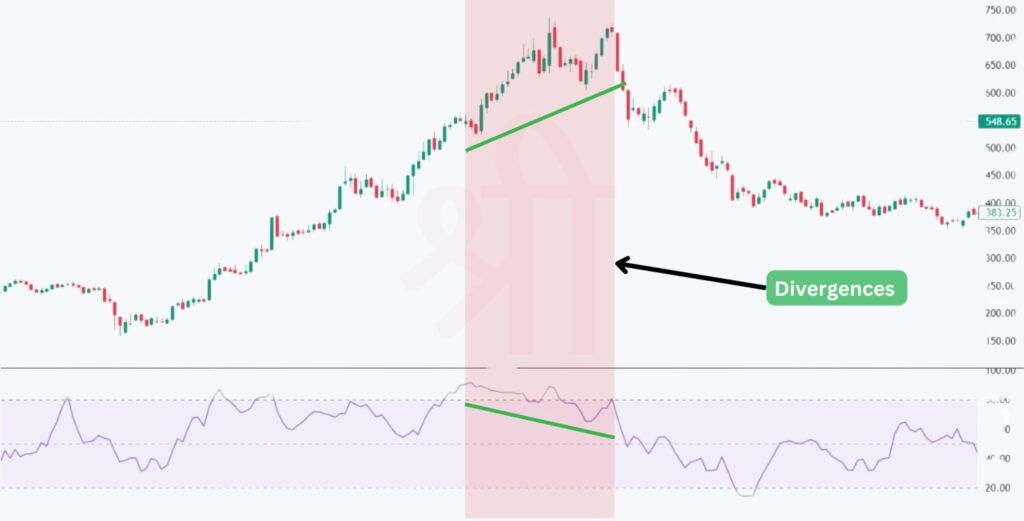
Another powerful signal the MFI offers is divergence. A divergence occurs when the price action of an asset and the MFI move in opposite directions, signalling a potential reversal in trend.
Divergences are particularly useful because they can alert traders to possible reversals even when the price trend seems to continue in one direction.
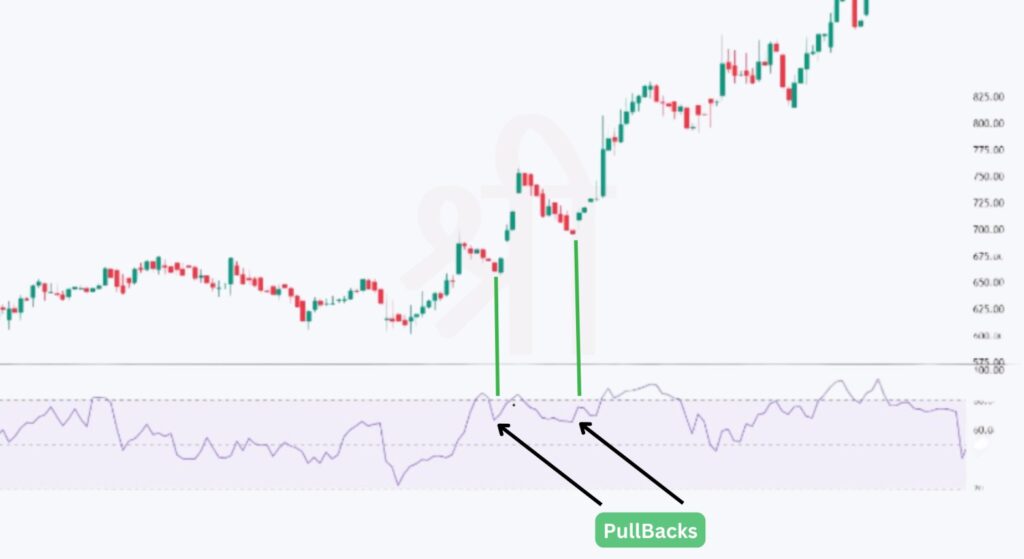
The MFI is also useful for identifying pullbacks in trending markets. Here’s how it works:
Focusing on these retracement signals, traders can avoid entering a trade too early and wait for confirmation that the trend will continue after a brief pullback.
The Money Flow Index (MFI) and the Relative Strength Index (RSI) are popular momentum indicators traders use to evaluate market conditions. While they serve similar purposes—helping traders identify overbought and oversold levels—there's one major difference: the MFI also incorporates volume into its calculation, while the RSI focuses solely on price.
| Criteria | Money Flow Index (MFI) | Relative Strength Index (RSI) |
|---|---|---|
| Main Data Used | Price + Volume | Price only |
| Overbought Level | Above 80 | Above 70 |
| Oversold Level | Below 20 | Below 30 |
| Use in Low-Volume Markets | Less effective in low-volume markets | Effective regardless of volume |
| Complexity | Slightly more complex due to volume inclusion | Easier to calculate, no volume factor |
| Divergence Detection | Effective, especially in high-volume markets | Effective and simpler due to the focus on price movements |
The Money Flow Index (MFI) is often a better choice because it factors in volume, providing a clearer picture of market activity. While the RSI is simpler and focuses on price alone, the added volume data in MFI can be crucial for making more informed decisions in the highly liquid Indian stock market. Ideally, combining both indicators can give you a stronger edge when trading stocks.
The Money Flow Index (MFI) is a powerful tool for traders looking to combine price and volume data to gain deeper insights into market movements. It’s especially useful in identifying potential overbought or oversold conditions, making it easier to spot reversals in the Indian stock market.
Whether you're a beginner or an experienced trader, integrating the money flow index indicator into your trading strategy can improve your ability to time trades more effectively. However, remember that the MFI works best when combined with other indicators like RSI or moving averages to confirm signals and reduce risk.
The Money Flow Index (MFI) is a technical indicator that measures the strength of money entering or leaving a stock using both price and volume. It helps identify overbought and oversold conditions in the market. Values above 80 signal overbought, while below 20 indicate oversold.
Key Money Flow Index strategies include trading when the MFI exceeds 80 (overbought) or below 20 (oversold). Traders also use divergence signals between price and MFI to predict potential market reversals.
The MFI is a good indicator, especially for traders relying on volume data to confirm price trends. It’s particularly effective in high-volume stocks and works well when combined with other indicators like the RSI.
The Money Flow Index formula calculates the Typical Price and then uses it to find the Raw Money Flow, which is split into positive and negative flows. These flows are then compared to generate the MFI value between 0 and 100.
To track money flow in the stock market, traders use tools like the Money Flow Index (MFI), which combines price and volume to show buying and selling pressure. The MFI helps identify market trends and potential reversals.
The main difference is that the Money Flow Index includes volume data, while the RSI only tracks price movements. This makes the MFI more useful for volume-sensitive assets like stocks, providing a more complete market picture.
Money flow refers to the actual capital moving in and out of an asset, while the Money Flow Index (MFI) quantifies this flow using a specific formula that incorporates price and volume, helping traders make informed decisions.
Disclaimer: This article is intended for educational purposes only. Please note that the data related to the mentioned companies may change over time. The securities referenced are provided as examples and should not be considered as recommendations.