Published: March 9, 2026 | Last Update: March 10, 15:34 IST | War Day: 11
The Iran war isn't distant. It's reshaping portfolios NOW aviation shareholders losing to defence, autos to gold, refiners to upstream oil. Every day someone captures opportunity or suffers loss.
At Lakshmishree, we've navigated 60,000+ investors through 31 years of crises. What separates profit from panic: decisive action on pattern recognition, not headlines.
I will NEVER allow the world's number one sponsor of terror to have a nuclear weapon. We have to be strong. It's called peace through strength
President of USA_ Donald Trump
Real-Time Intelligence12 MAR 2026 • 16:05 ISTMarket Structural Breakdown
Crude Re-SymmetryBrent breached floor, surging to $100.09. Iranian tanker strikes have effectively negated the IEA’s record reserve release.
Equities CapitulationNifty 50 plummeted -829 pts. Capital is rotating into Energy (+2.5%) as Auto sectors (-3.1%) lead the rout.
DOWNLOAD SCENARIO 2 PLAYBOOKCRISIS LEVEL 2Strategic Mandate
Lakshmishree’s PROFIT-BOOKING TRIGGERS hit. We advise transitioning 15% equity into Gold & Power Utilities.
This guide covers: (1) What happened Feb 28-Mar 12 and why markets Behaved the way they did till today, (2) Three scenarios with exact portfolio impacts, (3) Sector winners/losers with specific calls, (4) Your action plan by risk profile.
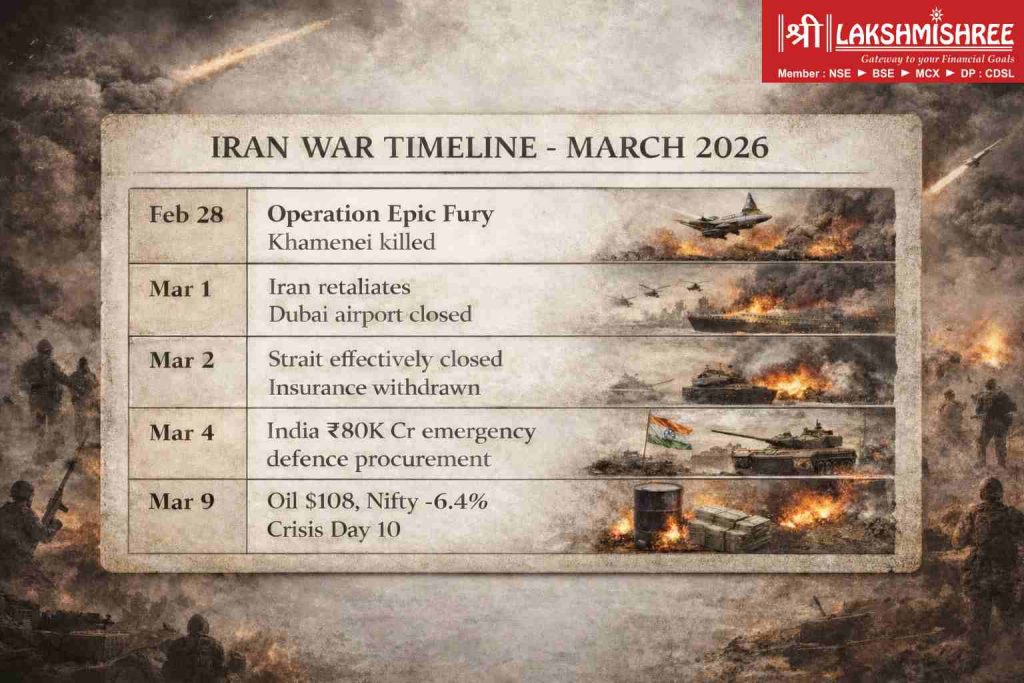
Unlike June 2025's 12-day conflict that saw oil briefly spike to $80 before retreating, this operation aims for regime change. Trump's speech left zero ambiguity: "We seek not only to destroy Iran's nuclear program but to enable regime change. The Iranian people deserve freedom from tyranny."
Iran's Unprecedented Retaliation:
Iran (Operation True Promise 4) struck UAE (Dubai airport closed, 747 flights cancelled), Saudi Arabia (Riyadh government district, eastern oil provinces), Kuwait, Bahrain, Qatar (Al Udeid Air Base housing 10,000 U.S. personnel). As of March 9: 2,500+ flights cancelled across Middle East, airspace over Iraq/Iran/Kuwait closed, Dubai operating at 30% capacity.
The Strait of Hormuz Crisis:
This 50km waterway carries 20% of global oil, 13.37 million barrels daily. Not physically blockaded by Iran's navy, but effectively closed by insurance withdrawal. Lloyd's of London and major insurers announced February 29 they won't cover Strait transits "given active combat operations." Without insurance, no commercial tanker risks passage.
Ship-tracking data: Vessel traffic down 90% since February 28. Only Iranian-flagged, Chinese-flagged, and handful of Russian vessels still transiting. Western commercial operators,who move majority of global oil, ceased operations entirely.
March 9-10 Whipsaw: Oil spiked $119.50 (highest since 2022) then crashed to $92-93 after Trump signaled "quick end." Markets rebounded: Sensex +639 pts (+0.82%), Nifty +234 pts (+0.97%). Defence stocks corrected -0.75% (profit-taking after +17%). Also, Indonesia has entered an agreement with India to procure the BrahMos missile system.
Iran's Retaliation: Struck UAE (Dubai closed, 747 flights cancelled), Saudi Arabia, Kuwait, Bahrain, Qatar. As of March 10: 2,500+ flights cancelled, airspace closed, Dubai 30% capacity.
March 12 Update (Day 13): Oil spiked above $100/barrel despite the International Energy Agency(IEA) releasing a record 400 million barrels from strategic reserves: the largest coordinated release in history. Iran attacked five vessels in the Strait of Hormuz within 24 hours, with the Islamic Revolutionary Guard Corps warning markets to prepare for "$200 oil." Two oil tankers were set ablaze in Iraqi waters, killing one crew member. The Pentagon disclosed to Congress that the first six days of the campaign cost $11.3 billion, with over $5 billion spent on munitions alone.
India's Crisis Response: With 90% of Strait traffic halted, India surged Russian crude imports by 50% to 1.5 million barrels per day, the fastest emergency pivot in India's energy history. LPG booking gaps extended to 25 days (up from 21), with induction cooker sales jumping 95% in Kolkata as households prepare for potential cooking gas rationing. The rupee held at a record ₹92.53, while petrol prices remained frozen at ₹94.72 as oil marketing companies absorbed mounting losses.
Critical Vulnerability: Unlike crude oil where India has backup suppliers, 80-90% of India's LPG imports transit the Strait of Hormuz with ZERO strategic storage. India consumes 1 million barrels per day of LPG, with only 40-45% produced domestically.
Government Actions (Day 13):
Analyst Warning: If Strait closure persists beyond 30 days, cooking gas rationing for 300 million households becomes likely. Unlike crude (where industry adjusts), LPG hits every household directly.
The Pentagon disclosed to Congress in a closed-door briefing that the first six days of the Iran campaign cost the United States $11.3 billion, excluding many ongoing operational expenses. Over $5 billion was spent on munitions alone, according to three sources familiar with the briefing.
What This Means for Duration: At this burn rate, a 90-day campaign would cost ~$170 billion (extrapolating from the first-week pace). For context, the entire 2003 Iraq War cost $1.1 trillion over 8 years. Markets are pricing in: The longer this runs, the higher the fiscal pressure on the U.S. to reach a diplomatic resolution.
March friday 13 : Markets seeking a "quick end" faced a brutal reality check as prolonged war and shifting U.S. trade policy triggered a systemic sell-off [1].
March 14: The Tense Standoff
As of Saturday morning, the conflict had transitioned into a grueling war of attrition with direct domestic impacts.
Diplomatic Deadlock: Despite an $11.3 billion U.S. campaign cost, no "regime collapse" is in sight. Instead, a new digital front opened with cyber-attacks on UAE desalination plants, threatening regional water security.
The Gold Refuge: While gold saw a Black Friday spike, prices on Saturday morning have entered a technical correction due to a stronger US Dollar. Domestic gold is currently trading near ₹1,60,680 per 10 grams (24K), down from its extreme early-March peak of ₹1.73 lakh. However, demand remains historically high as a hedge against currency instability.
Currency & Logistics: The Rupee remains pinned at a record ₹92.55, requiring quiet RBI intervention to prevent a slide toward ₹94. Meanwhile, freight forwarders announced a 25% War Risk Surcharge on all global shipments due to Cape of Good Hope redirections.
The war's second week ended with a massive escalation in rhetoric and a direct threat to heads of state.
The conflict forced a massive shift in U.S. foreign policy as the Physical War began to dictate Trade Diplomacy.
As of today, the war has entered a new, "boots-on-the-ground" phase.
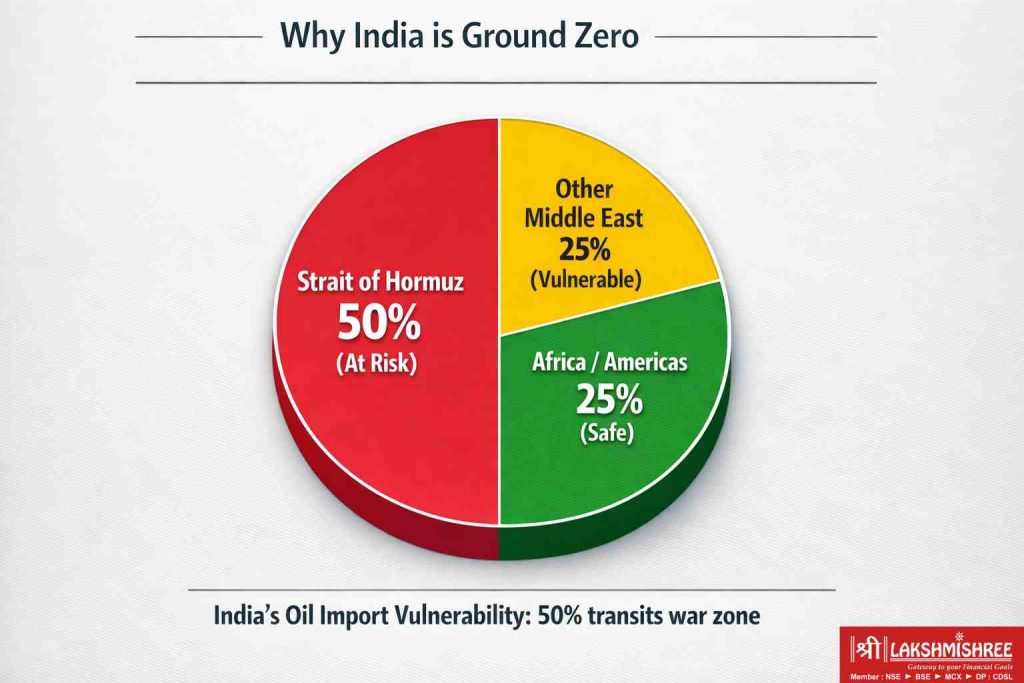
India imports 85% of its crude oil i.e. 4.2 million barrels daily. Of this, 50% transits Strait of Hormuz. Bloomberg, Goldman Sachs, and Societe Generale all label India "most at risk" in Asia from this war. Here's why:
Critical Data Point: Goldman Sachs estimates that a 20% rise in Brent crude cuts overall Asian corporate earnings by 2%. We are currently witnessing a 61% spike ($67 → $108). With India’s energy import bill increasing by $1.4 billion for every $1 rise in crude, the nation faces an additional $57.4 billion in annual import costs. This surge alone is equivalent to 65% of India’s total FY26 Defence Budget, and nearly triple the entire annual budget for military modernization.
The 30-Day Lifeline: To prevent a total energy collapse, the U.S. granted India a 30-day emergency waiver. This allowed India to secure 30 million barrels of stranded Russian oil that was stuck in transit due to sanctions.
The Math: Kpler analyst Sumit Ritolia calculates that incremental Russian supplies of 1-1.2 million bpd above February volumes still leave an effective shortfall of 1.6 million bpd. India is filling this gap through: (1) Reduced refined product exports (down from 1.1 million bpd avg), (2) Drawdown of domestic crude stockpiles, (3) Emergency purchases from West African and Latin American suppliers.
FROM SUPPLY SHOCK TO "LOGISTICS TRAP"
As of March 17, the Russian Lifeline i.ie. the 30 day waiver that stabilized the first 14 days of the war is facing a brutal reality check. The relief of the 30-day waiver is now being overshadowed by three critical developments:
1. The Waiver Leverage has Hardened
While the U.S. initially granted a 30-day emergency bridge for Russian crude, the U.S. Treasury officially signaled on March 17 that this is a one-time favor. Extension of this waiver is now being explicitly linked to India joining the maritime coalition to escort tankers.
2. The $103 Price Floor (The $4.2 Billion Shock)
Your math must now account for a violent shift in the "Day 18" price floor. Following the Lebanon Ground Invasion and the UAE Airspace Closure today:
3. The Evaporating Discount (Secondary Sanctions Risk)
The safer Russian routes are facing a new invisible blockade. On March 16, G7-linked reinsurance hubs began aggressive scrutiny of the Shadow Fleet, carrying Russian Urals to India.
Here is the counterintuitive truth most investors miss: Stock markets typically rise during wars, not fall. While the pre-war phase often triggers a sharp sell-off as investors price in uncertainty, historical analysis of the S&P 500 across major modern conflicts, including the Gulf War and theIraq War.
Why stocks rise during wars: (1) Defence spending surges (India: ₹80K Cr emergency), (2) Duration uncertainty declines once fighting begins, (3) Non-affected sectors continue growing, (4) NBER: Volatility 25% LOWER during wars vs peacetime.
Current India (Days 1-11): Nifty -7% (deeper than Iraq's -5.3% due to oil dependency). Defence +34% (BDL peak, matching pattern). Aviation -9-15% (matching). Gold ₹1.64L (on track for +24% annual).
The 2003 Iraq War is the closest parallel to today's operation. Both involved "Regime Change" objectives and massive oil supply risks. When we look at the historical recovery trajectory, a clear pattern emerges:
As we hit the crucial Day 15 mark (February 28 – March 14), the War Paradox is playing out in real-time and making a real impact visible. India’s market is currently a tale of two extremes: systemic fear in energy-dependent sectors and a strategic flight to safety in others.
History teaches us that the 14–16 trading session window is the absorption point. This is the time it takes for institutional investors to stop reacting to headlines and start buying based on long-term value.
The Monday Outlook: As we enter the final day of this historical Shock Window, all eyes are on the Monday open. If the Nifty holds its current support levels, we move from the "Panic Phase" into the Recovery, where the strongest companies typically begin their post-war rally.
(1) Government defence spending surges: Indian government announced emergency ₹80,000 crore procurement on March 4. (2) Uncertainty about war DURATION declines once fighting begins i.e., markets hate uncertainty more than bad news. (3) Corporate earnings for non-affected sectors continue growing despite geopolitical noise. (4) Stock volatility actually DECREASES during wartime, NBER research shows 25% lower volatility during conflicts vs. peacetime.
60,000+ investors have audited their positions this week. Our War Room projections indicate a -15% Nifty correction if diplomatic corridors remain blocked.
Lakshmishree Investment & Securities Pvt. Ltd.
SEBI Registered • NSE | BSE | MCX | NCDEX • Member ID: 12817
Normally, when oil prices spike, big countries release their emergency reserves (like the recent 400 million barrel release) to lower prices.
The Middle East is not just blocked by missiles; it’s blocked by insurance companies. Most ships won't sail into a war zone because their insurance (led by Lloyd’s of London) is cancelled.
History shows that big world leaders (like Trump or Putin) often announce peace deals on Sundays. Why? To stop the stock market from panicking and give it a "fresh start" on Monday morning.
The Bottom Line for You:
We are currently at the 15-day mark, which is historically the "peak of pain" for markets. If the Sunday peace signals are strong, Monday morning could be the start of a V-shaped recovery for your portfolio.
War redistributes wealth faster than any other market event. Based on Iraq 2003, Ukraine 2022 patterns and current commodity dynamics, here are specific calls for Indian investors:
IDENTIFYING THE WINNERS | MARCH 17, 2026
Recalibrated for the BrahMos/Indonesia deal and Lebanon invasion, initiating a sustained defense cycle due to prolonged war signals.
As the Rupee tests ₹93, IT margins are undergoing structural expansion, effectively offsetting US recessionary headwinds.
With Brent at $103.42, previous neutral data is superseded. Energy Alpha realizations are now at multi-year peaks.
Unit economics remain under pressure due to high-voltage fuel volatility. Posture remains defensive until support benchmarks stabilize.
Marketing spreads are testing structural lows amid current spot freezes. High engagement risk identified in current engagement protocols.
Assessing demand destruction versus surging input benchmarks. Strategic monitoring suggests a 60-day exclusion from active weightage.
At Lakshmishree, we've repositioned 8,400+ portfolios since February 28. Here's the playbook we're executing for conservative, moderate, and aggressive investors:
Recalibration follows the shift in the No-Deal stance. Monitoring focuses on the export trajectory following the ASEAN blueprint and regional escalations.
Monitoring focuses on the Rupee-Dollar trajectory as domestic spot rates test critical expansion levels. Offset capacity against external recessionary signals is currently high.
Recalibration triggered by high-voltage shifts in Brent Crude benchmarks. The previous neutral stance is being replaced by active monitoring of Energy Alpha momentum.
The hardest part isn't buying. It's selling. Set these triggers NOW, write them down, and execute mechanically. Emotion is the enemy of returns.
Institutional Protocols: March 17 Recalibration Cycle
After 10,000+ words of analysis, 75 years of historical data, sector-by-sector breakdowns, and real-time war tracking, your investment success over next 3-6 months depends on answering three questions:
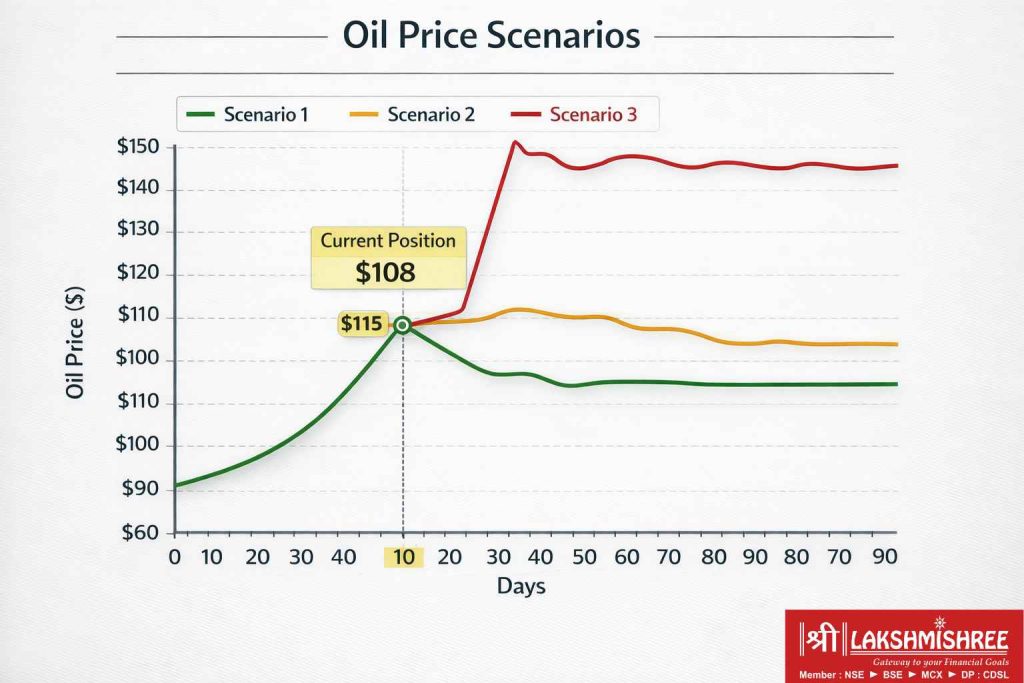
Question 1: Which scenario is unfolding?
Markets price Scenario 2 (55%). Monitor Week 2-3: If no ceasefire signals, Scenario 2 confirmed → maintain commodity overweight. If oil spikes >$125 for 5+ days, Scenario 3 risk rising → increase defensive positioning.
Question 2: Am I positioned correctly for MY risk tolerance?
Conservative holding 15% silver with no stop-loss will panic-sell at worst moment. Aggressive holding only 5% silver watches ₹4L opportunities pass under-allocated. Review Section 6 targets. If misaligned, rebalance within 48 hours.
Question 3: Have I SET my exit triggers in writing?
Investors who pre-commit to mechanical rules outperform "decide in the moment" investors by 7-12 points during volatile periods. Open Notes app NOW. Copy: "Gold exit ₹2.05L: Sell 40%. Oil exit <$75: Sell 100% oil stocks. Strait reopens: Sell 50% commodities within 24hr. Review March 20, April 5."
60,000+ investors have audited their positions this week. Our War Room projections indicate a -15% Nifty correction if diplomatic corridors remain blocked.
Lakshmishree Investment & Securities Pvt. Ltd.
SEBI Registered • NSE | BSE | MCX | NCDEX • Member ID: 12817
Day 18 Reality Check: Brent has established a violent new floor at $103.42 following the Lebanon Ground Invasion. The U.S. has signaled a "No Deal" stance, and the UAE has closed its entire airspace after drone strikes hit near Dubai International. With the Nifty down 7% since the conflict began, defensive positioning is no longer optional. it ahs become a survival requirement.
Watch March 20 (U.S. Treasury Waiver Decision) and March 25 (OPEC+ Emergency Session) for the next volatility triggers. If the Russian oil waiver is not extended, expect a 'Supply Cliff' and a further Rupee slide toward ₹93.50
As of March 17, 2026, the Nifty 50 has seen a ~7% drawdown (approximately 7.2% in just 18 days) due to heightened risk aversion. Historically, markets face a War Puzzle where indices fall during the pre-war uncertainty phase but often stage a robust recovery once the conflict begins and "unknowns" become "knowns.
Winners (Growth): The Defence sector (HAL, Bharat Dynamics) is benefiting from emergency procurement surges (~₹80,000 Cr), while Upstream Oil (ONGC) and Gold are surging due to supply disruptions and safe-haven demand.
Losers (Loss): Aviation (IndiGo, SpiceJet) and Autos (Maruti) are facing significant pressure due to skyrocketing fuel costs and input cost inflation.
India is highly vulnerable because it imports 85% of its crude oil, with 50% of that transit through the Strait of Hormuz. With the Strait effectively closed by insurance withdrawals and Brent Crude hitting $108/barrel, India faces an additional $57.4 billion in annual import costs, putting severe pressure on the Rupee (which hit a record low of ₹92.53).
yes. While India maintains strategic reserves for crude oil, it has zero strategic storage for LPG. Since 85% of India’s cooking gas is imported, a prolonged closure of the Strait of Hormuz (beyond 30 days) could lead to rationing for over 300 million households.
Disclaimer: Iran war analysis based on real-time data as of March 10, 2026, 15:34 IST. Oil crashed $119.50 → $92.50 within 24 hours—extreme volatility expected. Scenario probabilities updated based on Trump signals. Portfolio allocations are general guidance. Defence stocks carry high volatility. Commodities can crash rapidly on ceasefire. Historical patterns don't guarantee outcomes. This is educational content, not personalized advice. Consult SEBI-registered advisor before decisions. All investments carry market risk. Lakshmishree Investment and Securities is SEBI registered stockbroker.

