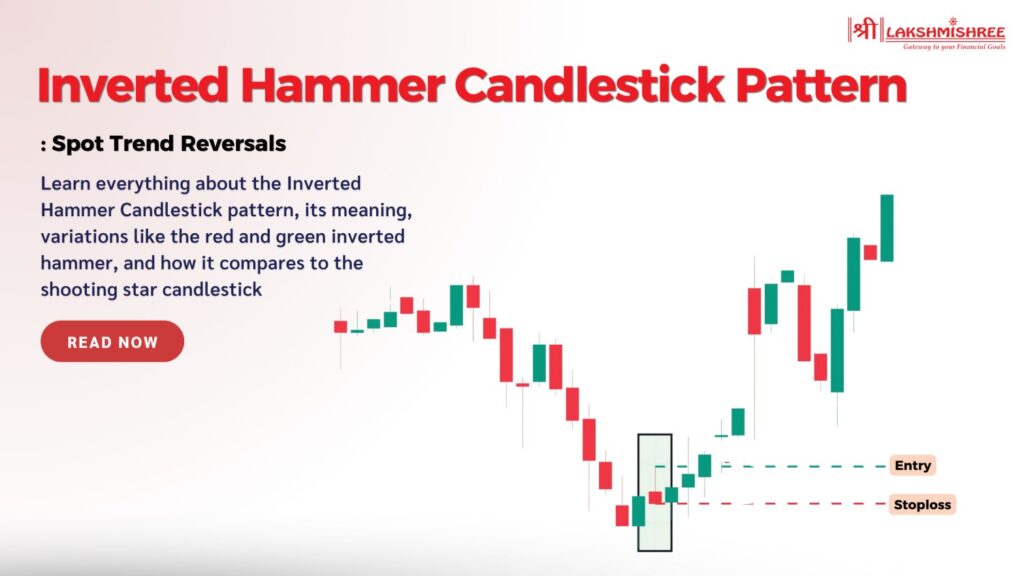
In trading, knowing the trends is everything. Candlestick patterns are the simplest and most powerful way to read price action and the Inverted Hammer is one to watch out for. It means reversal is possible and you can act before the trend changes.
This blog will explain what the inverted hammer candlestick means, how to spot it and how to use it to make better trading decisions.
The Inverted Hammer Candlestick Pattern is a popular chart pattern in technical analysis, often used by traders to identify potential trend reversals. It forms at the end of a downtrend, indicating the selling pressure is weakening and a bullish reversal is around the corner. It’s like an early warning system for traders to know when the buyers (bulls) are stepping in and starting to push the price up.
This pattern is special because it looks like an upside-down hammer. The candle has a small body at the bottom and a long upper wick, meaning the price tried to go up but hit resistance.
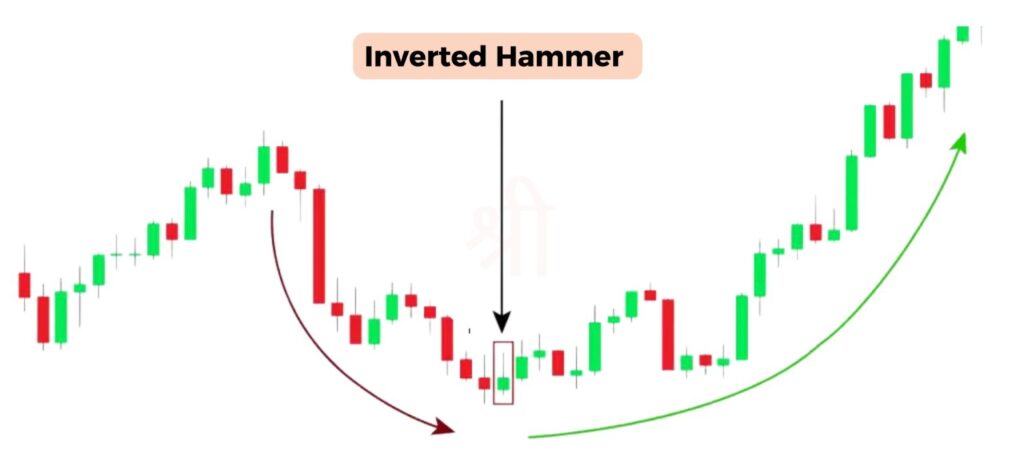
The colour of the candlestick (green or red) doesn’t matter much here. The long upper wick means buyers are taking over. This pattern works best when confirmed with other technicals or increased volume, meaning more market activity and buyer momentum.
The Inverted Hammer Candlestick has a distinct shape once you know what to look for. Here’s the breakdown:
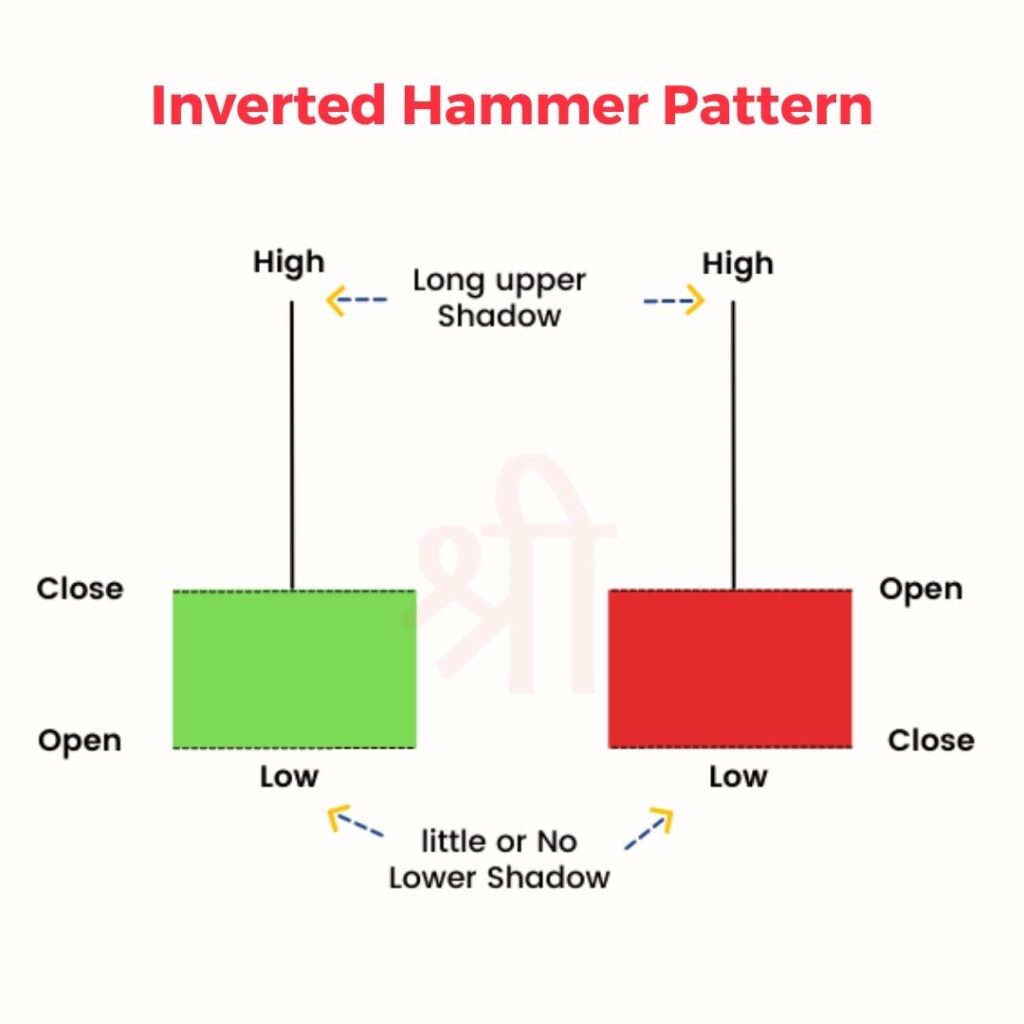
The inverted hammer forms in downtrends, shows a change in sentiment where sellers lose control and buyers start to gain momentum. For example, an inverted hammer may be the first sign of a bullish reversal after a series of red candles in a downtrend.
The Inverted Hammer is often seen as a reversal signal at the end of a downtrend. But in rare cases, you may see it in an uptrend. When it appears in an uptrend, its reliability as a reversal signal is greatly reduced.
In such cases, the inverted hammer may be a sign of market indecision rather than a shift in sentiment. Traders should be careful and not rely on the pattern alone in an uptrend as it is designed to be a reversal pattern in bearish markets. Combine it with Technical indicators or wait for additional confirmation to make a better decision.
The Inverted Hammer Candlestick can appear in two colours: red and green. While the shape of the candlestick remains the same—a small body at the bottom with a long upper wick—the colour means different things during the session.
Below we’ll look at each colour of the inverted hammer and what it means for the trader.
A green inverted hammer forms when the session closes above the open, so the body is green (or white). This means buyers pushed the price up during the session and managed to close above the open.
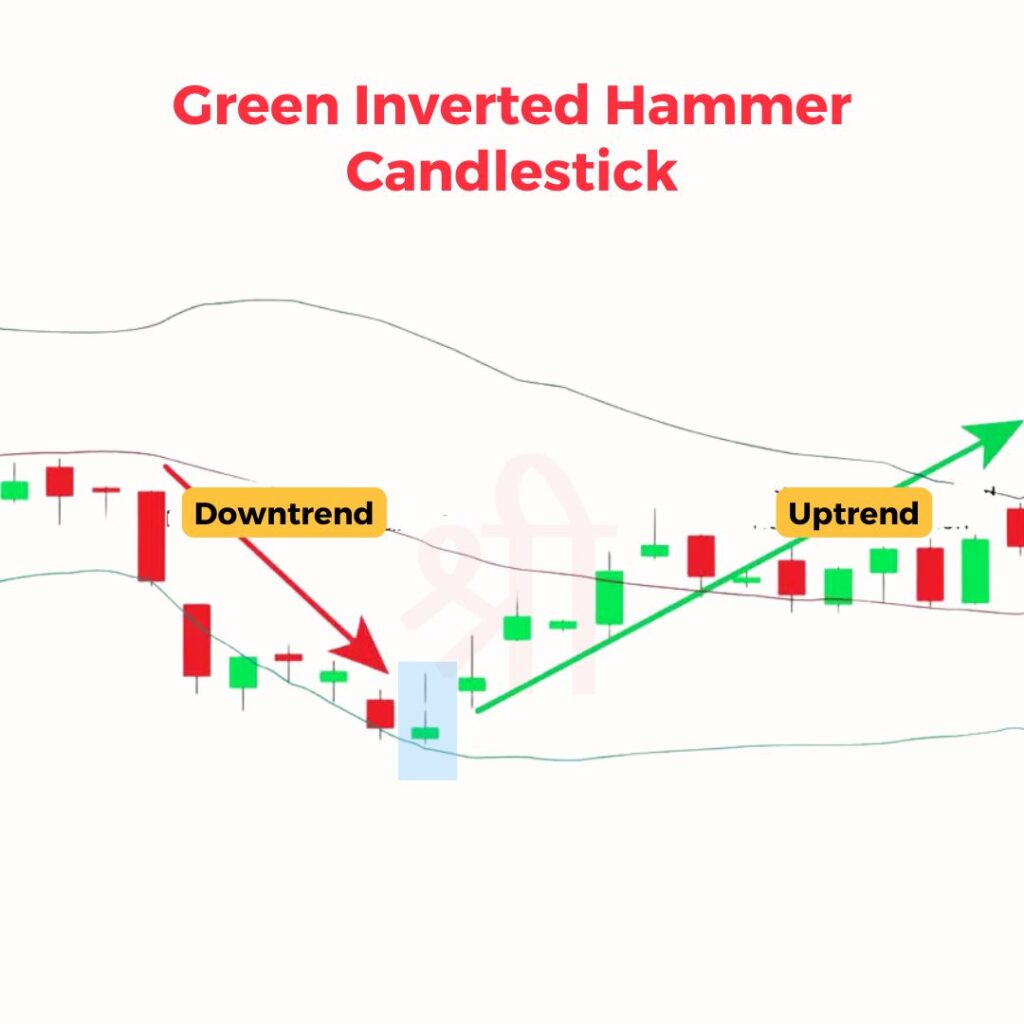
A green inverted hammer is considered a stronger bullish reversal signal because it means buyers had some effect despite the initial selling. It shows increasing momentum from the bulls and can change market sentiment from bearish to bullish.
A red inverted hammer is when the close is lower than the open and the body is red (or black). So buyers were able to push the price up during the day but sellers took control and brought the price back down and closed below the open.
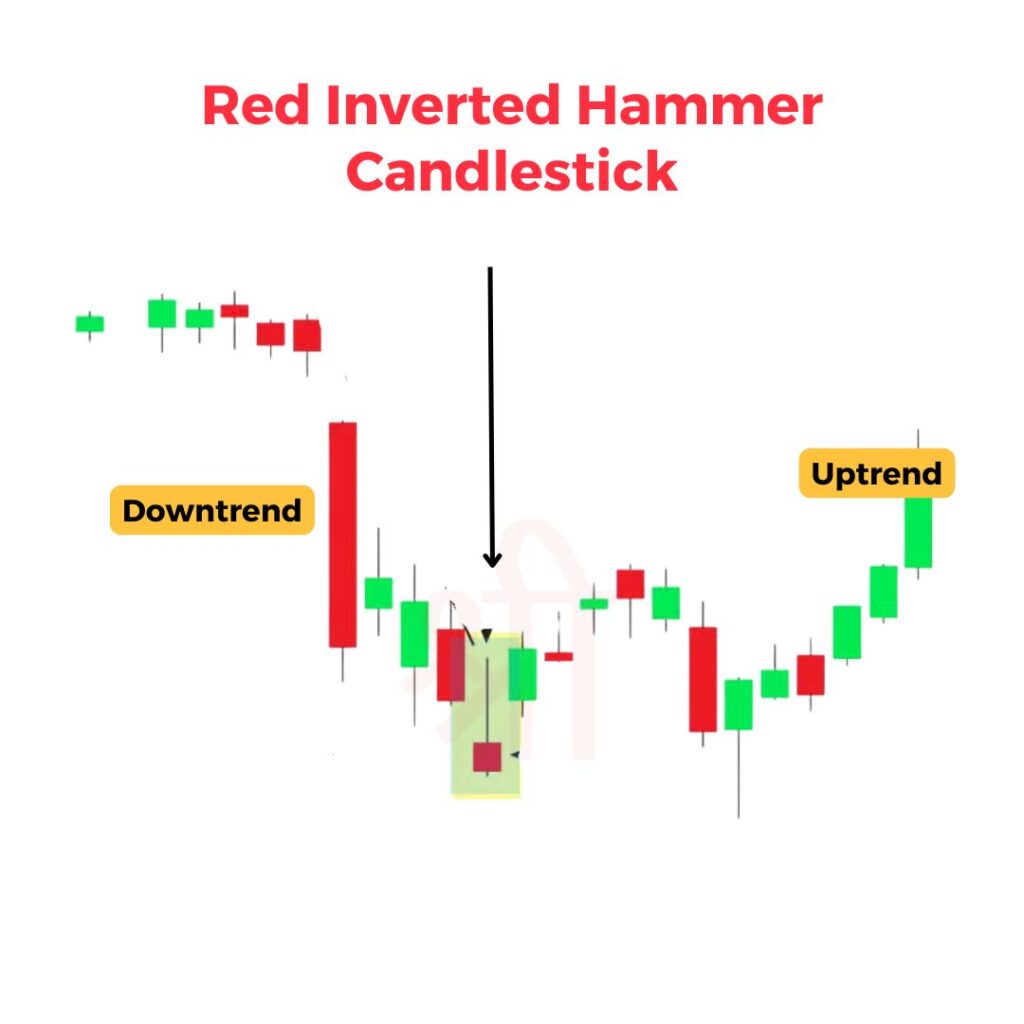
While the red inverted hammer is also a bullish reversal, it’s slightly weaker than the green one. This is because the lower close means more resistance from the sellers which may mean there’s still bearish sentiment.
In summary, both red and green inverted hammer is a reversal but green is more reliable because of the higher close. But whatever the colour, always look at the candle in the bigger picture of market trends, support levels and confirmation signals.
The Inverted Hammer is a key pattern for traders looking to spot potential reversals. But you must observe carefully, confirm properly and have a clear strategy.
1. Confirm the Downtrend
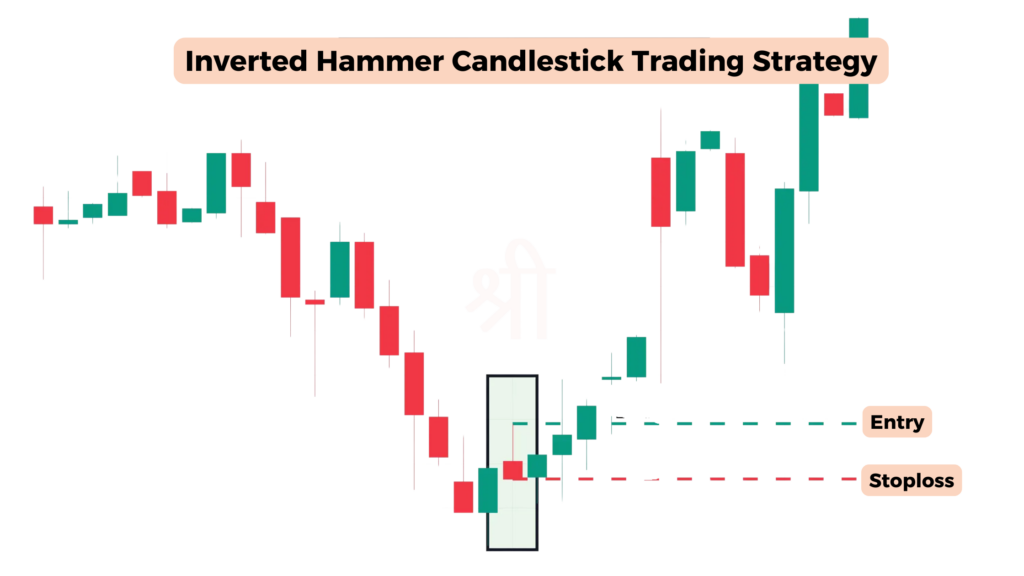
The Inverted Hammer is most effective when it appears after a long downtrend, as it means selling pressure is easing. Ensure the market has been clearly bearish before acting on this pattern.
2. Look for Confirmation
Confirmation is key when trading the inverted hammer. Wait for the next candle to close above the high of the inverted hammer. This means buyers are taking control, confirming the reversal is likely.
3. Entry Point
There are two possible ways to enter a trade:
4. Stop-Loss Placement
Place a stop-loss below the low of the inverted hammer to manage risk. This will protect you if the pattern doesn’t turn into a reversal.
5. Profit Targets
Since the inverted hammer is a single candle, there’s no fixed way to determine profit targets. Use one of the following:
The Inverted Hammer and Shooting Star patterns are often confusing because they look similar but serve totally different purposes and occur in opposite market conditions. Both have a long upper wick and a small real body, but the context within the trend sets them apart.
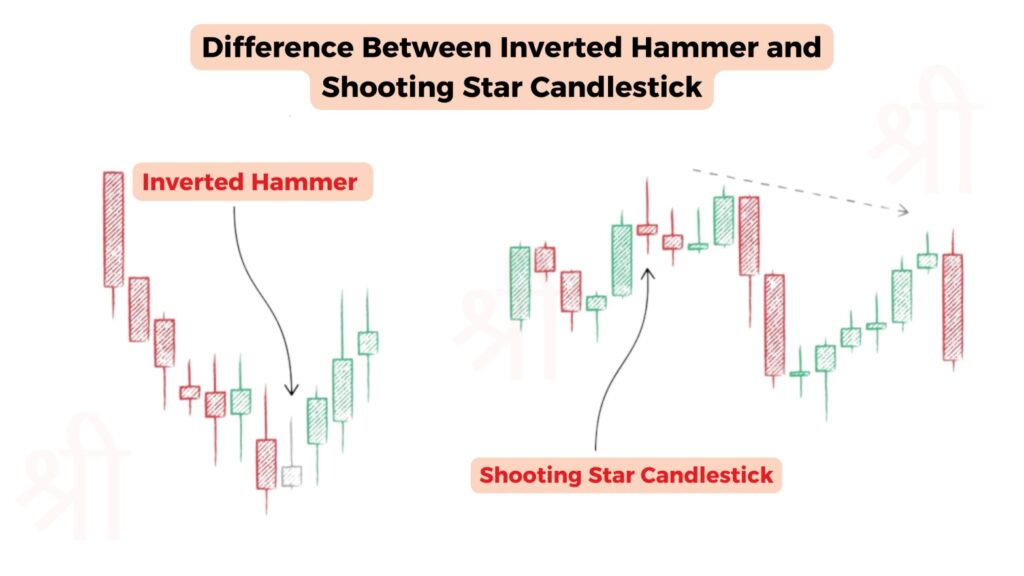
The inverted hammer is a bullish reversal pattern that occurs at the bottom of a trend. It means sellers are losing steam, and buyers are coming in to push prices up. On the other hand, a shooting star is a bearish reversal pattern that occurs at the top of a trend, which means buyers are losing control, and sellers are taking over.
The other difference is in market sentiment. The inverted hammer means the potential change from bearish to bullish sentiment as the long upper wick means buyers are trying to push the price up despite initial selling. In contrast, The shooting star means the change from bullish to bearish sentiment, with the long upper wick showing that sellers successfully countered buyers’ efforts to push the price upward.
The Inverted Hammer is a bullish pattern, signalling a potential reversal after a downtrend. It means buyers (bulls) are stepping in and challenging the selling pressure, a momentum change. The long upper wick of the Inverted Hammer means buyers tried to push the price up, even though sellers may have taken control back by the end of the session.
While its main job is to predict a bullish reversal, confirmation is required. Traders often wait for the next candle to close higher and the volume to increase before taking action. Without confirmation, it might just be market indecision rather than a real trend change.
While the Inverted Hammer is a great tool, we can misinterpret it or act too soon. Here are the common mistakes and how to avoid them:
Inverted Hammer is a reversal pattern because it shows a potential change in market sentiment from bearish to bullish. It forms at the end of a trend and is a battle between buyers and sellers. Sellers dominate the session and try to push the price down and buyers come in and push the price up and leave a long upper wick.
The key feature of Inverted Hammer is that it captures market uncertainty. The long upper shadow is the buyers trying to increase the price, showing their increasing strength.
Combining the Inverted Hammer with other technical indicators will make it more reliable and confirm bullish reversals. Here are the ones to use:
An inverted Hammer is a single candlestick pattern used in technical analysis to identify bullish reversals, especially after a long downtrend. Its shape, long upper wick and small body mean market sentiment is shifting, and buyers are taking control from sellers. While the pattern itself doesn’t guarantee trend change, combining it with technical indicators like volume analysis or support levels enhances its reliability.
The inverted hammer candlestick is a bullish reversal pattern that forms at the end of a downtrend. It signals that buyers are beginning to challenge selling pressure, with the potential for the price to reverse upward.
The inverted hammer is primarily a bullish pattern found in downtrends. If it appears during an uptrend, it’s less reliable and may indicate market indecision rather than a reversal.
After an inverted hammer, traders look for a confirmation candle, which is a bullish candlestick that closes above the high of the inverted hammer. This confirms the likelihood of a bullish reversal.
Yes, a hammer candle can be bearish if it forms in an uptrend. When found at the top of an uptrend, it is referred to as a hanging man, indicating a potential bearish reversal.
A bearish inverted hammer suggests potential selling pressure but is rare and less reliable. It often appears in uptrends but requires confirmation to validate any bearish signals.
The shooting star forms at the top of an uptrend and signals a bearish reversal, while the inverted hammer forms at the bottom of a downtrend and indicates a bullish reversal. Their appearance is similar, but their context and implications differ.
Disclaimer: This article is for educational purposes only and should not be considered financial advice. Always conduct your research and consider consulting with a financial advisor before making any investment decisions.