Have you ever wished you could predict when the stock market is about to change direction? Well, you're in the right place! One of the simplest ways traders try to spot a big market move is by using candlestick patterns. In this blog, we will talk about one very important pattern — the hanging man candlestick. This special candle can sometimes warn traders that a strong uptrend might be coming to an end!
In this easy guide, you’ll understand what the hanging man candle is and how you can use it smartly in your own trading. Whether you are just starting or know little about trading, this blog will clarify everything.
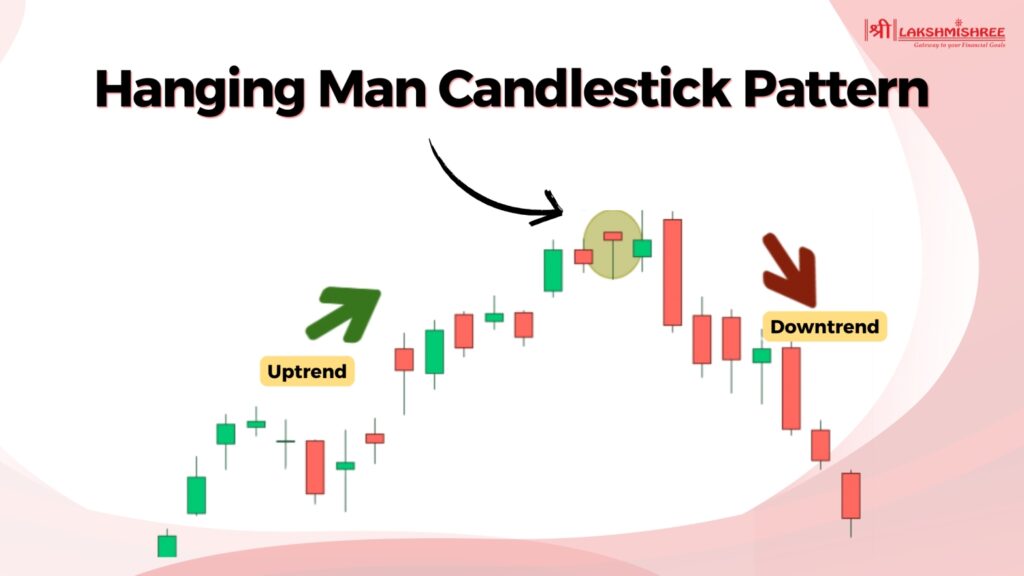
The hanging man candlestick is a single candle pattern that shows up at the end of an uptrend. It gives a warning that the price might soon fall. This pattern is often seen as a bearish signal, meaning it tells traders the buying power is getting weak, and the sellers may take control soon.
It gets its name because the candle looks like a hanging man — it has a small body at the top, with a long lower shadow below. This shape tells us that even though the price went down during the day, buyers pushed it back up — but not with full strength. If this candle appears after many green candles (rising prices), it could mean the trend is losing strength. That’s when traders get alert and watch for signs of reversal.
The hanging man candle pattern is used mostly by technical traders who want to spot quick changes in price direction. It's not a signal to buy or sell right away — it’s more like a red flag that says, “Hey, watch out! A trend change might happen.”
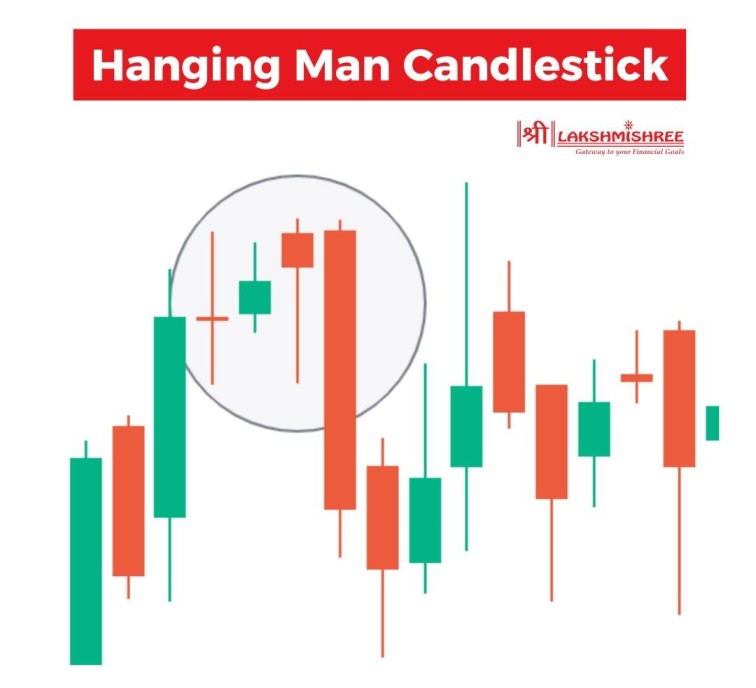
The hanging man candlestick has a very special shape that makes it easy to recognise on a chart. It looks like a man hanging by his feet — and yes, that’s where it gets the name from!
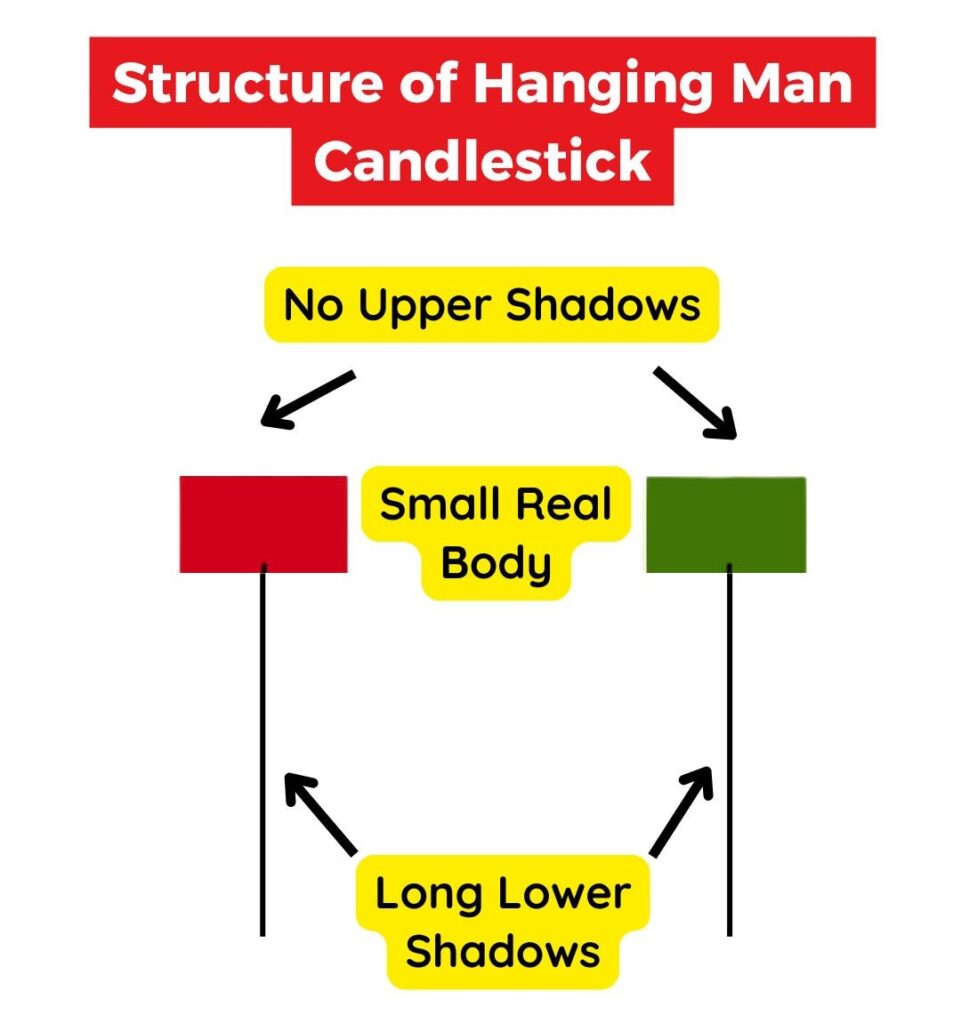
Here’s what makes up the structure of a hanging man candle:
The hanging candlestick pattern can appear as a red or green candle, but a red one (called a bearish hanging man) is considered stronger. Why? Because it shows sellers were stronger than buyers during that period. The body’s colour can change, but the structure must always stay the same — small body on top, long wick below, and little to nothing above.
Spotting the hanging man candlestick pattern is not only about looking at the shape — it’s about understanding the message the market is sending.
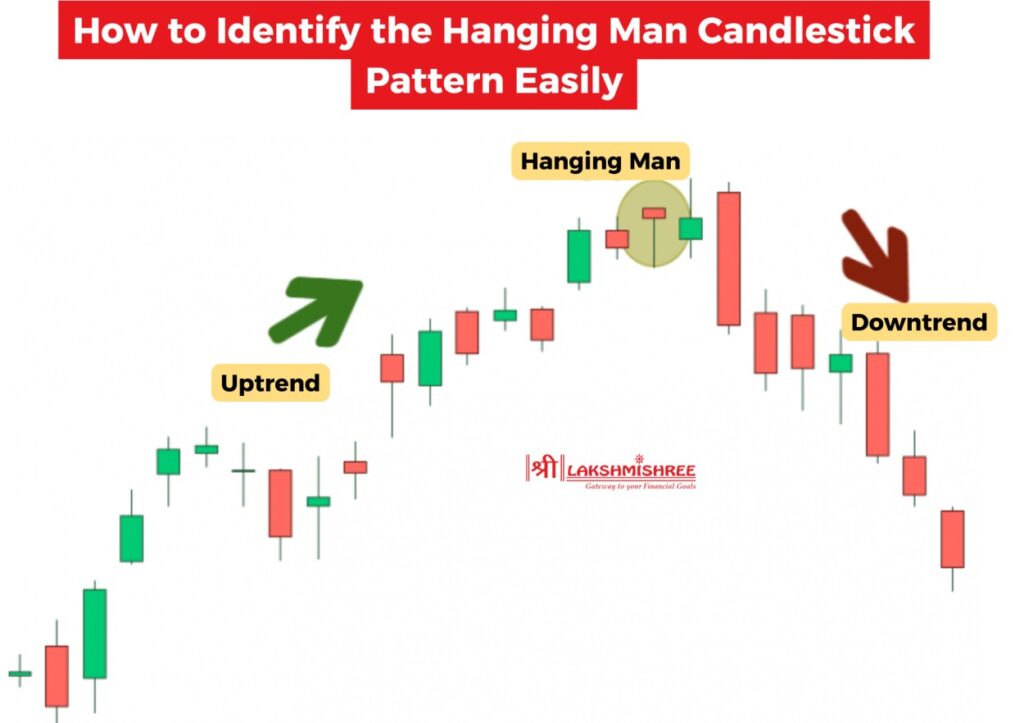
Step 1: Make Sure There’s an Uptrend
Before the hanging man candle appears, the price should be moving up for some time. This is very important. If the market is not in an uptrend, it’s not a valid hanging candle pattern — it could be something else, like a hammer.
Step 2: Check the Candle’s Shape Properly
To confirm it’s a real hanging man candlestick, the candle must have:
Step 3: Look at the Candle’s Colour
The candle can be red or green. A green hanging man candlestick is still valid, but a red candle (bearish hanging man) is often seen as a stronger signal. It shows that sellers were more powerful.
Step 4: Wait for Confirmation
Don’t act just by seeing the pattern. Smart traders wait for confirmation in the next candles. You can look for:
These signs make the pattern more trustworthy.
The hanging man candlestick pattern usually shows up after a strong uptrend, when prices have been rising steadily for some time. This is when traders start to feel confident — maybe even too confident — and that's where the market can surprise them. The pattern appears near the top of a price rally and gives a warning sign that the trend might soon reverse.
This hanging man candle pattern is a signal that selling pressure is starting to rise. Even though the price may have opened and closed near the top, the long lower shadow tells us that sellers had a strong moment during the day. If you’re seeing this hanging candlestick pattern on your chart after a bullish run, that’s your cue to get cautious — especially if the next candle confirms the signal.
Trading the hanging man candlestick isn’t just about spotting it — it’s about knowing when to enter, when to exit, and how to manage your risk. Let’s break it down step by step in a way that’s easy and useful.
1: Spot the Pattern After an Uptrend
Look for the hanging man candle after prices have been moving up for several candles. The candle should have:
2: Confirm the Pattern
Before taking any action, wait for confirmation in the next candle. This could be:
Confirmation helps reduce false signals.
Example for Confirmation: If the hanging man forms at ₹1,000, wait for the next candle to close below ₹980. If it does, it confirms that sellers are getting stronger.
3: Entry Point:
Once confirmed, you can:
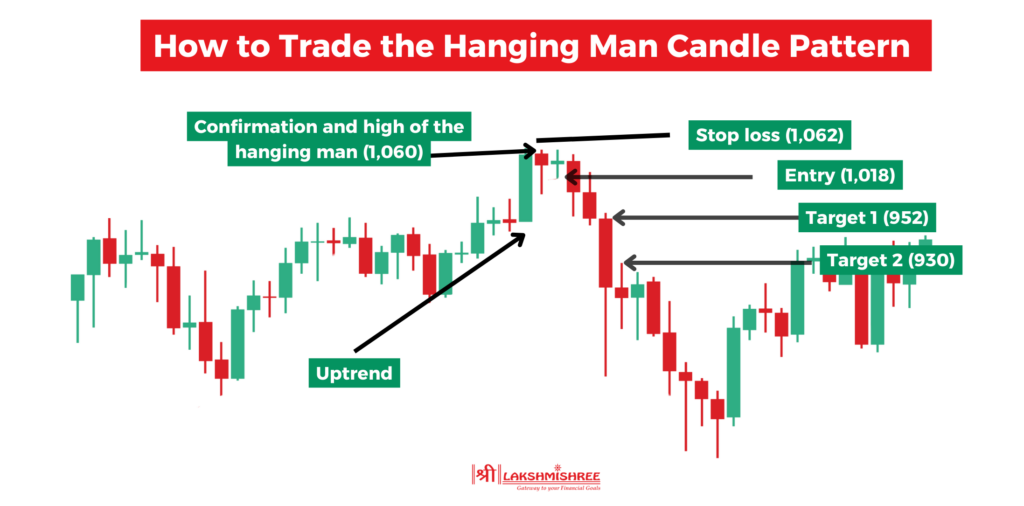
Example: Suppose you see a bearish hanging man on Infosys stock after it moved up from ₹900 to ₹1,050. The next candle closes at ₹1,020, below the hanging man’s low. You can enter a short trade at ₹1,018.
4: Stop Loss:
Always place a stop-loss to protect your trade.
Example: If your entry is at ₹1,018, and the high of the hanging man candle is ₹1,060, then your stop loss can be placed around ₹1,062 — just above that high.
5: Target/Profit Booking:
A basic target can be 1.5x to 2x your risk amount.
Example: If your stop loss is ₹44 (₹1,062 – ₹1,018), you can aim for ₹66 to ₹88 profit. So your target price can be ₹952 or ₹930.
No, the inverted hanging man candlestick is not a recognised pattern in technical analysis. Many traders mistakenly use this term when they actually mean the shooting star pattern.
The shooting star looks like an upside-down version of the hanging man. It forms after an uptrend and has a small real body near the bottom with a long upper shadow and little or no lower shadow. This shows that the price went up during the session but sellers pulled it back down, indicating a possible reversal.
So, while people may say "inverted hanging man," the correct name for this pattern is shooting star, and it is used as a bearish reversal signal.
The green hammer candlestick and the hanging man can look almost the same — both have a small body and a long lower shadow. But their meanings are completely different, and it's easy to get confused if you don’t look at where they appear in the trend.
The key difference is in the trend — not the candle colour. A green candle at the bottom could be a hammer (bullish), while a green candle at the top could be a hanging man (bearish).
The hanging man candlestick pattern has a 55-60% success rate when confirmed by the next candle and used with other indicators like volume or RSI. On its own it’s not very reliable as it can give false signals especially in strong trends. But when combined with confirmation and in the right market context it’s an early warning for a potential trend reversal. Price action and risk management traders find this pattern useful for short term trading.
The hanging man candlestick is just one of many patterns traders use to analyse market trends. Each pattern tells a different story about market psychology. Here are some of the most commonly used candlestick patterns other than the hanging man:
Each of these patterns helps traders make informed decisions when buying or selling in the market. Combining them with tools like volume, RSI, or trendlines makes them even more powerful.
The hanging man candlestick pattern is a great indicator of a potential trend reversal after a price rise. It’s not 100% accurate on its own but becomes more powerful when confirmed with other tools like volume or momentum. This pattern works best when spotted early in an uptrend that’s starting to fade.
If utilised properly, the hanging man can assist in preserving profits or getting short prior to the market reversal. Don’t rely solely on one candle alone. Wait for the subsequent candle to re-affirm and apply stop losses in order to control risk.
The hanging man candlestick pattern is a signal that appears at the top of an uptrend. It suggests that sellers have started to enter the market, which could lead to a reversal or price drop. Traders use it to spot possible turning points in the market.
The hammer appears at the bottom of a downtrend and signals a possible price rise, while the hanging man appears at the top of an uptrend and warns of a possible fall. Though they look similar in shape, their meaning depends on where they appear in the trend.
The hanging man is generally considered a bearish pattern. It shows that although buyers pushed the price up, sellers came in strong. If the next candle confirms the move, it can indicate the start of a downtrend.
The hanging man candle pattern has a success rate of around 55% to 60% when confirmed with other indicators like volume or RSI. It’s more accurate when followed by a red candle and used with proper risk management.
There is no official pattern called the inverted hanging man candlestick. What people often mean is the shooting star pattern, which appears after an uptrend and signals a possible reversal with a long upper shadow and a small lower body.
Disclaimer: This article is intended for educational purposes only. Please note that the data related to the mentioned companies may change over time. The securities referenced are provided as examples and should not be considered as recommendations.
