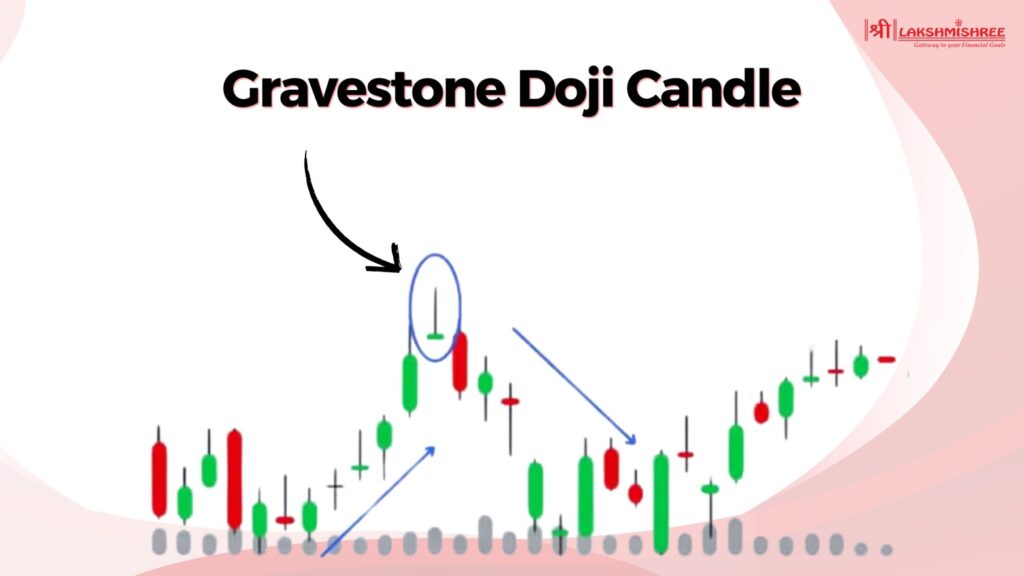
Have you ever looked at a trading chart and seen a candle with a long top line and almost nothing below? That’s what traders call a Gravestone Doji candle—and no, it's not just a fancy name. This tiny shape can actually shout loud warnings about a possible price reversal in the market. But here’s the twist: it doesn’t always mean the same thing, and reading it wrong could cost you.
In this blog, we’re going to break down the Gravestone Doji candlestick pattern in the simplest way possible. Whether you trade stocks—or you're just getting started—this guide will help you understand what this pattern means, when to trust it, and how to use it smartly.
The Gravestone Doji candlestick is more than just a strange-looking shape on a chart—it's a visual story of failed bullish momentum. In simple terms, this pattern forms when buyers try to push the price higher during a session, but by the end, sellers take over and pull the price back to where it started. The result? A candle with a long upper shadow, little to no real body, and barely any lower wick. Its appearance—like a gravestone—signals the possible “death” of the current uptrend.
Here’s what makes it important in real trading:
When used correctly, the Gravestone Doji candlestick becomes a powerful signal of shifting market sentiment. However, not every Gravestone Doji means a trend reversal is guaranteed. It's crucial to consider the broader chart structure, trend strength, and supporting indicators before making any trading decisions. Context, as always in technical analysis, is everything.
This candle stands out because of its very unique shape—it looks like a "T" turned upside down. What makes it so special is that all the major price actions—opening, closing, and low—happen near the same level, while the high shoots up during the session but doesn’t hold.
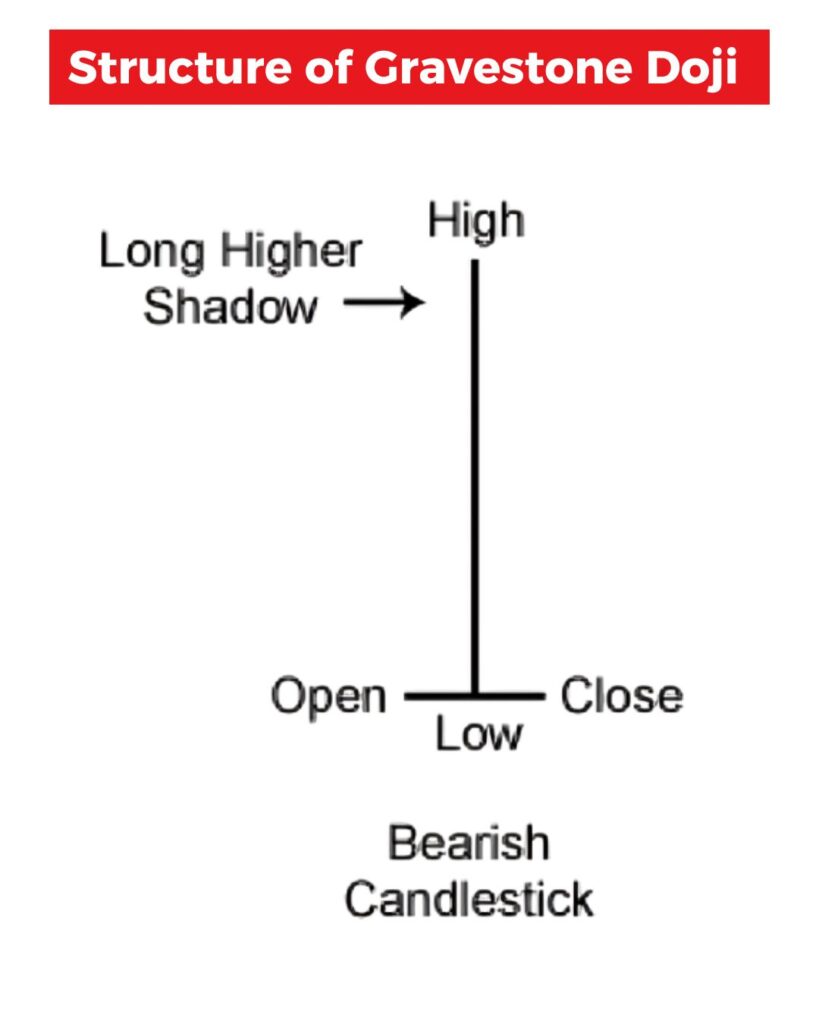
This structure doesn’t just happen randomly. It typically forms when the market is testing a resistance level, or when there's uncertainty at the top of an uptrend.
To identify a Gravestone Doji like, you need to look at the trend, the location of the candle, and use a few smart technical indicators for confirmation. Here’s how to do it step-by-step:
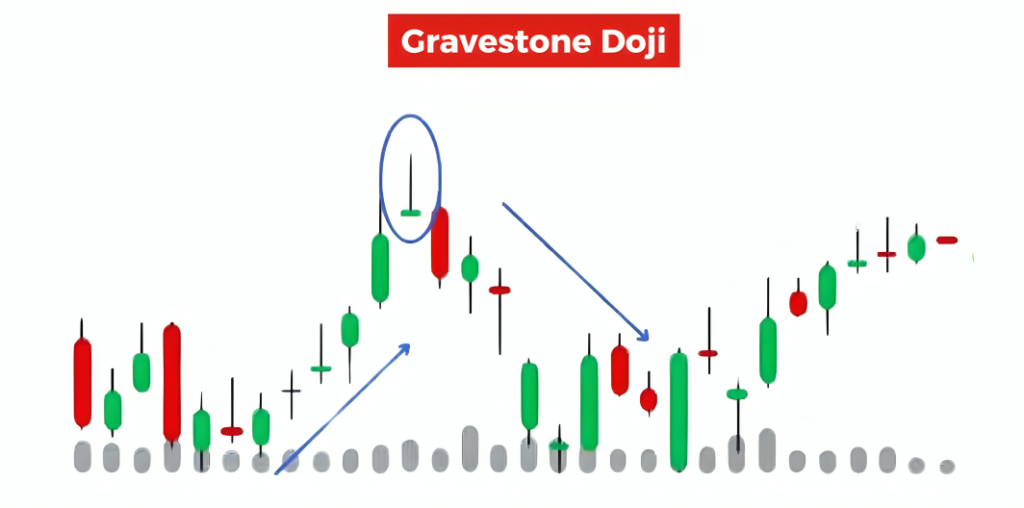
The Gravestone Doji pattern is most meaningful when it appears after a strong upward move. This is where it acts as a potential trend reversal signal. If the price has been rising for several sessions and suddenly prints this candle near a recent high or resistance level, it’s your first sign of a possible shift.
Now, look closely at the candle:
Volume plays a big role in confirming whether the pattern has weight. If the Gravestone Doji forms with higher-than-usual trading volume, it shows strong rejection of higher prices. This makes the pattern more reliable.
To avoid false signals, combine the pattern with one or more technical indicators:
Don’t make a decision based on the Gravestone Doji alone. Always wait for the next candle to confirm the direction. If the next candle is bearish and closes below the Gravestone Doji’s open, that’s a stronger sign that a trend reversal may have started.
At first glance a Gravestone Doji in a downtrend looks like just another pause before the price continues to fall. But in reality it can mean two things: either a bounce is about to happen or the trend is getting stronger. The key is to look at the candle and what happens next.
If the pattern appears after a series of bearish candles and the Gravestone Doji is a failed attempt by buyers to push the price up then it means sellers are still in control. This is a bearish continuation not a reversal.
But if the candle appears at a support level or after a long trend then it could be indecision where both buyers and sellers are unsure what’s next. But don’t jump to conclusions—the Gravestone Doji alone is not strong enough to be a change of direction here. Always wait for the next candle to confirm if it’s just a false alarm or a real red flag.
In general a Gravestone Doji is bullish when it appears after a downtrend, especially at a major support level or zone of interest. Here’s the logic: even though sellers pulled the price back down, the fact that buyers were able to push it up during the session shows buying pressure building. If the next candle opens higher or forms a bullish engulfing pattern, this could be an early sign of reversal—but only with confirmation.
So is it reliable? Not always. The truth is this setup is weak on its own. Unlike the Dragonfly Doji (a more bullish reversal pattern), the Gravestone Doji doesn’t give a strong buy signal unless the bigger picture is in your favour. That’s why many traders see it as a fluke unless backed by volume, support levels or additional bullish indicators like MACD crossover or RSI bounce from oversold.
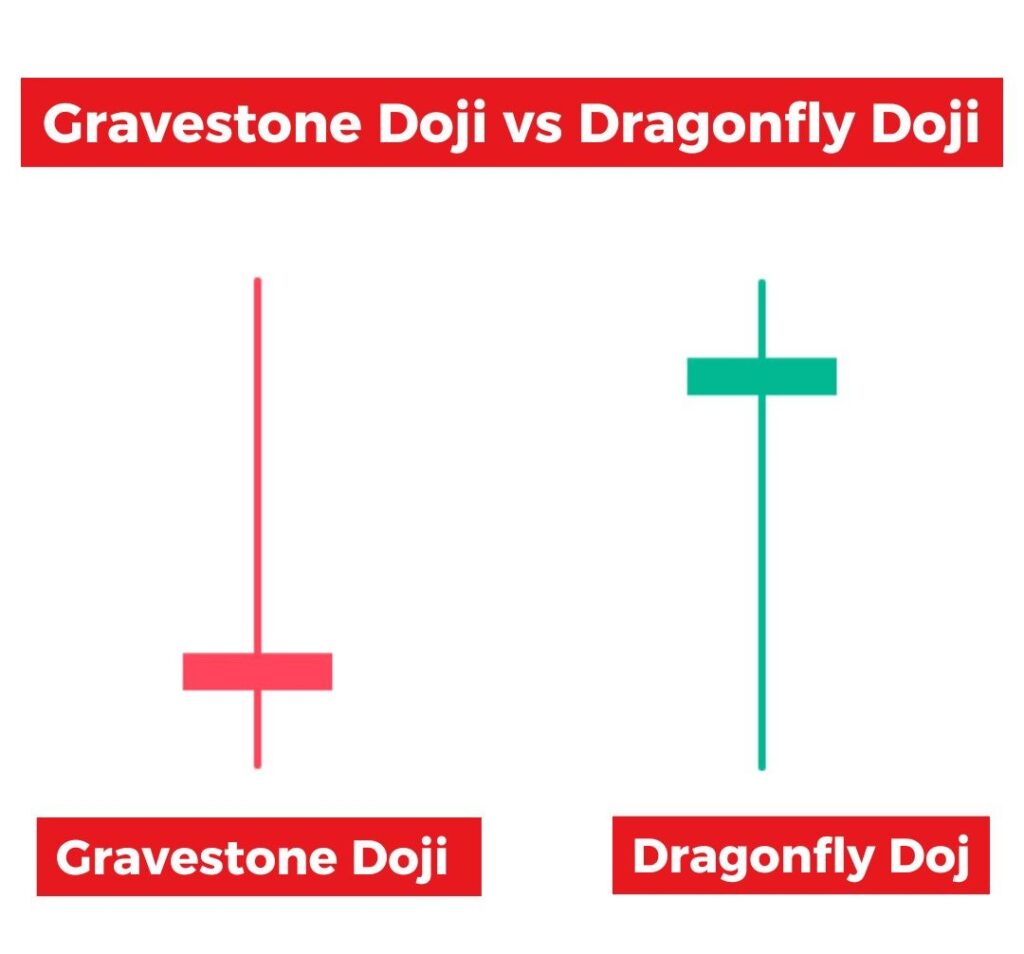
The Gravestone Doji and Dragonfly Doji may look similar at first glance, but they tell two very different stories in technical analysis. While both are single-candle patterns that reflect market indecision, their shapes, meanings, and market implications are completely opposite.
Here’s a quick breakdown to help you clearly distinguish between them:
| Feature | Gravestone Doji | Dragonfly Doji |
|---|---|---|
| Shape | Long upper shadow, no/little body, no lower shadow | Long lower shadow, no/little body, no upper shadow |
| Market Sentiment | Bearish reversal or continuation | Bullish reversal or continuation |
| Common Location | Appears after an uptrend or near resistance | Appears after a downtrend or near support |
| Indicates | Buyer rejection, selling pressure takes over | Seller rejection, buying pressure builds up |
| Confirmation Needed? | Yes, next bearish candle strengthens signal | Yes, next bullish candle strengthens signal |
| Ideal With Other Indicators? | RSI, MACD, volume | RSI, MACD, volume |
Many traders spot the pattern but miss out on the context or data that turns it into a reliable signal. In this section, we’ll show you exactly how to trade it step-by-step, along with a real chart-based example using practical numbers you can visualise on your own charts.
Step-by-Step Strategy to Trade the Gravestone Doji
1. Identify the Pattern in the Right Spot
Look for the Gravestone Doji after a strong uptrend—ideally near a known resistance level, supply zone, or a round number that the price is struggling to cross. The candle should have a long upper wick and almost no real body, with opening and closing prices near the low.
2. Confirm with Indicators
Use tools like RSI, MACD, and volume to confirm the pattern’s strength. If RSI is above 70 (overbought zone), and MACD shows a bearish crossover, that’s a strong confirmation. A spike in volume during the Gravestone Doji’s formation means there’s heavy rejection at higher levels.
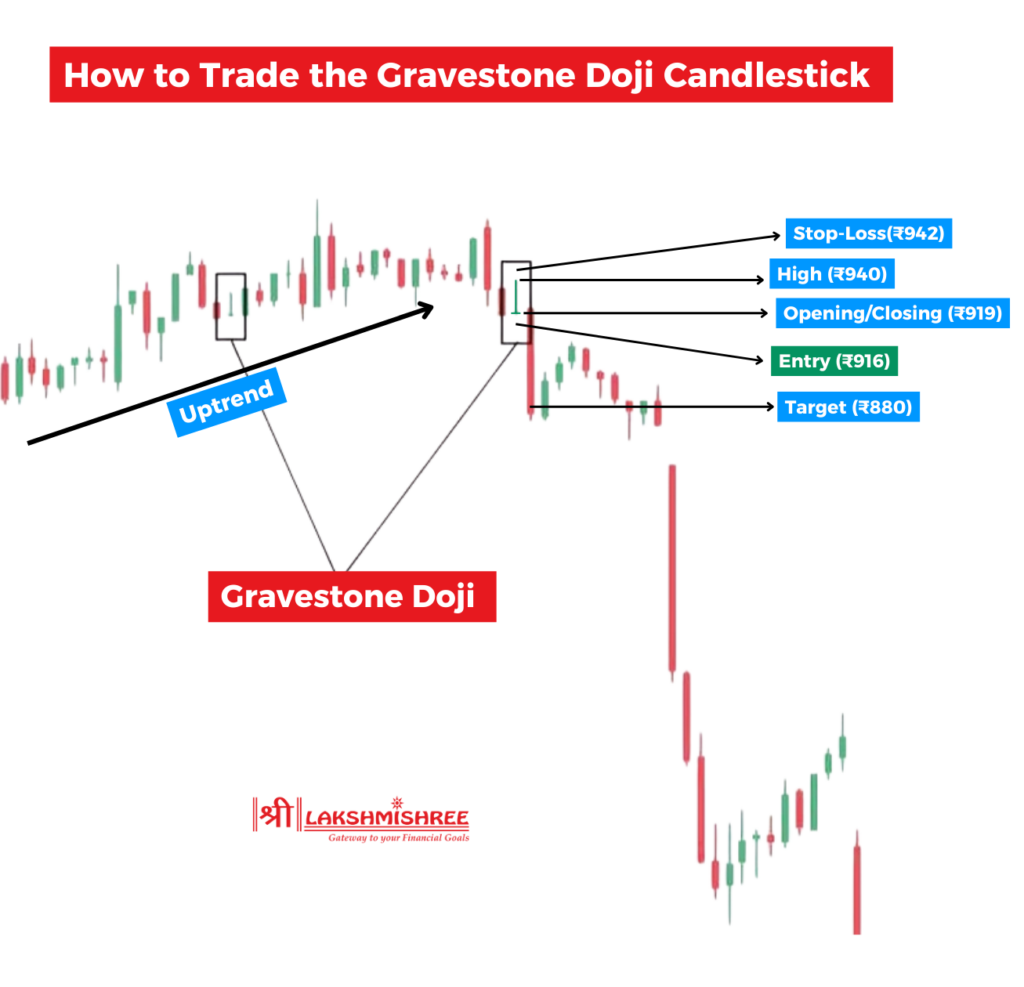
3. Set the Trade Plan (With Example)
Let’s say you’re watching Tata Motors stock on the daily chart.
Here’s how a professional trader might plan this trade:
If volume and bearish follow-up continue, you could even trail your stop and extend your target to ₹865 or lower.
Below are some key limitations you should be aware of before placing your next trade:
The Gravestone Doji doesn’t behave the same way across all types of market environments. Understanding how it reacts in different scenarios can save you from entering weak trades and help you focus only on the high-probability setups. Here’s how the pattern performs based on market context:
1. Trending Markets – Most Reliable Scenario
In a strong uptrend, a Gravestone Doji appearing at or near a resistance level is a major warning sign. It suggests that buyers are losing steam, and sellers are starting to take over. This is where the pattern is most effective, especially if it’s followed by a bearish candle.
2. Sideways or Range-Bound Markets – Less Effective
In flat markets where price is moving sideways, the Gravestone Doji loses its reliability. There’s no clear trend for it to reverse, and the price may continue to range instead of falling.
3. High-Volatility Markets – Stronger Signal
In volatile markets with large price swings and heavy volume, a Gravestone Doji can act as a powerful signal, especially after a sharp upward move. The strong rejection from higher levels is more meaningful when the market is active.
4. Low-Volatility Markets – Weak Signal
In quiet markets with low price action and minimal volume, the Gravestone Doji is often just noise. It may look like a reversal but doesn’t carry enough momentum to trigger a real trend shift.
A Gravestone Doji indicates a potential bearish reversal, especially when it forms after an uptrend. The long upper shadow shows that buyers pushed prices higher during the session, but sellers managed to bring it back down to the opening level, signalling weakness in buying momentum and a possible shift in market sentiment toward the downside.
The opposite of a Gravestone Doji is the Dragonfly Doji, which has a long lower shadow and no upper wick. It typically forms at the bottom of a downtrend and signals a potential bullish reversal, showing that sellers drove the price down but buyers pushed it back to the opening price, indicating growing buying strength.
The Gravestone Doji candlestick doesn’t appear frequently on charts, making it a relatively rare pattern. It typically occurs at key resistance levels or after extended uptrends and is more noticeable on longer timeframes like daily or weekly charts, where market sentiment shifts are more meaningful.
The Gravestone Doji’s accuracy in technical analysis depends heavily on its context—it's more reliable when it forms after a strong uptrend and is supported by other indicators like high volume, RSI divergence, or MACD crossover. On its own, it’s not highly accurate, but when confirmed with additional signals, it becomes a valuable tool for predicting short-term reversals.
The Gravestone Doji candlestick pattern is a powerful technical analysis tool that signals potential trend reversals, especially after a strong uptrend. It visually captures a shift in market sentiment, where buyers lose momentum and sellers begin to take control. But like any pattern, its strength lies in the context. When combined with indicators such as RSI, MACD, and volume analysis, the Gravestone Doji becomes far more reliable and actionable for traders.
A Gravestone Doji candle represents indecision in the market that leans bearish. It forms when the open, low, and close prices are almost the same, with a long upper wick—indicating that buyers pushed the price up but couldn’t sustain it, allowing sellers to bring it back down by the close.
The Gravestone Doji is generally considered a bearish reversal signal, especially when it appears after a significant uptrend. It shows that upward momentum is weakening and a potential trend reversal to the downside may be near.
No, a Gravestone Doji doesn’t have to be red. The color of the candle (red or green) is not as important as the shape. What matters is that the open and close prices are near the low of the session, and there's a long upper shadow, indicating heavy rejection from higher levels.
A Doji can be either bullish or bearish, depending on its type and the market context. While a Gravestone Doji leans bearish, a Dragonfly Doji leans bullish. Standard Dojis suggest indecision and are neutral unless confirmed by other technical signals.
A good Gravestone Doji candle strategy involves identifying the pattern after an uptrend, confirming it with indicators like RSI or MACD, and entering a trade only after a confirming bearish candle appears. Traders usually place a stop-loss above the high of the Doji and target the next support zone for profit.
Disclaimer: This article is intended for educational purposes only. Please note that the data related to the mentioned companies may change over time. The securities referenced are provided as examples and should not be considered as recommendations.
