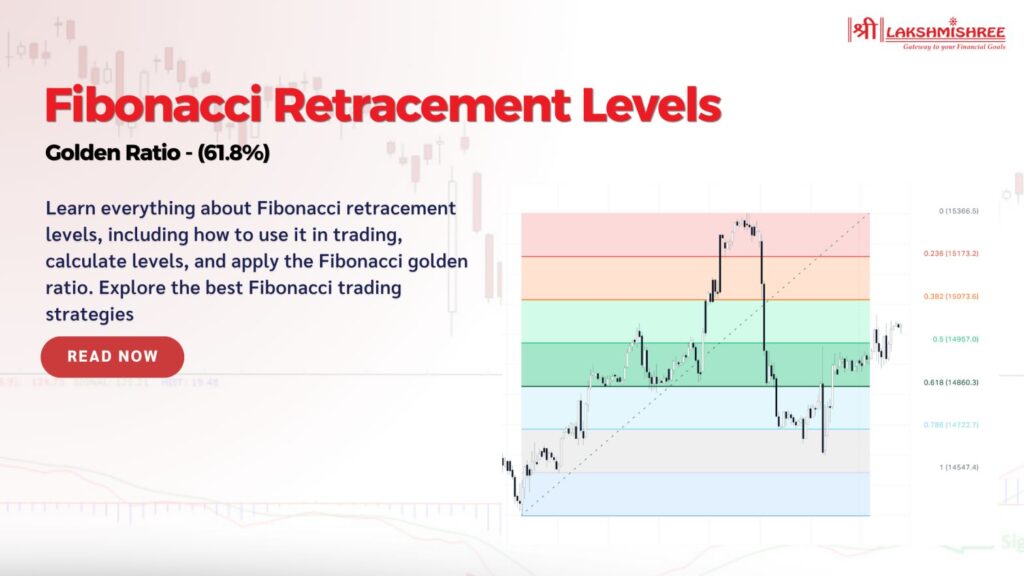
Many traders often face the problem of deciding when to enter or exit a trade. Stocks can rise and fall quickly, leaving you unsure when the price might change direction. Making a wrong move at these moments can lead to losses. That’s where Fibonacci Retracement Levels come in handy.
This tool helps you find key levels on a stock chart where the price is likely to reverse or take a break. Using Fibonacci retracement, you can better plan your trades and avoid costly mistakes. This blog will explore how this simple yet powerful tool can help you read stock price movements more accurately.
Fibonacci Retracement is a technical analysis tool that helps traders find potential reversal points on a stock chart. It is based on the famous Fibonacci sequence, which dates back to the work of Italian mathematician Leonardo Fibonacci. Interestingly, the sequence was introduced to Europe after being learned from Indian mathematicians, showing its deep-rooted history in mathematics.
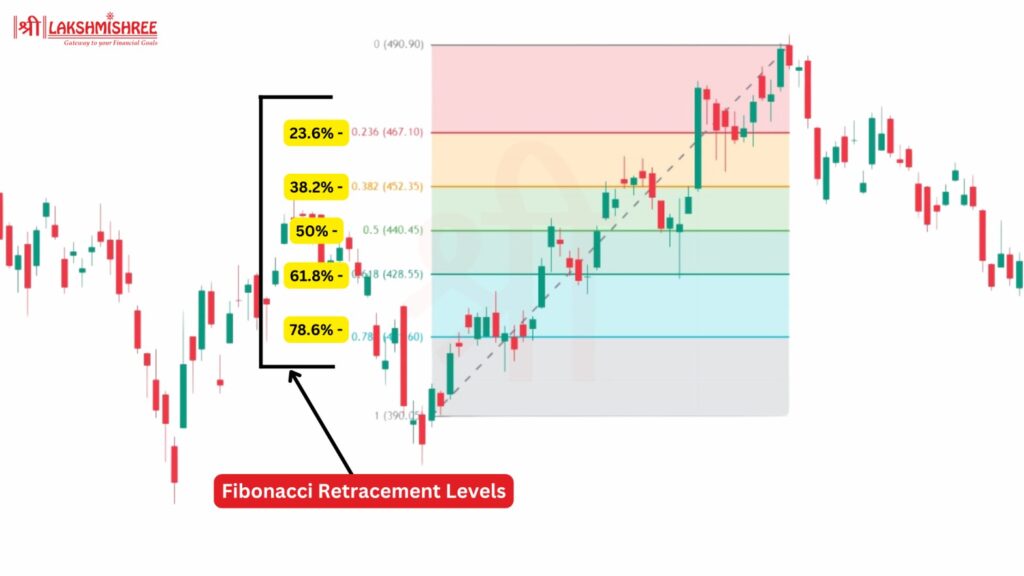
The Fibonacci sequence follows a simple pattern: each number is the sum of the previous two, such as 0, 1, 1, 2, 3, 5, 8, and so on. However, the ratios derived from these numbers matter most in stock trading. These ratios, especially 61.8%, 38.2%, and 23.6%, are key retracement levels that help traders predict where a stock’s price might reverse after a strong move up or down.
Fibonacci retracement helps traders spot potential buy or sell points by identifying key support and resistance levels during price corrections. It doesn’t tell you the exact price where the market will turn, but it gives you a solid guide to make smarter decisions.
Fibonacci Retracement Levels are percentage points on a stock chart, calculated using the high and low of a stock's recent price movement. The most commonly used Fibonacci retracement levels are 23.6%, 38.2%, 50%, and 61.8%.
These levels are drawn as horizontal lines and can act as support or resistance zones. For example, if a stock rises from ₹100 to ₹200, and you notice the price pulling back, the 61.8% retracement level would be at ₹138.2. This level might indicate where the stock will stabilise before continuing its trend.
Each Fibonacci Retracement Level Explained:
Finding Fibonacci retracement levels on a price chart is straightforward. These levels help traders identify where a stock might reverse or pause during its movement. Here's how you can find them:
With this, you can quickly identify key areas on the chart where the stock might retrace, bounce back, or continue its trend. These levels help plan entries, exits, and stop-loss points more confidently.
Fibonacci retracement levels help traders identify potential buy and sell zones based on past price movements. Here’s how you can use them effectively:
Wait for the stock to retrace to a key level (like 38.2% or 61.8%). It might be a good opportunity to buy if the stock shows signs of reversing at these levels.
Place your stop-loss slightly below the Fibonacci retracement level you entered. For example, if you bought at the 50% retracement level, set your stop-loss below the 61.8% level to minimise potential losses.
Use Fibonacci retracement with tools like RSI or moving averages to confirm signals. If the retracement level aligns with oversold conditions or trendline support, it strengthens the trade setup.
Once the price starts moving in your favour, set profit targets at the next Fibonacci level or use Fibonacci extension levels to identify where the stock might head next.
Key Tip: Always combine Fibonacci retracement with other indicators for a stronger strategy, which works best when confirmed with additional signals.
While most trading platforms automatically calculate Fibonacci retracement levels, understanding how these levels are derived can give you deeper insights into the tool’s use.
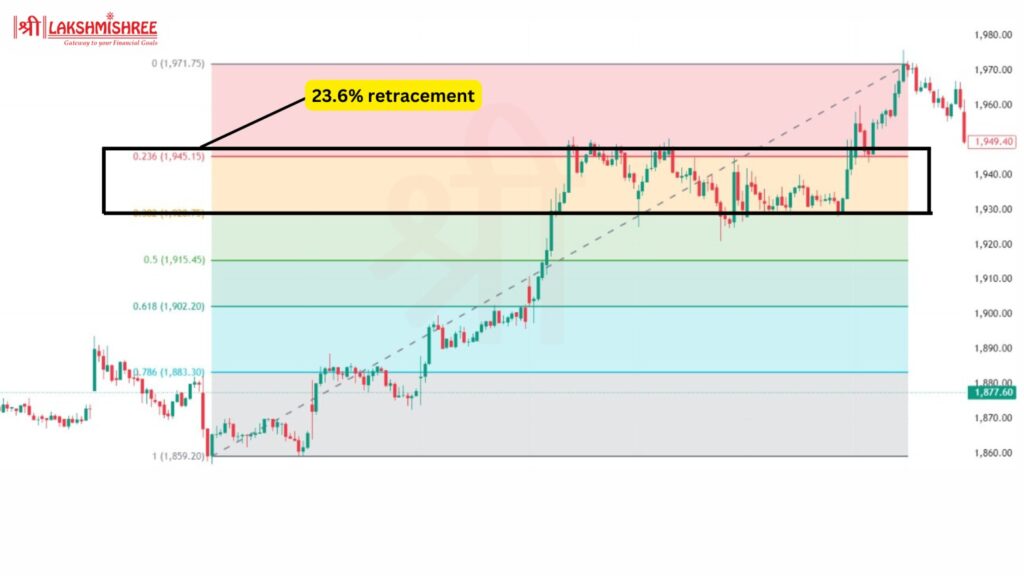
These levels act as potential support points where the price might reverse during a pullback.

Using Fibonacci retracement levels is a powerful strategy, especially when combined with other technical indicators. Let's explore some of the best Fibonacci trading strategies you can apply to the Indian stock market.
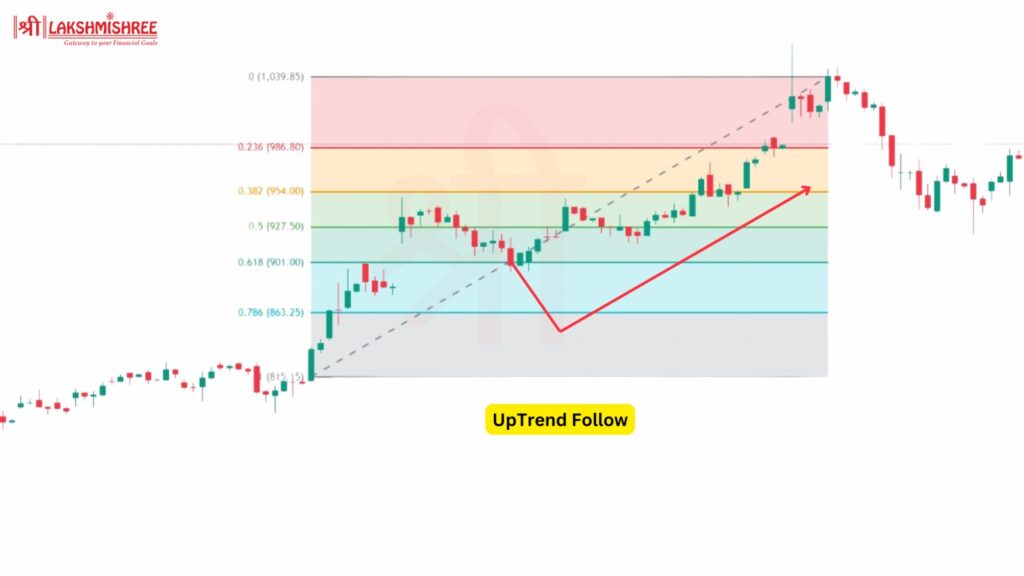
This is one of the most common strategies for trading in the direction of the trend. Here's how it works:
Example:
If Tata Motors is in an uptrend, and the stock moves from ₹400 to ₹500 before retracing to the 61.8% level (₹438), it could be a good point to enter the trade if the stock starts bouncing back upwards.
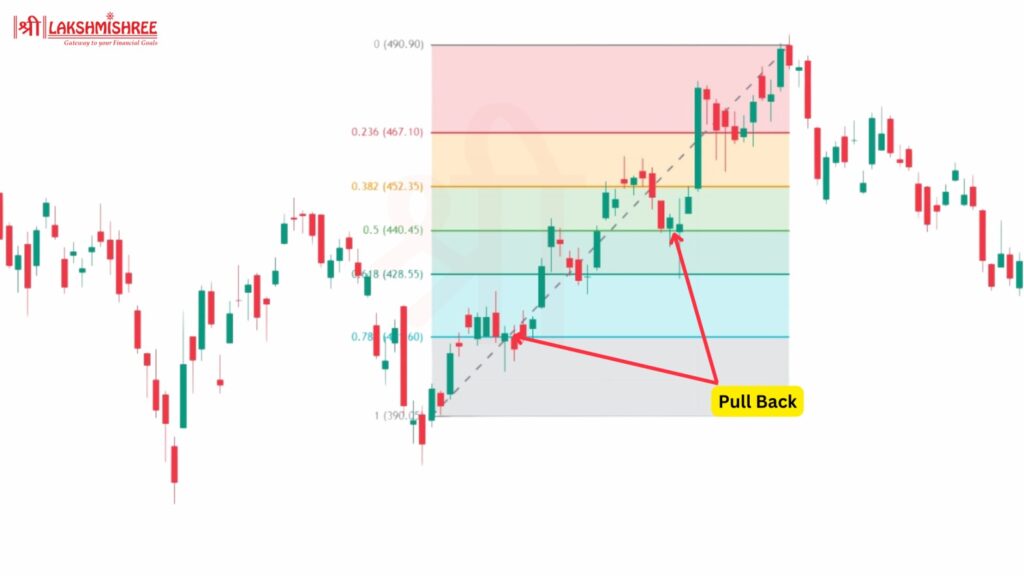
A pullback strategy involves entering a trade when the stock temporarily reverses against the trend and hits a Fibonacci level before continuing in the same direction. In this case, Fibonacci retracement helps you identify when the pullback is likely to end.
Example:
If Reliance Industries is trending upward from ₹2,000 to ₹2,500, and it pulls back to ₹2,320 (38.2% retracement), you might consider this an entry point if the stock shows bullish signals.
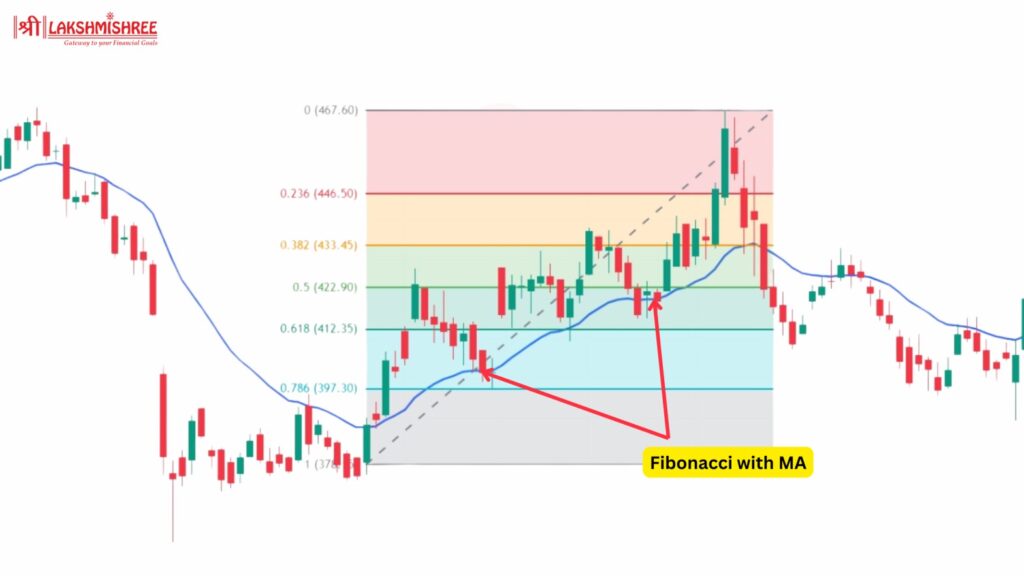
Combine Fibonacci retracement levels with moving averages (MA) to increase your chances of a successful trade. Moving averages help smooth out price data and confirm the trend direction.
This strategy involves looking for confluence, or overlap, of multiple Fibonacci retracement levels from different price swings. The more Fibonacci levels that align in the same area, the stronger the support or resistance.
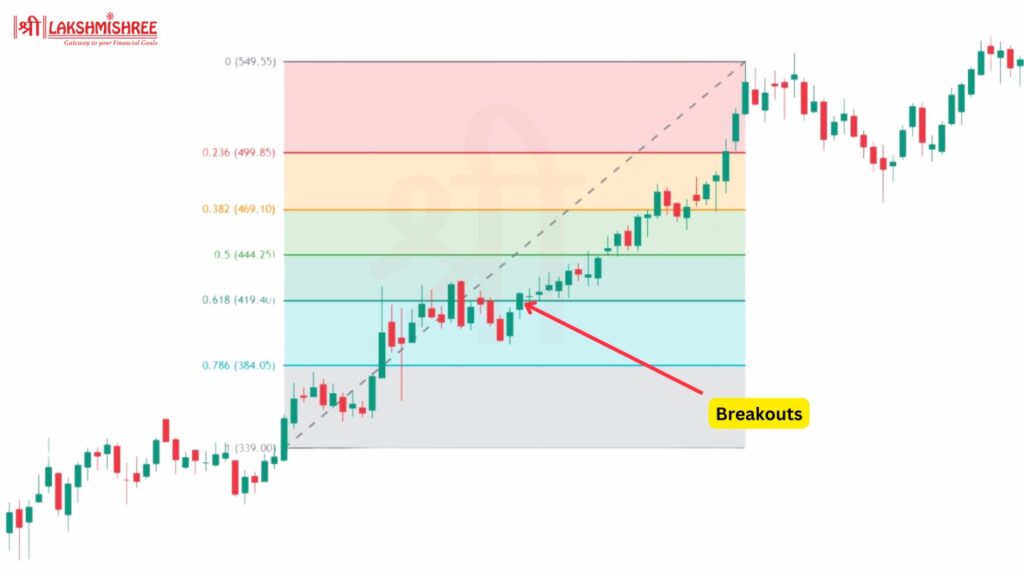
Fibonacci retracement levels are used in a breakout strategy to identify potential take-profit points. Once a stock breaks through a key Fibonacci level, it may continue its trend aggressively.
Example:
If HDFC Bank is retracing and breaks above the 61.8% level, it could signal the stock is ready to continue its uptrend. You could enter the trade and set your target at the next Fibonacci level or an extension point.
The Fibonacci sequence is a series of numbers where each number is the sum of the two preceding ones. It starts from 0 and 1, then continues as 0, 1, 1, 2, 3, 5, 8, 13, 21, and so on. This sequence appears in nature (like flower petals and shells) and is widely used in stock market analysis. The ratio between numbers in this series, especially 61.8%, forms the basis for Fibonacci retracement levels used by traders to spot support and resistance in price movements.
While Fibonacci retracements identify potential support and resistance levels during price pullbacks, Fibonacci extensions are applied to project how far a stock might move beyond its current trend. Both tools are useful in different stages of a trend, but they serve distinct purposes: retracements help during corrections, while extensions guide future price targets after a breakout or continuation.
Here’s a simple comparison:
| Aspect | Fibonacci Retracement | Fibonacci Extension |
|---|---|---|
| Purpose | Identifies potential support and resistance during pullbacks | After the breakout to predict the next move's extent |
| Key Levels | 23.6%, 38.2%, 50%, 61.8%, 78.6% | 100%, 127.2%, 161.8%, 200%, and more |
| Used In | Price corrections or reversals | Trend continuation or setting future price targets |
| When to Use | After significant moves to spot pullbacks | After breakout to predict the next move's extent |
| Application | Buying on dips, selling at resistance | Estimating where the price will go after a trend resumes |
While Fibonacci retracement levels are useful, they come with certain limitations that traders need to be aware of:
The Golden Ratio is a fascinating mathematical concept derived from the Fibonacci sequence. This ratio, approximately 1.618, is observed when any number in the sequence is divided by the previous number (as the series progresses). In technical terms, this ratio is known as Phi (φ), and it’s considered the most important part of Fibonacci's work due to its recurring appearance in nature, art, and even the stock market.
In nature, this Golden Ratio can be seen in everything from the arrangement of leaves on a stem to the pattern of sunflower seeds. For example, each seed in a sunflower is 0.618 of a turn away from the last, creating a spiral that follows this mathematical principle. Human anatomy also adheres to this ratio; for instance, the length of your forearm compared to your hand is often close to the ratio of 1.618.
In stock trading, the Golden Ratio forms the foundation of key Fibonacci retracement levels, particularly the 61.8% retracement level, which many traders use to predict where the stock price might reverse or consolidate. This ratio isn't just a mathematical curiosity; it’s a core concept in technical analysis, helping traders make informed decisions by identifying potential support and resistance levels.
In trading, the Golden Ratio (61.8%) is a key retracement level used to predict where a stock might reverse. For example, if a stock rises from ₹100 to ₹200, traders may expect a retracement to the 61.8% level or ₹138.2. This level often acts as support, where the price stabilizes before continuing its trend. Similarly, 38.2% and 50% are other critical levels derived from the
Fibonacci Retracement Levels are an essential tool for traders looking to predict potential price reversals or continuations. Traders can identify potential entry and exit points by applying 23.6%, 38.2%, and 61.8% to a stock's price movement. However, these levels work best with other technical indicators and market trends. Understanding how to use Fibonacci Retracement Levels effectively can greatly enhance your decision-making in stock trading.
Fibonacci Retracement Levels are horizontal lines on a price chart that help traders identify potential support and resistance areas based on the Fibonacci sequence.
Traders use Fibonacci retracement levels to predict potential price pullbacks during an uptrend or downtrend. These levels help determine entry and exit points in trades.
The 61.8% level, derived from dividing numbers in the Fibonacci sequence, is seen as a critical level where price tends to find strong support or resistance in financial markets.
Yes, Fibonacci retracement levels can be applied to any stock or financial instrument where price movements are visible, making it versatile for all markets.
Fibonacci levels are helpful guides but are not always precise. They work best when combined with other indicators, such as moving averages or trendlines.
Disclaimer: This article is intended for educational purposes only. Please note that the data related to the mentioned companies may change over time. The securities referenced are provided as examples and should not be considered as recommendations.
