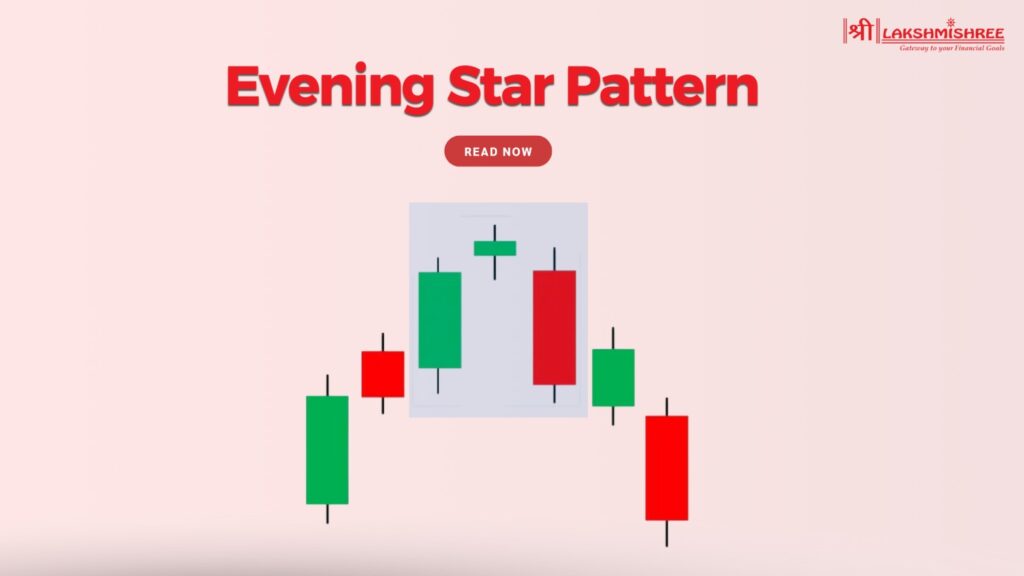
Do you want to know how to spot when a market might reverse? The Evening Star Pattern is one of the most popular candlestick patterns used to predict a trend reversal from up to down. Whether you’re new to trading or already familiar with technical analysis, this pattern can be a great addition to your trading arsenal.
In this Blog we’ll break down the Evening Star Candlestick Pattern step by step, covering its structure, variations and how to trade it. If you want to know how this bearish reversal pattern works and how it can help you make better trading decisions then you’re in the right place.
The Evening Star is a bearish reversal pattern in technical analysis that traders use to spot potential downturns. It forms at the end of an uptrend, meaning the buying momentum is fading and selling pressure is taking over. This pattern is recognized in stocks and cryptocurrency so it’s a great tool for beginners and experienced traders.
The Evening Candlestick is 3 candles that tell a story of market psychology. It starts with a strong bullish candle showing buyers are optimistic. Then, a small-bodied candle (often called the “star”) shows market indecision. Finally, a long bearish candle shows sellers are in control and the price is decreasing. Understanding this pattern helps traders anticipate a reversal and prepare for short positions or risk management.
The Evening candlestick star pattern is a 3 candle formation that visually shows a bearish reversal. Each candle in this pattern is important in showing the change in market sentiment from bullish to bearish. Here’s a breakdown:
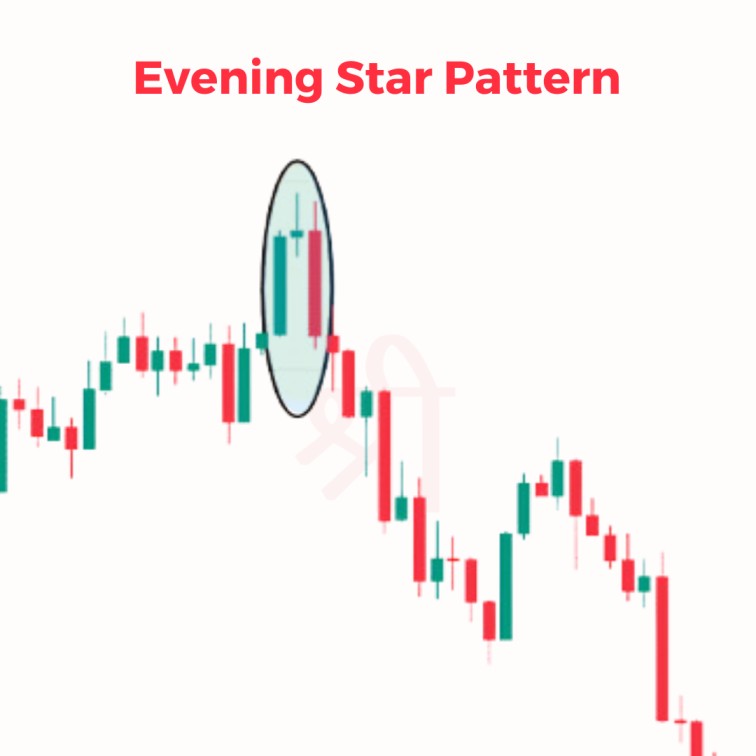
1. First Candle (Bullish Candle):
2. Second Candle (The Star):
3. Third Candle (Bearish Candle):
Trading the Evening candlestick pattern requires identifying, confirming, and trading. Here’s a simple way to trade this bearish reversal pattern:
1. Spot the Evening Star Pattern
2. Confirm the Signal
3. Execute the Trade
4. Manage Risk
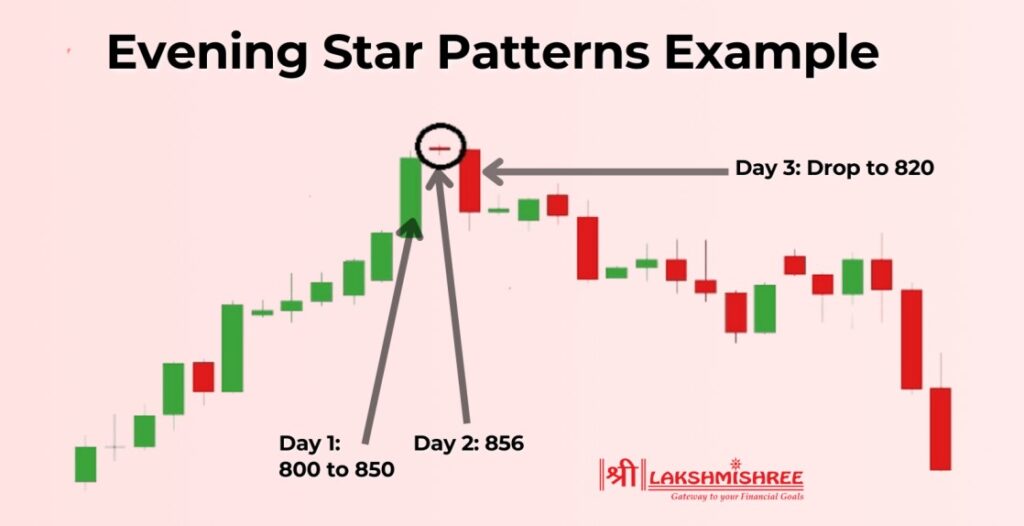
Let’s take an example of the Evening candlestick Star pattern in the XYZ Ltd. stock chart over 3 trading sessions. On the first day, a long green candle forms as buyers are in control, the price moves up from 800 to 850, and there is strong bullish momentum and optimism.
On the second day a smaller candle forms, indicating indecision in the market. The price opens at 855 and touches 860 but closes lower at 856. Buyer momentum is slowing down, and sellers are emerging.
Finally, a long red bearish candle forms on the third day as selling pressure increases. Price drops to 820 and closes below the midpoint of the first green candle, confirming the Evening Star pattern.
Traders and analysts use this pattern to indicate a bearish reversal. In this case, the Evening candlestick tells us the trend is losing momentum, so traders should either exit longs or short.
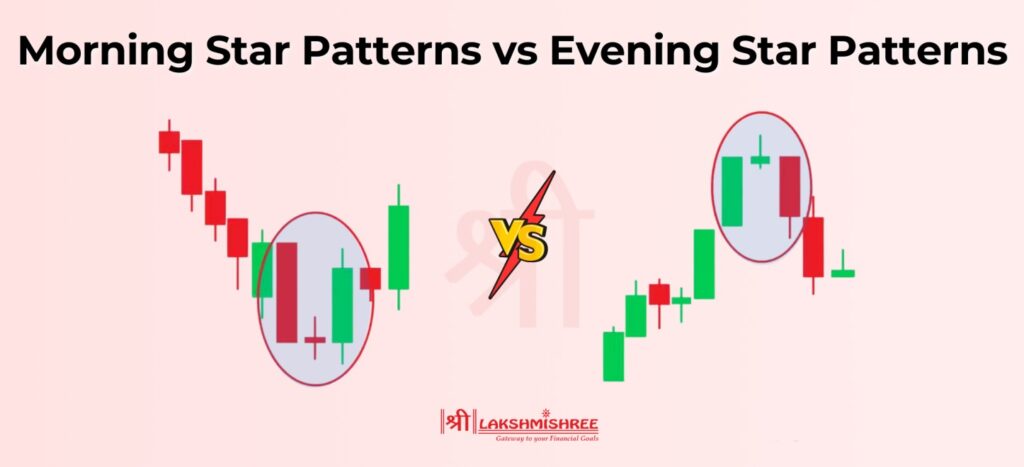
The morning star and evening star patterns are mirror images of each other, opposite market conditions and reversals. Morning Star is a bullish reversal candlestick pattern, the end of a downtrend and the start of an uptrend. Evening candlestick is a bearish reversal candlestick pattern, the end of an uptrend and the start of a downtrend.
To make it simpler, here’s a table comparing the Morning Star and Evening Star candlestick patterns:
| Feature | Morning Star Pattern | Evening Star Pattern |
|---|---|---|
| Market Context | Forms during a downtrend | Forms during an uptrend |
| Trend Reversal Signal | Signals a bullish reversal | Signals a bearish reversal |
| First Candle | Long red (bearish) candle | Long green (bullish) candle |
| Second Candle | Small-bodied candle (neutral, green, or red) | Small-bodied candle (neutral, red, or green) |
| Third Candle | Long green (bullish) candle | Long red (bearish) candle |
| Closing Level of Third Candle | Closes above the midpoint of the first candle | Closes below the midpoint of the first candle |
Evening Star pattern takes exactly 3 trading days to fully form on a daily chart. Each day represents one of the 3 candles in the pattern—strong buying pressure, then indecision and finally bearish reversal.
This time frame is the same for all daily charts, as each candle represents one trading day. The pattern is only valid after the 3rd candle closes below the midpoint of the first bullish candle, so traders should wait for this confirmation before taking action to avoid false signals.
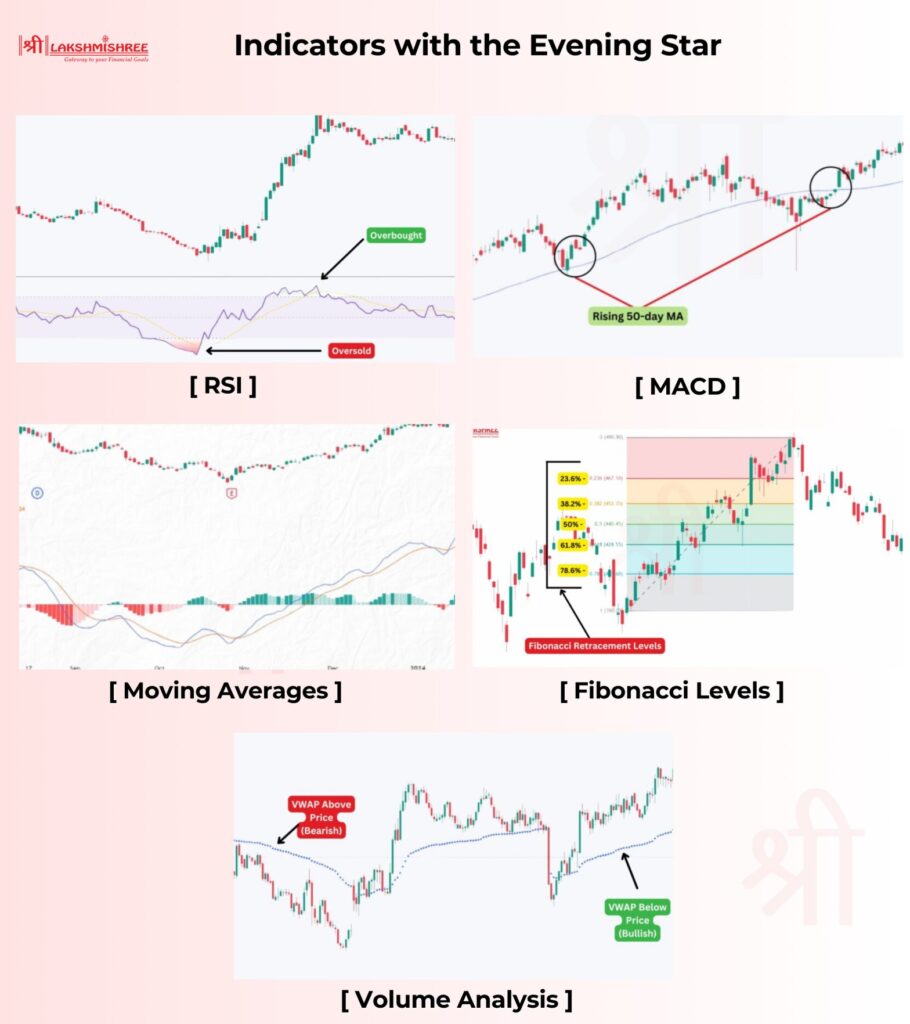
The Evening candlestick star pattern is more powerful when combined with technical indicators. These additional tools provide confirmation and make the pattern more reliable so you can avoid false signals. Here are some advanced techniques:
Pros
Cons
The Evening candlestick has a success rate of around 70% when used correctly. It’s even more accurate with additional tools like resistance levels or technical indicators like RSI or MACD.
For example, when the Evening Star forms near a resistance level, it attracts more sellers, and the price reversal is stronger. However, while the pattern is good at signalling reversals, the next move after the reversal may not always reach the price target. Studies show there’s only about a 50% chance of hitting the price target after the reversal, so use this pattern cautiously and always use risk management.
No, the Evening candlestick is not bullish, it’s a bearish reversal pattern. This pattern indicates a trend change from up to down, sellers are in control of the market. Traders use it to predict bearish prices, to short or get out of long positions.
Evening Star pattern is a bearish reversal pattern and Hanging Man is a bearish pattern but they are different in structure and context. Evening Star is a 3 candle-bearish reversal pattern that forms at the top of an uptrend. It’s a strong momentum shift from buyers to sellers, so it’s a good indicator of a downtrend.
Hanging Man is a single candle pattern that forms during an uptrend. Although it’s bearish, confirmation is needed from the next candles. Unlike Evening candle, Hanging Man’s effectiveness largely depends on its position in the trend and volume.
The Evening Star candlestick pattern is a bearish reversal pattern that helps you spot trend reversals and get short. The three-candle shape is clear when buyers lose control, and sellers take over. But it’s much more reliable with key resistance levels, volume and technical indicators like RSI or MACD. By learning the Evening candlestick Star pattern you can make better decisions and manage risk in a bear market. Always backtest and confirm before you trade.
The Evening Star candlestick pattern is a bearish reversal pattern that forms at the end of an uptrend. It consists of three candles: a long bullish candle, a small-bodied "star" candle indicating indecision, and a long bearish candle that closes below the midpoint of the first candle.
To trade the Evening Star candlestick pattern, follow these steps:
1. Identify the pattern at the end of an uptrend.
2. Wait for confirmation, such as a break below the low of the third candle.
3. Use technical indicators like RSI or MACD to validate the signal.
4. Enter a short trade and place a stop-loss above the high of the second candle.
5. Target nearby support levels or use a risk-reward ratio of 1:2 for take-profit.
The Morning Star pattern is a bullish reversal pattern that appears during a downtrend, while the Evening Star pattern is a bearish reversal pattern that forms during an uptrend. Both patterns consist of three candles, but their market implications are opposite.
No, the Evening Star pattern does not always work. Its reliability depends on market conditions and the presence of confirmation signals, such as resistance levels or volume spikes. While the pattern has an approximate success rate of 70%, traders should use it alongside other technical tools and risk management strategies to minimise false signals.
Yes, the Evening Star candlestick pattern can be used for intraday trading, but it is more reliable on higher timeframes like daily or weekly charts. If intraday is used, traders should confirm the pattern with additional indicators like RSI or volume and focus on key intraday resistance levels to improve accuracy.
Disclaimer: This article is for educational purposes only and should not be considered financial advice. Always conduct your research and consider consulting with a financial advisor before making any investment decisions.