Are you tired of missing out on market trends or struggling to make sense of price movements? You’re not alone! Understanding where the market is headed can feel like reading tea leaves for many traders. But here’s where the EMA indicator comes in handy. The Exponential Moving Average (EMA) is a powerful tool that helps traders cut through the noise and spot trends faster.
In this blog, we’ll dive deep into what makes the EMA indicator so special, why it’s trusted by traders worldwide, and how you can use it to up your trading game. Ready to discover how it can make your trading decisions sharper? Let’s get started!
The EMA indicator is a technical tool that smooths out price movements by giving more weight to recent data. Unlike the Simple Moving Average (SMA), EMA reacts quickly to price changes, making it ideal for short-term trading. It helps traders track price trends over a set period, which can be useful for spotting emerging trends and making timely decisions in fast-moving markets.
The EMA indicator is a versatile tool that helps traders identify the overall trend direction by reacting swiftly to recent price changes. It’s especially valuable for traders who want to catch trends early. For instance, when the EMA line trends upward, it suggests a potential uptrend, indicating that buying pressure is increasing. Conversely, a downward-trending EMA signals a possible downtrend, hinting that selling pressure might be taking over.
Traders often look at EMA crossovers for entry and exit signals. A crossover occurs when a short-term EMA (like a 9-day) crosses above or below a longer-term EMA (like a 50-day). These crossovers can highlight shifts in momentum and help traders align their decisions with the current trend. For example:
Additionally, the EMA can act as a dynamic support or resistance level. During an uptrend, prices may "bounce" off the EMA line, suggesting it as a support level. In a downtrend, the EMA often acts as resistance, with prices struggling to break above it. This makes the EMA useful for identifying trends and spotting potential areas where price reversals could occur.
Popular time frames for the EMA indicator include:
Choosing the right timeframe depends on your trading style and market goals.
The EMA indicator is a versatile tool that can be applied in various ways to enhance trading decisions. Here’s how EMA can assist traders across multiple areas:
No, the EMA indicator and Exponentially Weighted Moving Average (EWMA) are similar but serve different purposes.
In essence, EMA is for active trading, while EWMA is for analyzing long-term risk with reduced volatility impact.
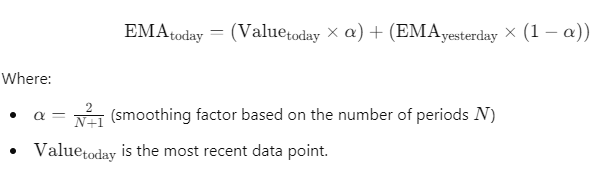
Calculating the Exponential Moving Average (EMA) involves using both current and historical data points, giving more weight to the most recent values.
The formula for EMA is as follows:
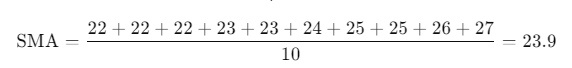
Let’s calculate a 10-period EMA for the following data set: 22, 22, 22, 23, 23, 24, 25, 25, 26, 27, 28.
1. Initial EMA: Use the SMA for the first 10 data points:
2. Next EMA Calculation: For the 11th data point (28), the smoothing factor α for N=10 is:
Then, the EMA is:

The EMA indicator offers several strategic uses that can help traders make informed decisions. Here are some popular EMA strategies to consider:
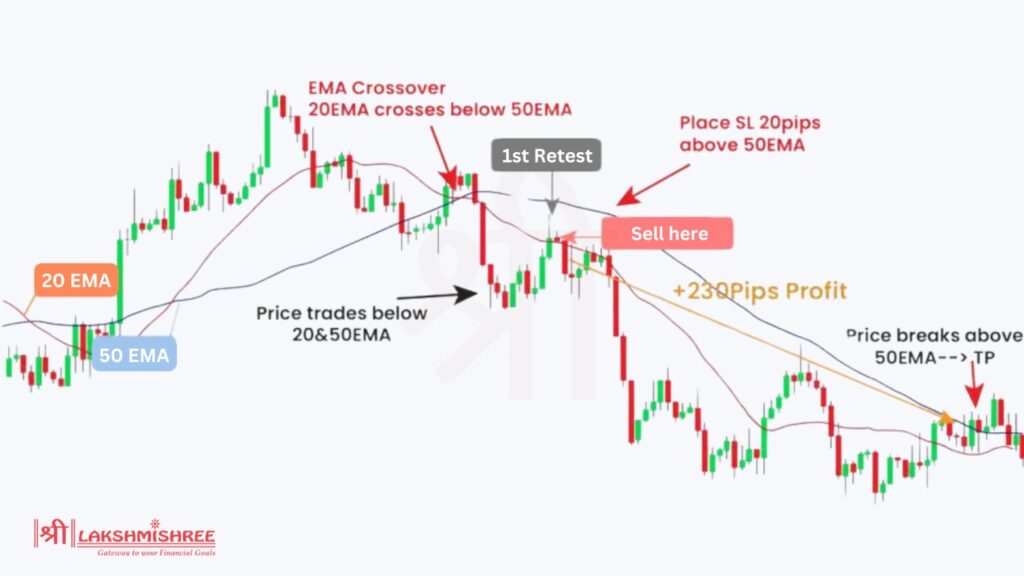
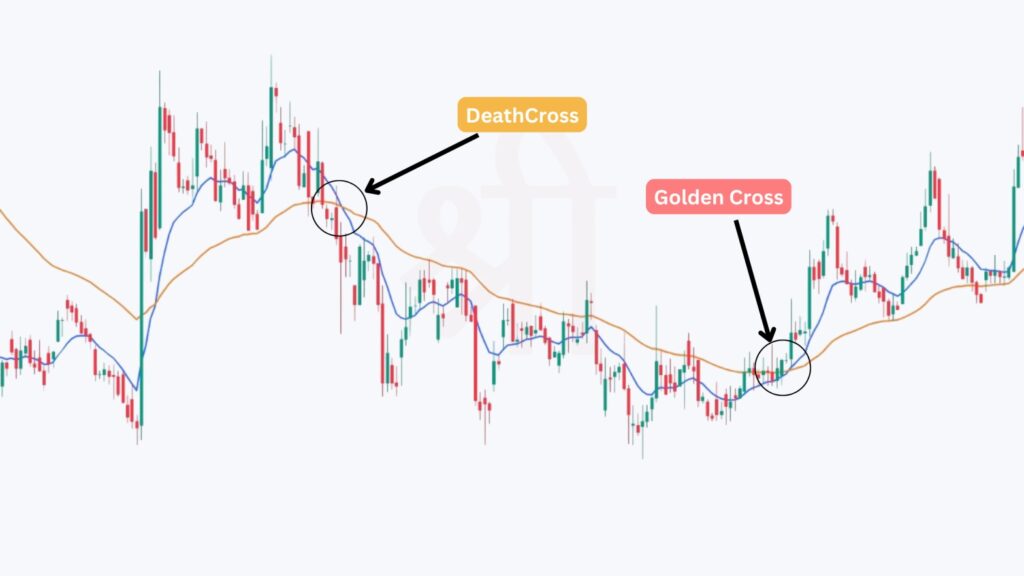
1. Crossover Strategy
This is one of the most common EMA strategies. It involves using two EMAs with different time frames—typically a short-term EMA (like 9 or 12 days) and a long-term EMA (like 26 or 50 days). When the short-term EMA crosses above the long-term EMA, it’s called a “Golden Cross” and signals a potential buying opportunity. Conversely, when the short-term EMA crosses below the long-term EMA, known as a “Death Cross,” it indicates a potential sell signal.
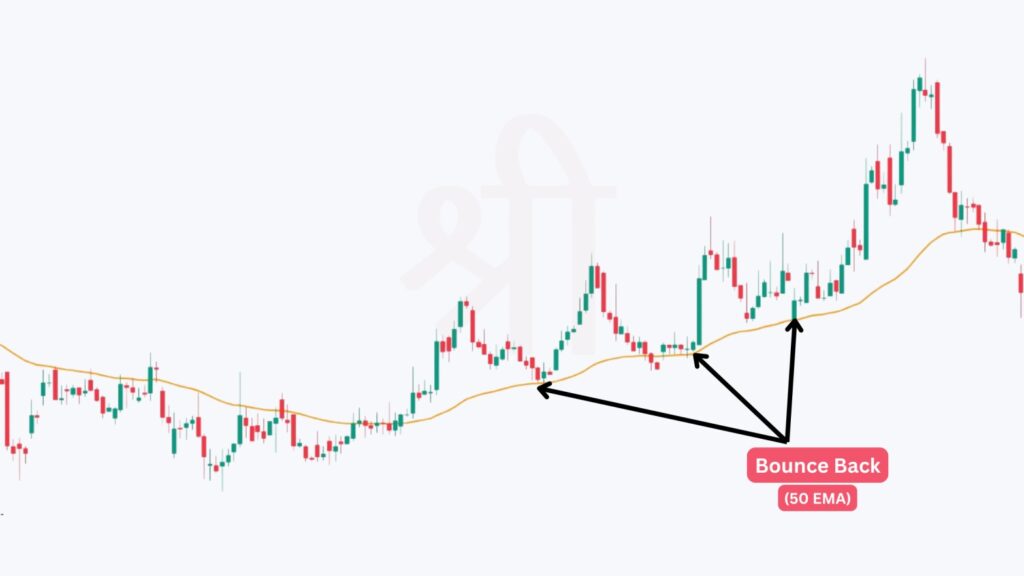
2. EMA Bounce Strategy
The EMA acts as a dynamic support or resistance level in this approach. Traders look for the price to “bounce” off the EMA line. If the price touches the EMA and then continues in the direction of the trend, it’s often taken as a signal to buy (if in an uptrend) or sell (if in a downtrend). The 50-day and 200-day EMAs are especially popular for this strategy.
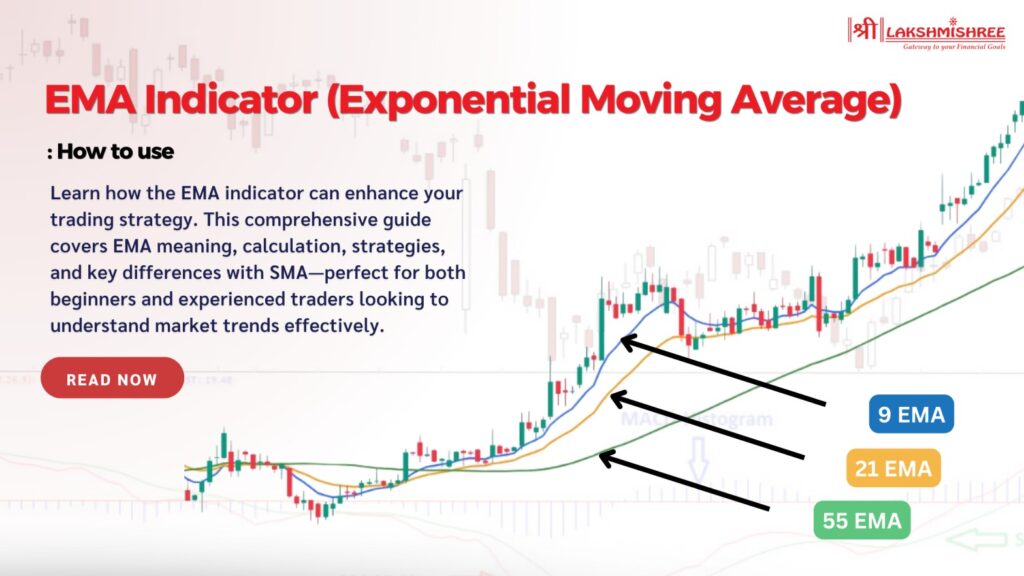
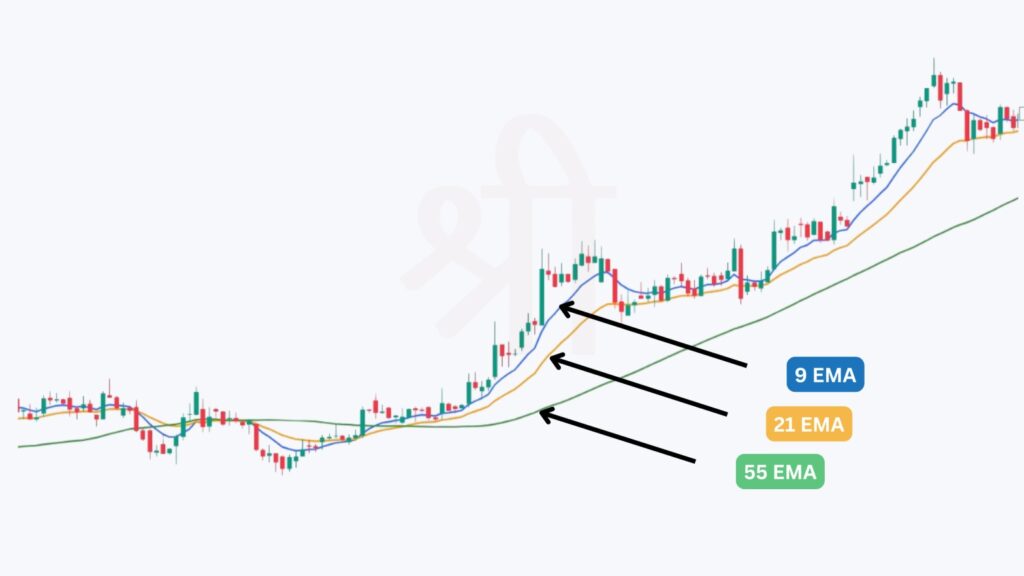
3. Multiple EMA Strategy
By combining three EMAs—such as 9, 21, and 55-day EMAs—traders can get a better picture of the market. It confirms a strong trend when all three EMAs are aligned (the 9 EMA above the 21 EMA and the 21 EMA above the 55 EMA). This setup can help traders stay in a trend longer and avoid premature exits.
4. Trend-Following Strategy
With this strategy, traders rely on the slope of the EMA line. A rising EMA suggests a bullish trend, while a falling EMA suggests a bearish trend. This can be especially useful for swing trading, where traders hold positions for several days or weeks. For instance, if the 200 EMA is trending upwards, traders might look to buy on dips in line with the long-term trend.
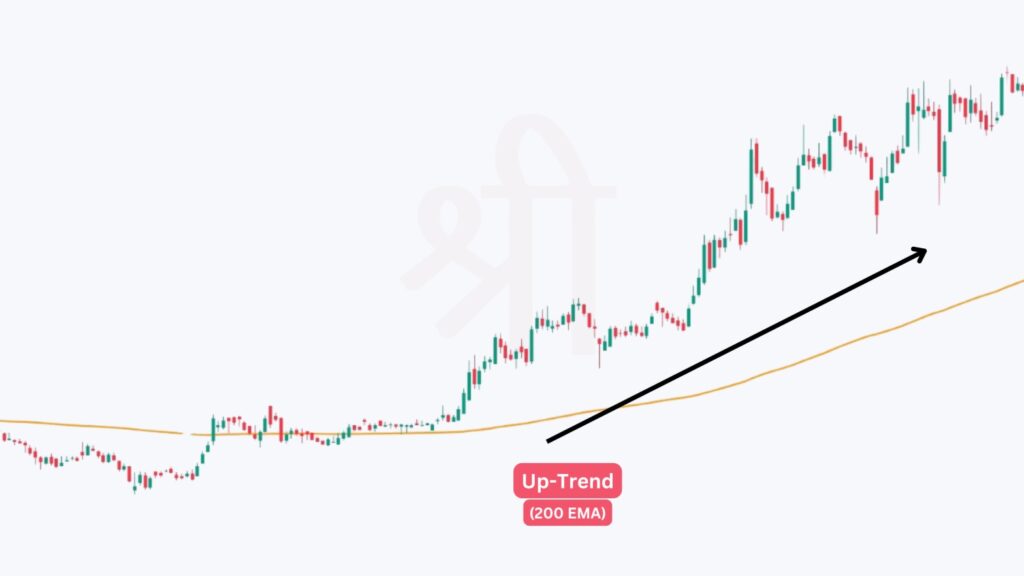
The 200 EMA is a widely recognized long-term trend indicator. Traders and analysts use it to identify overall market direction and major support or resistance levels. When the price is above the 200 EMA, it’s generally considered bullish, while a price below indicates a bearish trend. The 200 EMA helps traders filter out short-term noise and focus on the bigger picture.
Each strategy leverages the EMA indicator differently, giving traders flexibility based on their specific trading goals and risk tolerance.
Both Simple Moving Average (SMA) and Exponential Moving Average (EMA) are tools used to smooth out price data, but they do it in distinct ways. While SMA calculates an average of price data over a period, EMA gives more weight to recent prices, making it more responsive to current price movements.
| Factor | SMA | EMA |
|---|---|---|
| Calculation | Averages all prices equally over a period | It gives more weight to recent prices |
| Responsiveness | Slower to react to recent price changes | Faster to respond to recent price changes |
| Lag | Higher lag, as all prices are equally weighted | Lower lag, due to emphasis on recent data |
| Best For | Long-term trends and stability | Short-term trends and quick-moving markets |
| Signal Accuracy | Provides fewer false signals in volatile markets | More sensitive, can give more signals but also more false ones |
This table highlights the primary differences between SMA and EMA, making it easier for traders to choose the right indicator based on their trading style and market conditions.
The EMA indicator becomes even more powerful when combined with other technical indicators. Here are some popular indicators that traders often pair with EMA to increase the accuracy of their signals:
The Triple Exponential Moving Average (TEMA) is an advanced version of the EMA that reduces lag even further by applying the EMA calculation three times. TEMA is highly responsive and is favored by traders who want quicker signals for short-term trading. However, it can be more prone to false signals in volatile markets, so it’s often used in conjunction with other indicators.
The EMA indicator is a powerful tool for traders looking to make informed decisions by analyzing market trends. By giving more weight to recent prices, it responds quickly to market changes, making it ideal for short-term strategies. Whether you're a day trader or a long-term investor, understanding how to use the EMA alongside other indicators like MACD and RSI can enhance your trading accuracy. While it has its limitations, when used correctly, the EMA provides valuable insights into market direction, helping you spot potential entry and exit points with confidence.
The 9 EMA is a short-term indicator that reacts quickly to price changes, making it useful for day trading. The 20 EMA, while still responsive, provides a slightly broader view of the trend. Both are commonly used together to identify quick trend shifts and confirm signals.
The right EMA depends on your trading goals. For quick trades, the 9 or 12 EMA is often ideal due to its responsiveness. For tracking longer trends, many traders use the 50 or 200 EMA to help smooth out short-term fluctuations and focus on overall direction.
EMA is generally better for short-term trading as it responds faster to recent price movements. SMA, on the other hand, is preferred for long-term analysis since it provides a smoother, more stable trend line. Choosing between them depends on whether you prioritize speed or stability.
Popular EMA settings include 9, 20, 50, and 200, each suited to different trading styles. Shorter EMAs like 9 or 20 capture quick price changes, while longer ones like 50 or 200 help identify overarching trends. Many traders combine multiple EMAs for a well-rounded analysis.
The 8 EMA is a very short-term indicator that’s particularly useful in fast-paced trading, like scalping or day trading. It allows traders to catch rapid price movements but can generate more noise due to its sensitivity. It’s often paired with longer EMAs for balance.
DEMA reduces lag more than the standard EMA by combining two EMAs into one. This makes it ideal for traders who need even faster signals for trend reversals. However, DEMA can be more susceptible to false signals in volatile markets, so it’s best used with other indicators.
Yes, EMAs like the 100 or 200 are commonly used for long-term trading to capture broader market trends. While they’re slower to respond, they provide a clearer picture of the overall trend. This helps long-term investors avoid reacting to short-term price noise.
Disclaimer: This article is intended for educational purposes only. Please note that the data related to the mentioned companies may change over time. The securities referenced are provided as examples and should not be considered as recommendations.
