Have you ever wondered how traders predict when a market will change direction? Whether it’s the stock market or crypto, smart traders rely on candlestick reversal patterns to stay ahead of the curve. These patterns serve as powerful visual cues, indicating whether prices might soon rise or fall. Think of them as a sneak peek into the market’s next move—helping traders make confident decisions instead of just guessing.
In this blog, you’ll discover these patterns, how they work, and how they can transform your trading game.
A candlestick pattern is a simple way to read price movements in the market. Each candlestick tells a story about how prices moved during a specific time frame—whether they went up, down, or flat. These patterns help traders spot potential buying or selling opportunities quickly without digging through complex data.
Candlestick reversal patterns are chart formations that indicate a shift in the current trend—whether it's moving from an uptrend to a downtrend or vice versa. In a downtrend, these patterns signal a potential bullish reversal, suggesting the selling pressure is fading, and buyers may take control. On the other hand, in an uptrend, they warn of a possible bearish reversal, hinting at the end of the rally and a likely market decline.
These patterns are highly visual, making it easier for traders to spot changes in market sentiment. However, they are often more effective when confirmed with other technical tools like moving averages or RSI, helping traders improve the accuracy of their predictions.
The use of candlestick patterns dates back to 18th-century Japan, where rice traders developed them to track market prices. Steve Nison, credited with introducing these techniques to the Western world, highlighted their value in his book Japanese Candlestick Charting Techniques.
In the Indian stock market, traders heavily rely on reversal candlestick patterns to spot potential changes in the market’s direction. These patterns act as early warning signals, helping traders decide when to enter or exit a trade. For example, if a bullish reversal pattern like a Hammer appears after a prolonged downtrend, it may indicate that the selling pressure is weakening and buyers are stepping in. This could be the right moment to consider buying.
Conversely, a bearish reversal pattern such as the Shooting Star at the peak of an uptrend, warns traders about a possible price decline. However, experienced traders never act solely on these patterns. They often combine them with tools like volume analysis, support and resistance levels for better confirmation. This multi-tool approach minimises risks and boosts confidence in making decisions, whether you're trading blue-chip stocks or mid-caps.
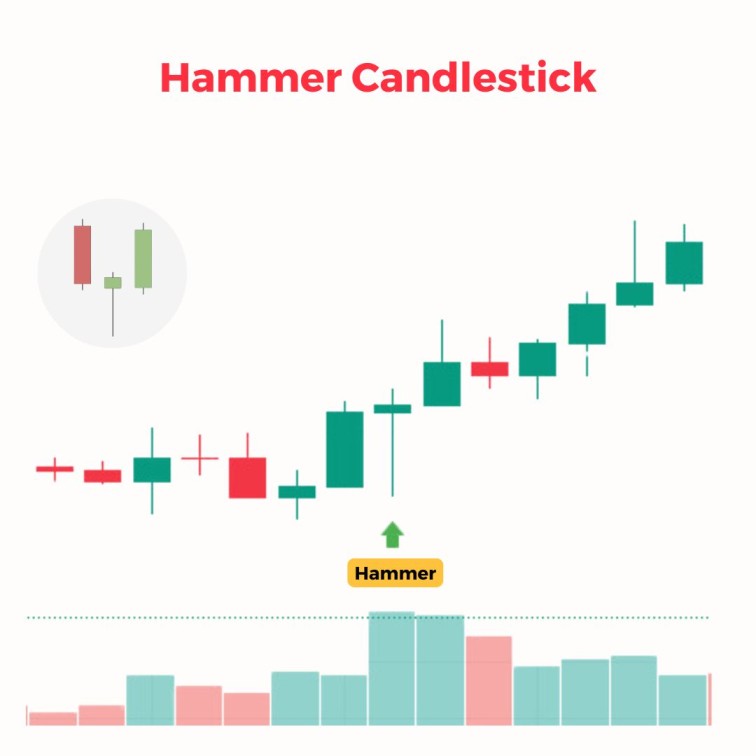
The Hammer is one of the most recognisable bullish reversal patterns. It’s a single candle with a small body near the top and a long lower wick resembling a hammer. This formation often appears at the bottom of a downtrend.
What It Means:
The long lower wick shows that while bears initially had control, pushing the price down, bulls stepped in and forced the price back up. This tug-of-war indicates that the selling pressure is weakening, and buyers are gaining strength.
Key Characteristics:
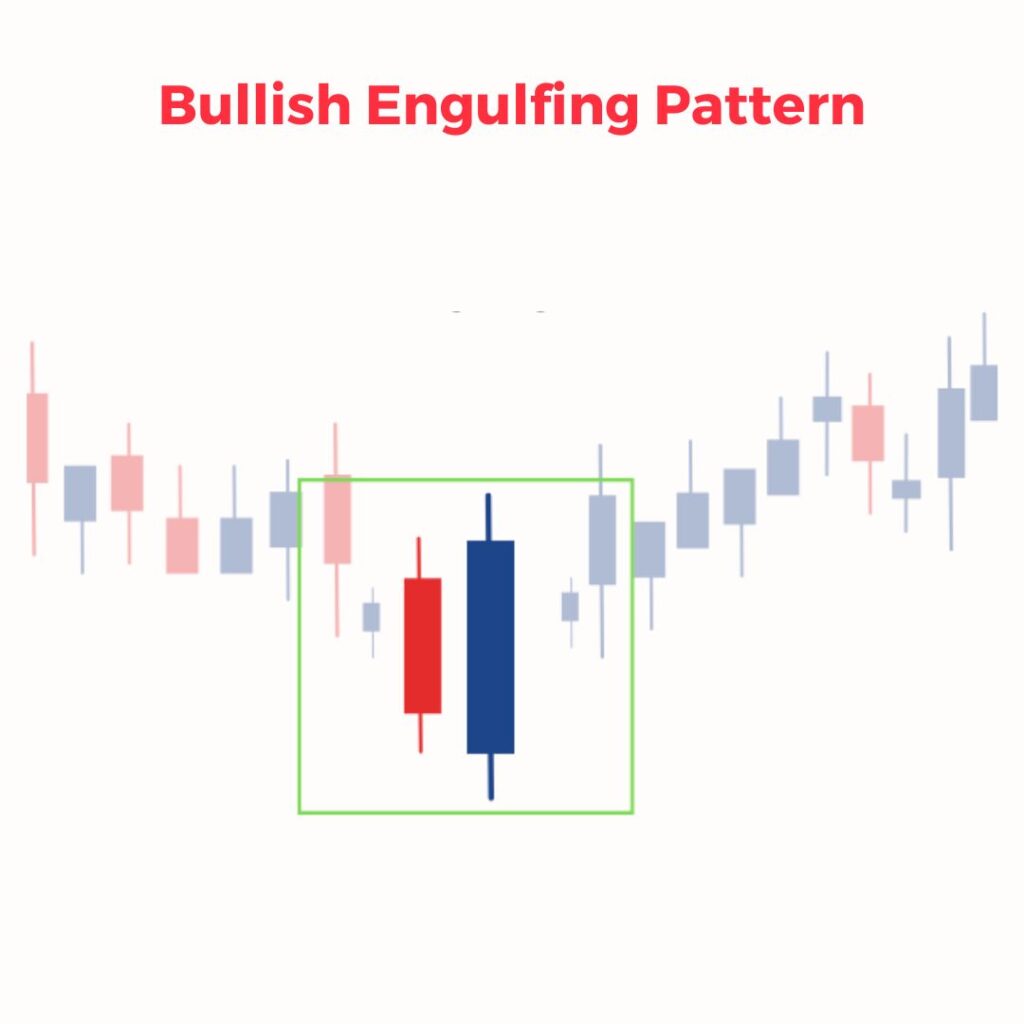
The Bullish Engulfing is a two-candle pattern that signals a shift from bearish to bullish sentiment. The second candle in this pattern "engulfs" the body of the first bearish candle.
What It Means:
The first candle represents the continuation of the downtrend, while the second, larger bullish candle shows that buyers have stepped in with significant force, overpowering the sellers.
Key Characteristics:
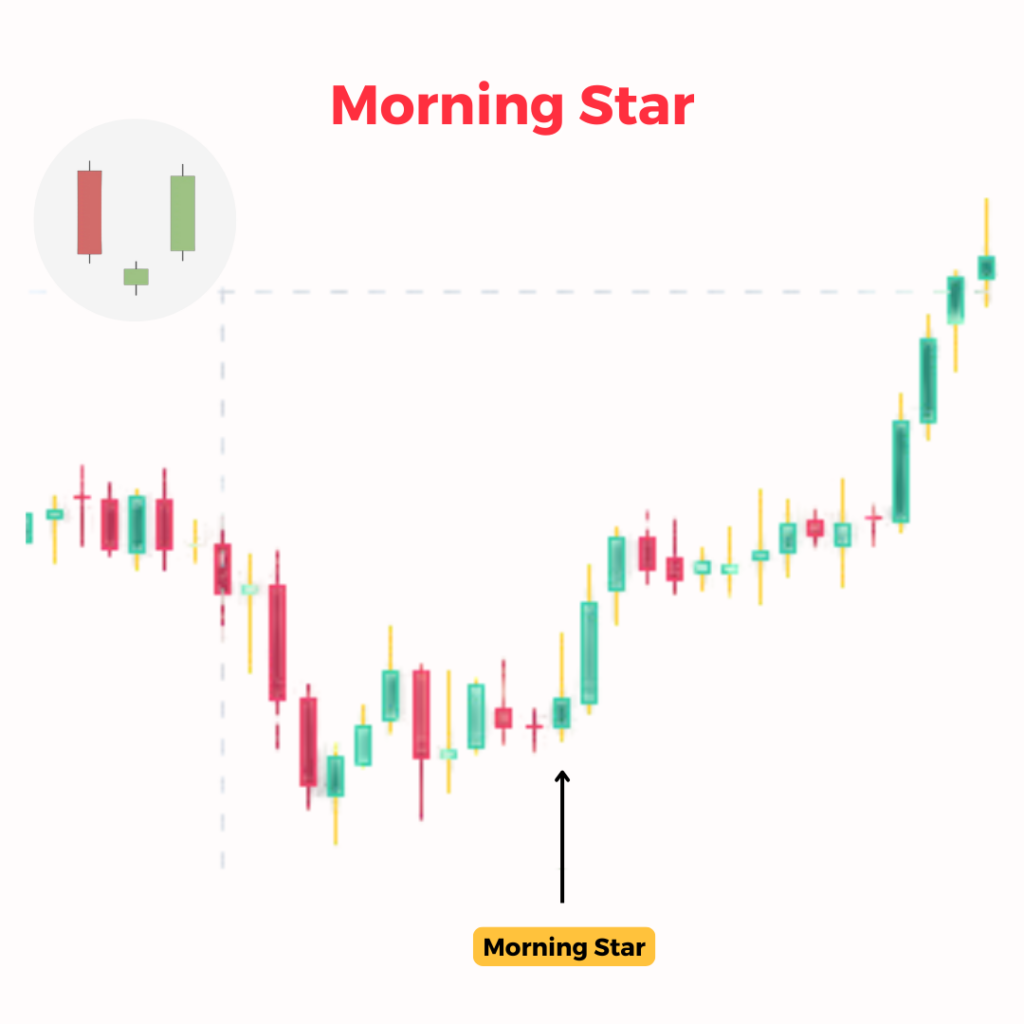
The Morning Star is a three-candle formation that reverses a downtrend. This pattern is highly reliable due to its structure and is commonly used by traders to identify potential bullish reversals.
What It Means:
The first candle is bearish, continuing the downtrend. The second candle is small (bullish or bearish), signalling indecision or the slowing momentum of sellers. The third candle is a large bullish one, confirming the reversal.
Key Characteristics:
The Piercing Line is a two-candle pattern that signals a reversal after a strong downtrend. It’s less common than other patterns but can be effective when correctly identified.
What It Means:
The first candle is bearish, showing continued selling pressure. The second candle opens below the previous close (gap down) but closes above the midpoint of the first candle. This pattern demonstrates a dramatic shift in momentum as buyers step in to reverse the trend.
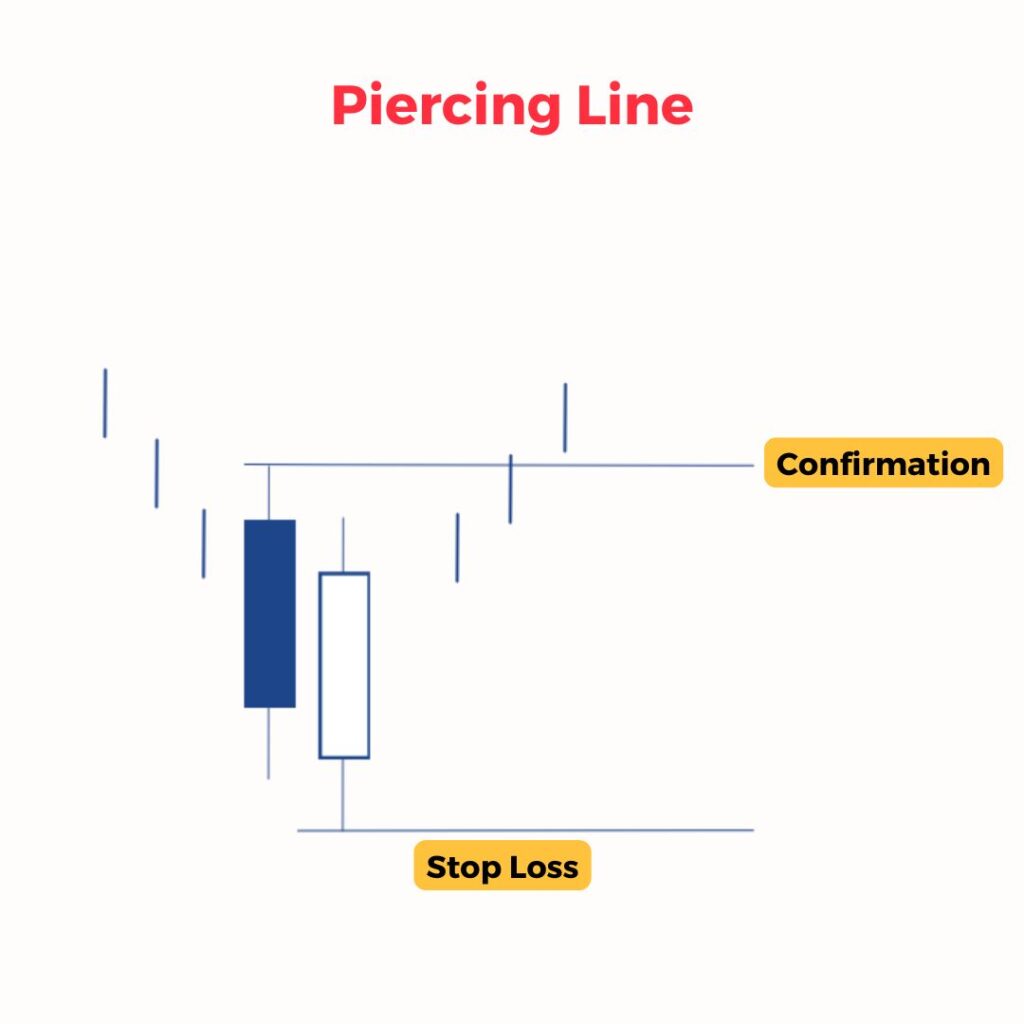
Key Characteristics:
The Three White Soldiers is a powerful bullish reversal pattern consisting of three consecutive long-bodied bullish candles.
What It Means:
Each candle opens within the body of the previous one and closes higher, signalling strong and sustained buying momentum. This pattern is considered a robust indicator of a bullish reversal, particularly after a downtrend.
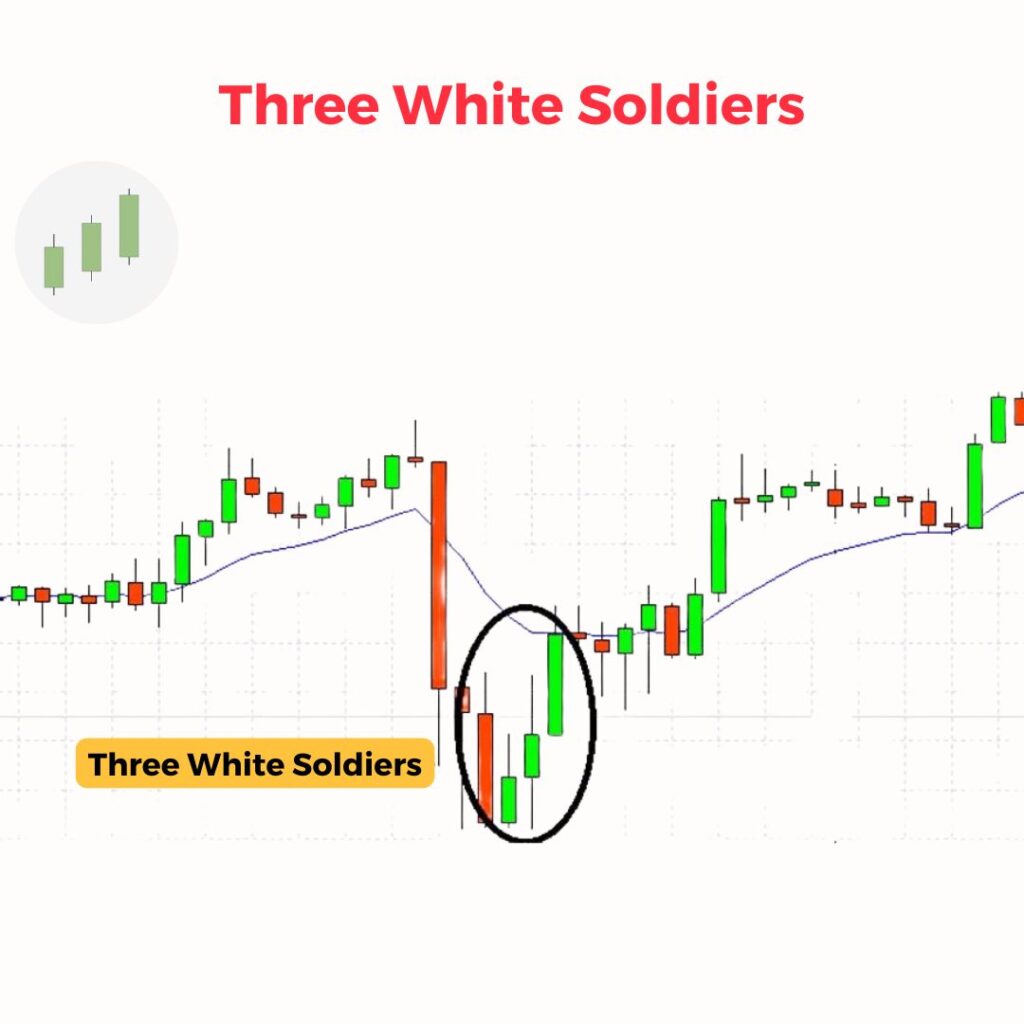
Key Characteristics:
In addition to the major patterns discussed, here are a few more bullish reversal candlestick patterns that traders should know:
While not as commonly highlighted, these patterns can be useful for spotting potential upward trend reversals when combined with other analysis tools.
The Shooting Star is a single-candle pattern that typically forms at the top of an uptrend. This pattern is easy to recognise, thanks to its small body and long upper wick.
What It Means:
The long upper wick shows that the bulls tried to push the price higher during the session, but sellers quickly took over, driving the price back down near the opening level. This indicates that the rally is losing momentum, and a reversal is likely on the horizon.
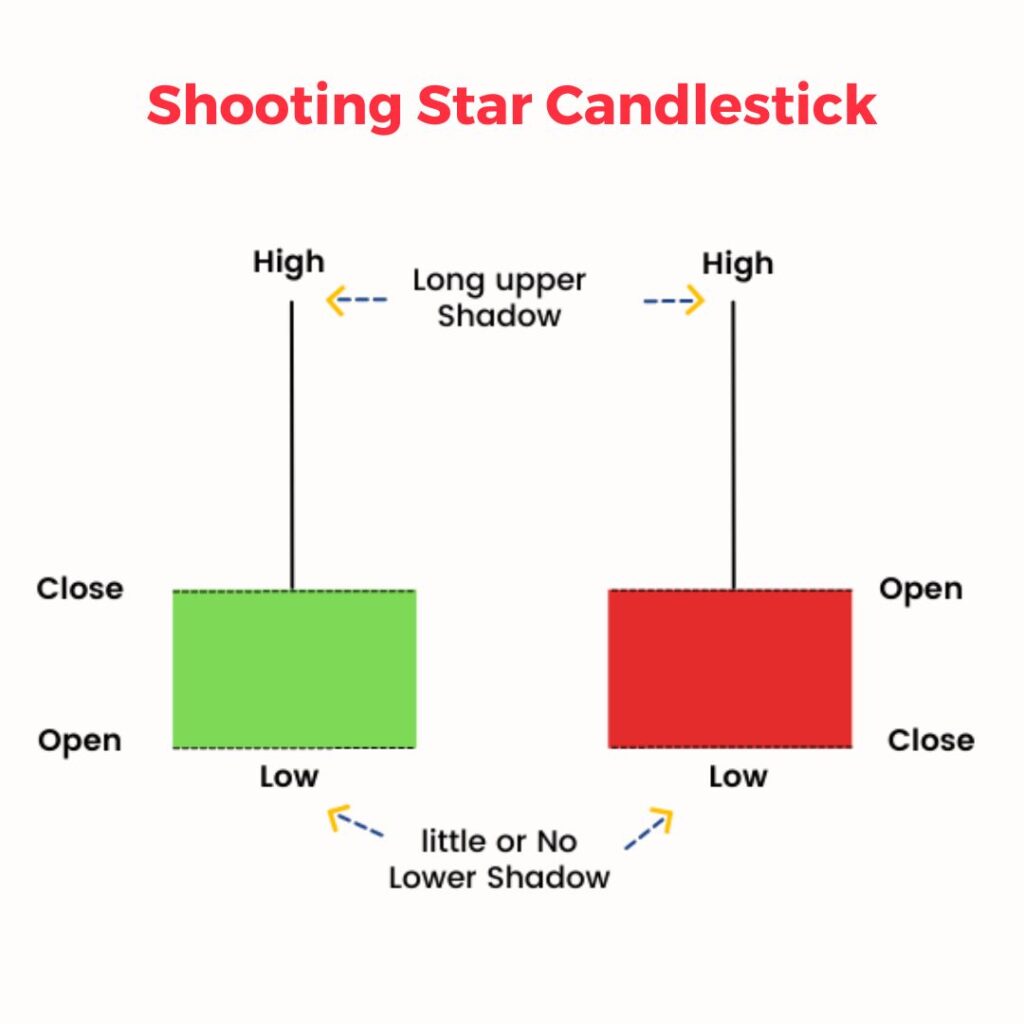
Key Characteristics:
The Bearish Engulfing is a two-candle pattern that often appears at the end of an uptrend. It is the counterpart to the Bullish Engulfing Pattern in bullish reversal candlestick patterns.
What It Means:
The first candle is bullish, continuing the upward trend. The second, larger bearish candle completely "engulfs" the first candle's body. This indicates that selling pressure has overwhelmed buying interest, suggesting a reversal is underway.
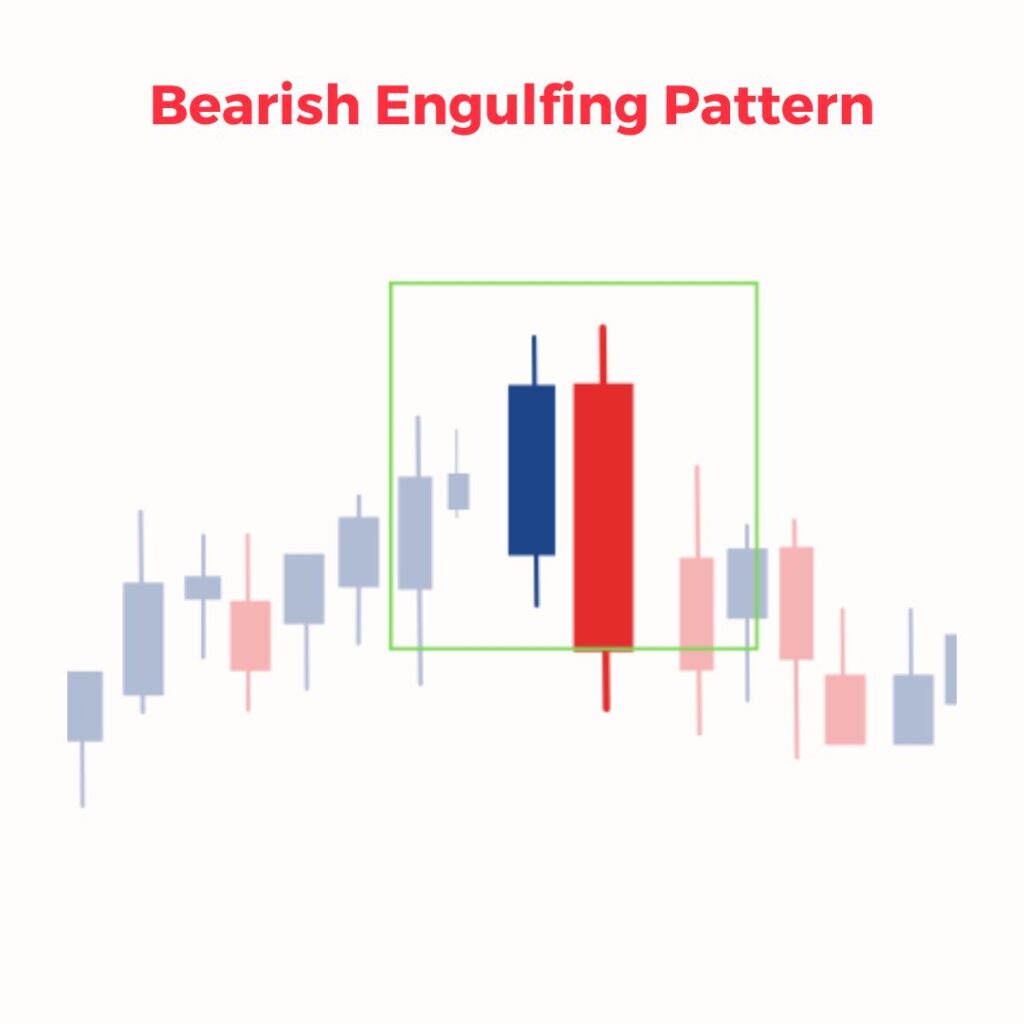
Key Characteristics:
The Evening Star is a three-candle formation that appears after an uptrend. It is one of the most reliable candlestick reversal patterns due to its structure and the clear shift in momentum it represents.
What It Means:
The first candle in the pattern is a long bullish candle, followed by a small-bodied candle (indecision), and finally, a strong bearish candle that closes below the midpoint of the first candle. This sequence signals that buying pressure has diminished, and sellers are gaining control.
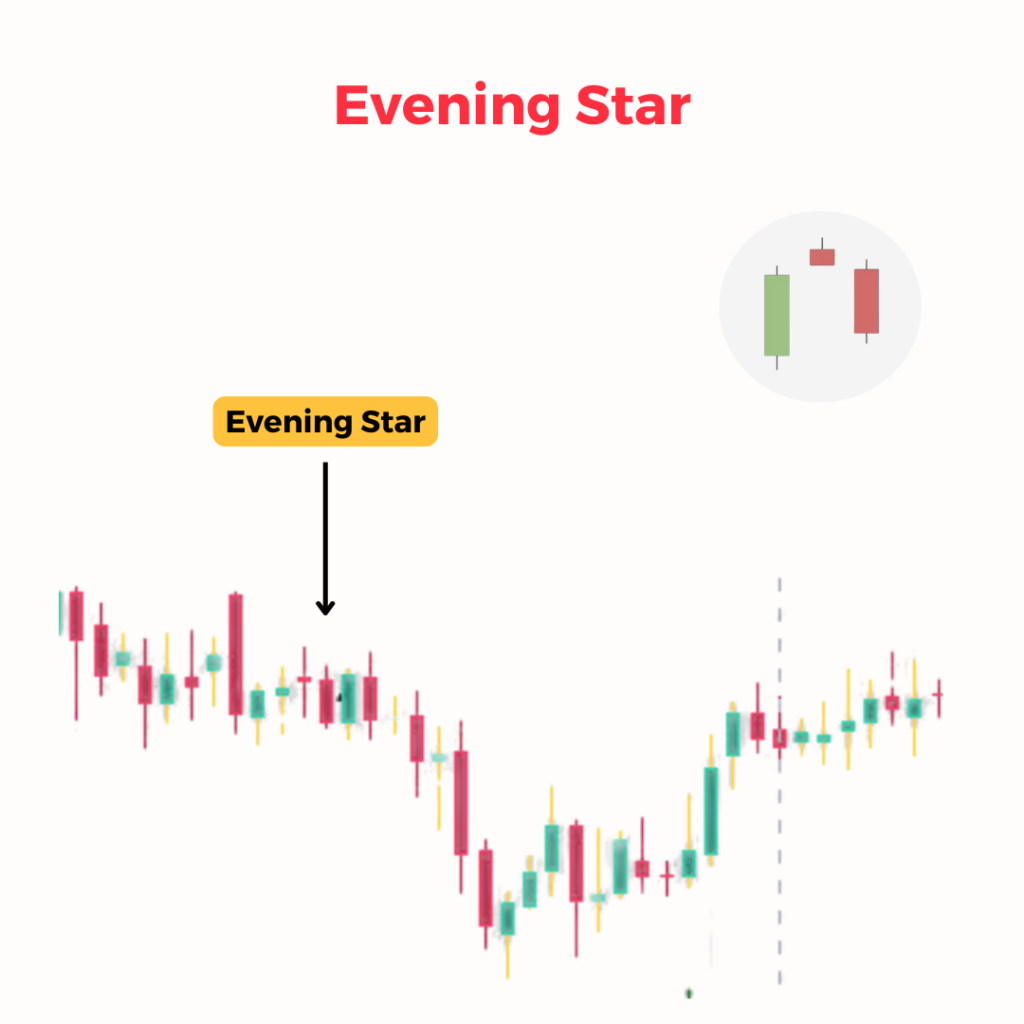
Key Characteristics:
The Dark Cloud Cover is a two-candle bearish reversal pattern that signals a potential trend reversal when it appears at the end of an uptrend.
What It Means:
The first candle is a long bullish candle, showing strong buying momentum. However, the second bearish candle opens above the previous close (gap up) and then closes well below the midpoint of the first candle. This pattern suggests that sellers have gained control and a reversal is likely.
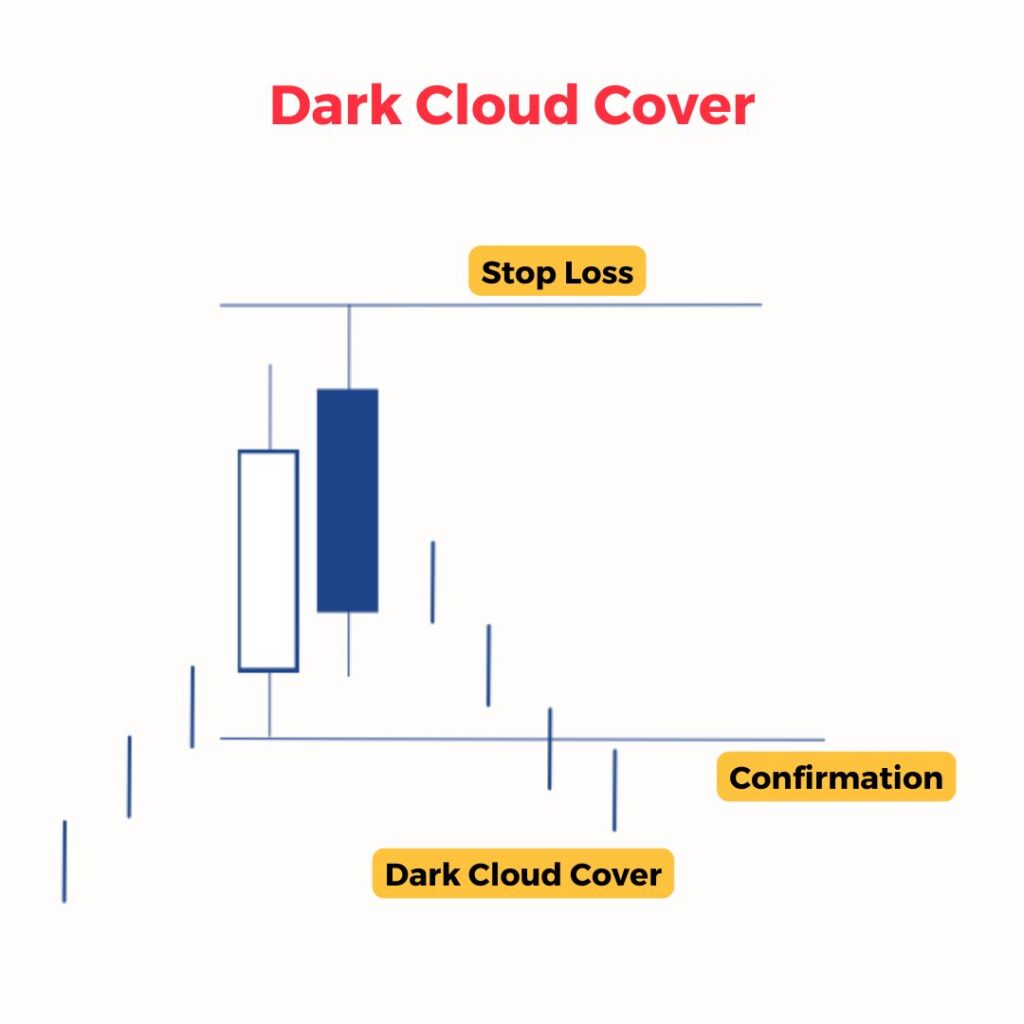
Key Characteristics:
The Hanging Man resembles the Hammer Pattern but forms at the top of an uptrend instead of the bottom.
What It Means:
The long lower wick shows that bears tried to lower the price during the session. Although bulls managed to recover and close the price near the open, the pattern signals potential weakness in the rally.
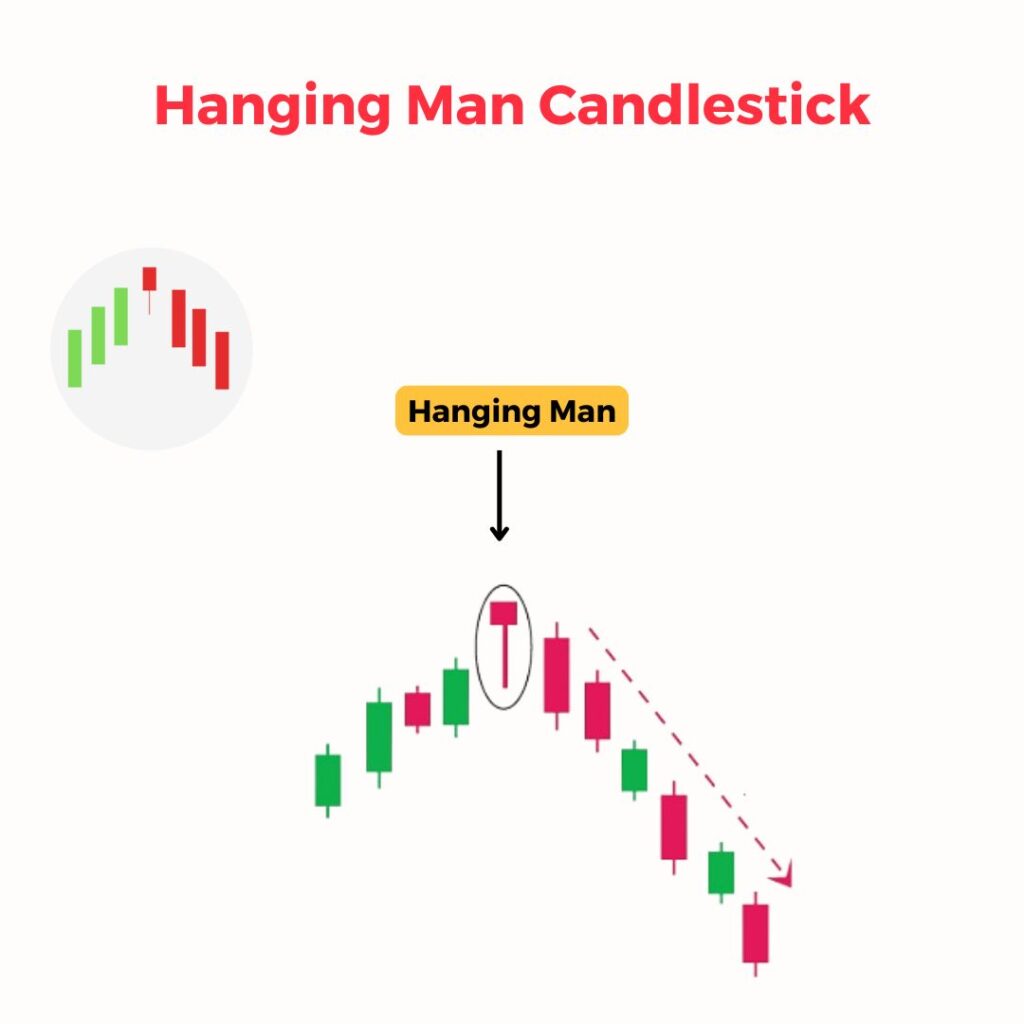
Key Characteristics:
The Three Black Crows is a strong three-candle bearish reversal pattern that signals a complete shift in market sentiment.
What It Means:
This pattern consists of three consecutive bearish candles, each closing lower than the previous one. It indicates that sellers are firmly in control, and the downtrend will likely continue.
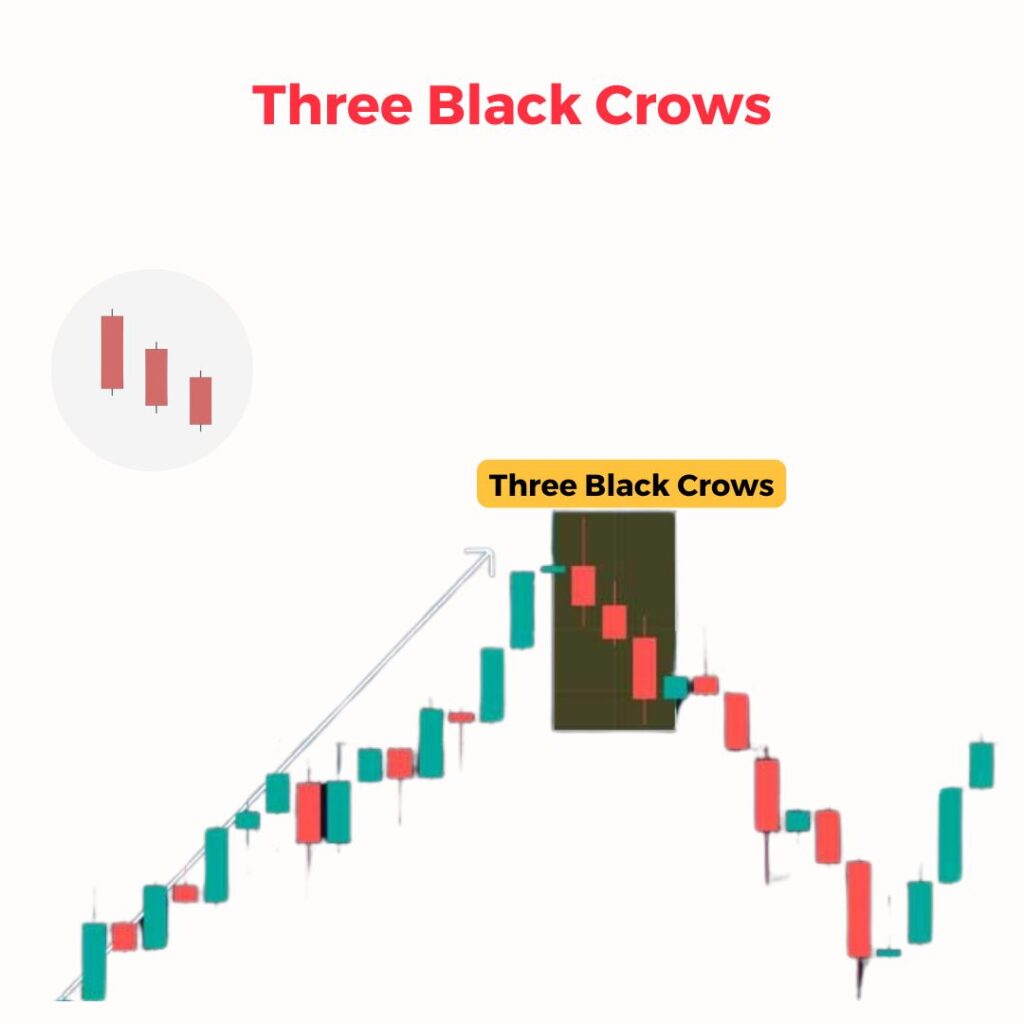
Key Characteristics:
Besides the prominent patterns covered earlier, these bearish reversal candlestick patterns also deserve attention:
These patterns can provide additional insights into potential downward trend reversals and can be effective when used alongside confirmation tools like volume or support and resistance analysis.
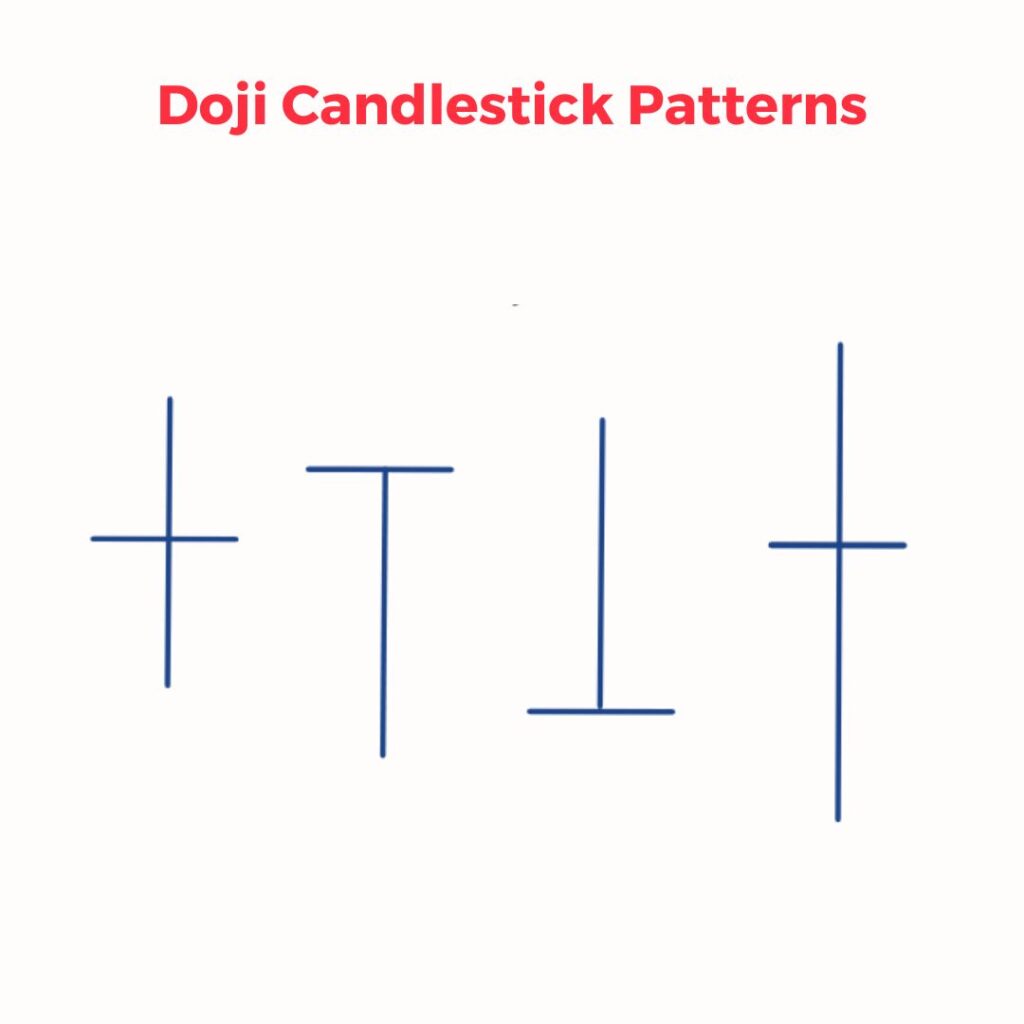
The Doji is a versatile pattern that signals indecision in the market. It appears when the opening and closing prices are nearly identical, forming a candle with no real body but long wicks.
Types of Doji Patterns:
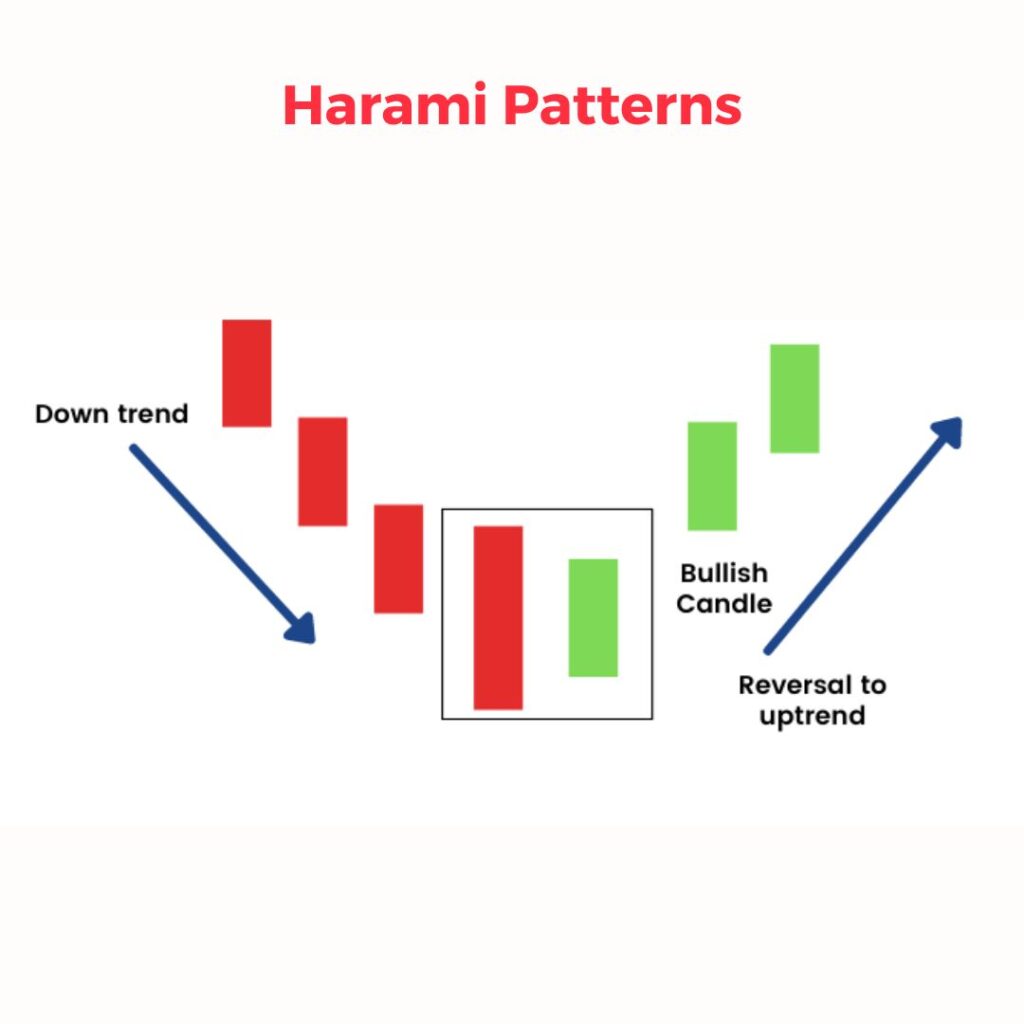
The Harami is a two-candle pattern where the second candle forms a smaller body within the range of the first candle’s body. The term "Harami" means "pregnant" in Japanese, symbolizing the smaller candle within the larger one.
What It Signals:
Identifying candlestick reversal patterns is just the first step—what you do next can make or break your trade. Here's a simple action plan to follow when you spot bullish reversal candlestick patterns or bearish reversal candlestick patterns in the market.
1. Analyze the Context
Before jumping into a trade, assess the bigger picture:
2. Plan Your Entry
3. Set a Stop Loss
Risk management is critical.
4. Define Take Profit Levels
Use a favourable risk-reward ratio (e.g., 1:2).
5. Wait for Confirmation (Optional)
If you’re unsure about entering immediately, wait for one or two additional candles to confirm the reversal. Use tools like RSI or MACD for added validation.
The 3 candle reversal strategy revolves around observing a sequence of three candlesticks that signal a potential shift in the ongoing trend. Here’s how the process unfolds:
Here are some key tools you can pair with bullish reversal candlestick patterns or bearish reversal candlestick patterns to improve your analysis.
Mastering candlestick reversal patterns is a critical skill for any trader in the stock market. Bullish, bearish, and trend reversal candlestick patterns offer valuable insights into market direction changes. However, combining these patterns with tools like RSI, Moving Averages, and Volume Analysis can greatly enhance accuracy and reduce risks. By understanding and applying these strategies, you can make smarter trading decisions and stay ahead of market trends.
A reversal candlestick pattern is a specific formation in candlestick charts that signals a potential market change. These patterns can indicate a shift from an uptrend to a downtrend (bearish reversal) or from a downtrend to an uptrend (bullish reversal). Examples include the Hammer, Shooting Star, and Morning Star.
To identify a reversal candle, look for patterns at key support or resistance levels or after a prolonged trend. The candle’s shape is crucial—for instance, a Hammer with a long lower wick indicates a potential bullish reversal, while a Shooting Star with a long upper wick suggests a bearish reversal.
The strongest reversal candlestick patterns include the Bullish Engulfing and Bearish Engulfing patterns. These are highly reliable as they represent the clear dominance of buyers or sellers over the prevailing trend.
The Hammer is one of the best bullish reversal candlestick patterns as it often forms at the bottom of a downtrend, signalling a strong potential for a price reversal.
A bearish reversal pattern is a candlestick formation that indicates a potential shift from an uptrend to a downtrend. Examples include the Shooting Star, Bearish Engulfing, and Dark Cloud Cover.
Trend reversal candlestick patterns are highly reliable when combined with other tools and used in the right context, such as near key support or resistance levels. However, no pattern guarantees success, and using proper risk management is essential.
Disclaimer: This article is intended for educational purposes only. Please note that the data related to the mentioned companies may change over time. The referenced securities are provided as examples and should not be considered recommendations.