If you're a trader looking to gain an edge in the market, chances are you've come across the Bollinger Bands indicator. It’s one of the most popular tools used by traders to identify potential buy or sell signals, understand market volatility, and spot upcoming trends. Created by financial analyst John Bollinger, this indicator helps you make sense of price movements by showing whether a stock or market is overbought or oversold.
In this guide, we’ll break down exactly how to use the Bollinger Bands indicator in your trading, how to interpret the signals it provides and dive into some tried-and-true strategies to maximise your gains. Ready to level up your trading game?
Bollinger Bands are a widely used technical analysis indicator that helps traders assess price volatility and potential trading opportunities. Developed by John Bollinger in the 1980s, this indicator is designed to give you a visual sense of market dynamics—whether a stock is overbought, oversold, or trending.
The Bollinger Bands indicator comprises three lines: a simple moving average (SMA) in the middle and two outer bands placed two standard deviations away from the SMA. These outer bands expand and contract based on market volatility, giving you insights into the current trading environment.
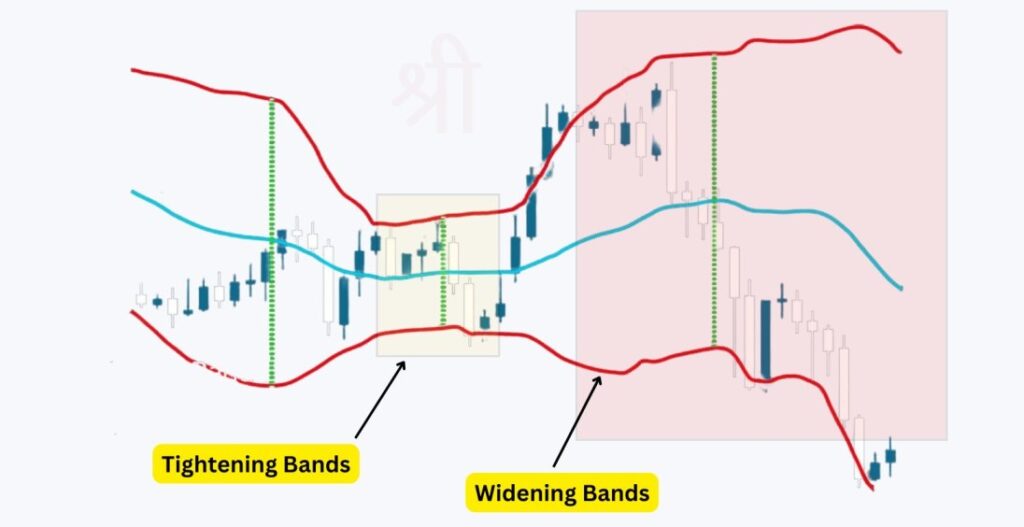
In simple terms, when the bands tighten, it signals a potential breakout or price movement. When the bands widen, volatility increases, which may indicate strong price swings.
Bollinger Bands consist of three key parts:
The Bollinger Bands indicator is useful for understanding various market signals. By analysing how prices interact with the upper, middle, and lower bands, traders can assess volatility, identify potential reversals, and spot breakout opportunities. Let's break down what each signal means.
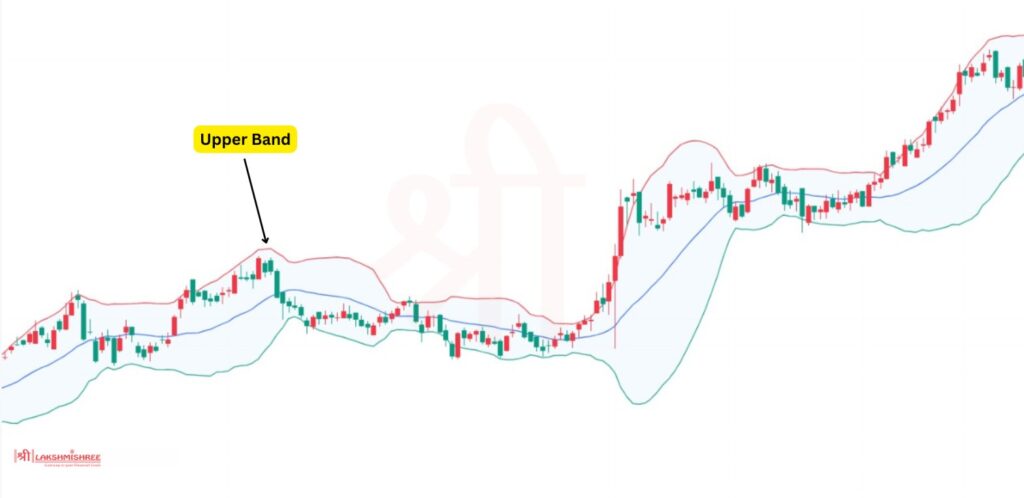
When the price nears or touches the upper band, it often signals that the market is overbought. This suggests the price has risen sharply and may face resistance or a reversal. Traders often see this as an opportunity to sell or take profits. However, if the price consistently stays at or above the upper band, it might indicate a strong uptrend and that the market is continuing its upward momentum.
A push through the upper band with increased volume can sometimes signify a breakout, particularly in volatile market conditions. In such cases, traders may adjust their strategies to follow the breakout trend.
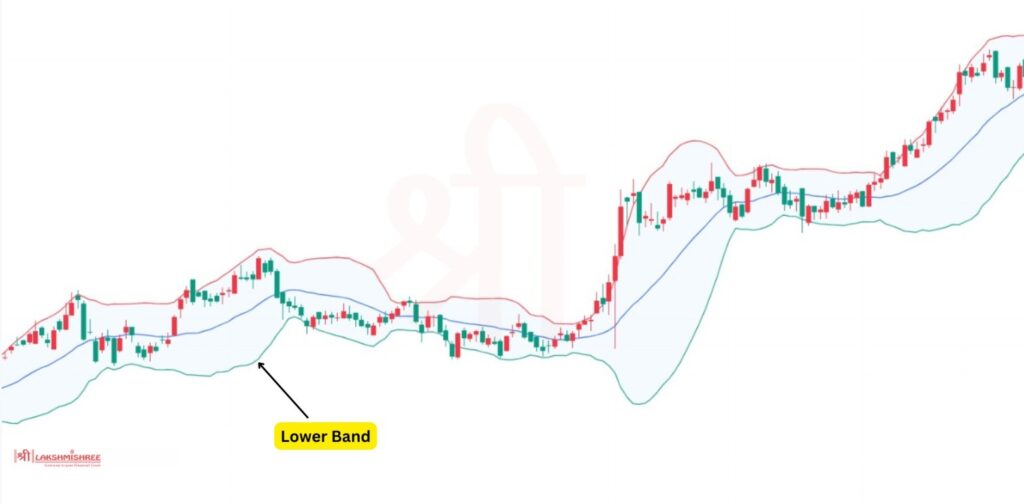
Conversely, when the price touches or falls below the lower band, it indicates oversold conditions. This might suggest that the asset is undervalued, and a reversal could be on the horizon. Traders using a mean reversion strategy may take this as a buying signal, expecting the price to bounce back toward the middle band or higher.
However, if the price continues to trade below the lower band, it can signal the start of a strong downtrend. This is particularly true if the drop is accompanied by increased trading volume, indicating that the bearish sentiment may continue.
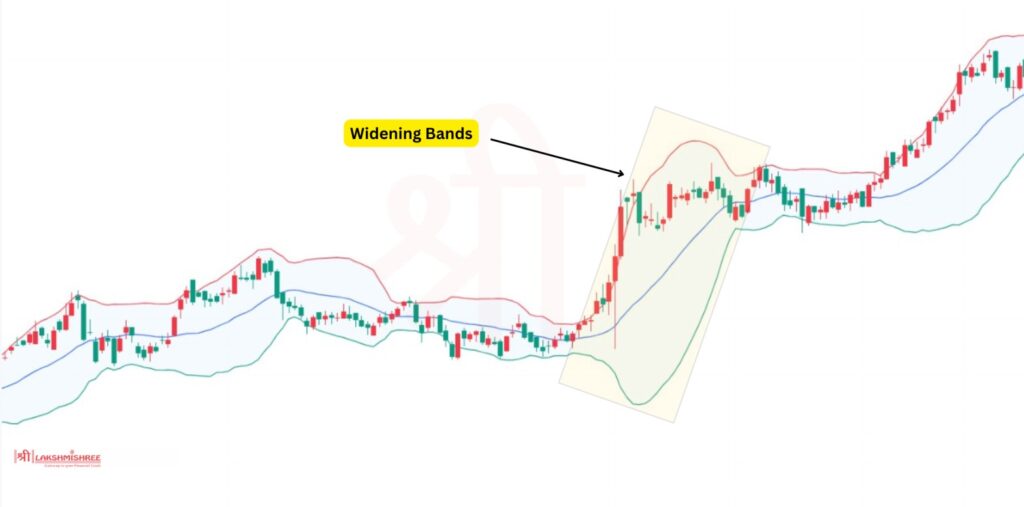
When the bands widen, it reflects increasing volatility in the market. This happens during major events such as earnings reports or significant economic announcements. Widening bands indicate that larger price swings are expected, and traders should prepare for possible sharp movements in either direction.
This expansion of the bands can also suggest the beginning of a strong price trend. In such cases, traders typically combine Bollinger Bands with other indicators, such as the Relative Strength Index (RSI), to confirm whether the trend will continue.
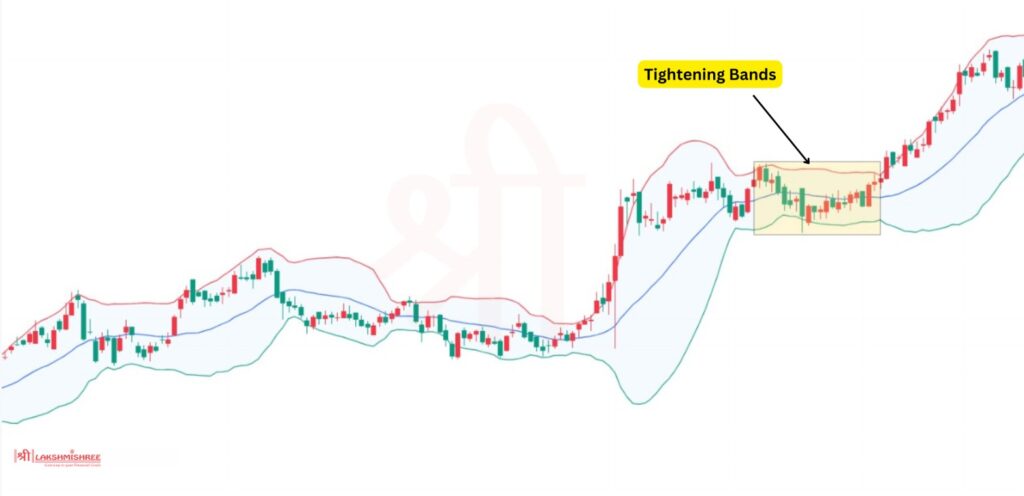
Tightening or narrowing bands, also called a "squeeze," point to low volatility in the market. During these periods, prices are less volatile, and traders may view this as a time of consolidation. While the bands are tight, prices often trade within a smaller range, but this usually precedes a significant upward or downward breakout.
The longer the squeeze, the more powerful the breakout is expected to be. However, Bollinger Bands alone cannot predict the breakout's direction, so it's best to use them alongside other technical analysis tools to make informed decisions.
While Bollinger Bands are powerful, they don't always provide perfect or foolproof signals. Combining Bollinger Bands with other technical analysis tools is a good idea to improve accuracy. Here are some complementary indicators to consider:
Moving averages are a popular method for identifying trends. A security trading above its moving average usually indicates an uptrend, while trading below it suggests a downtrend. You can pair Bollinger Bands with a simple moving average (SMA) or an exponential moving average (EMA) to confirm trend direction.
Stochastic indicators help predict potential trend reversals by measuring price momentum. Just like Bollinger Bands, they can highlight overbought or oversold conditions, offering a secondary signal to confirm your trade decisions.
ATR is a tool that measures market volatility. High ATR values indicate increased volatility, while low values suggest quieter, more stable market conditions. ATR can help you decide on your entry and exit points more effectively, especially during volatile market phases when used alongside Bollinger Bands.

The Bollinger Bands formula is relatively simple but highly effective for identifying market volatility. It consists of three main components:
The formula for Bollinger Bands looks like this:
This formula allows the bands to adapt to changing market conditions, expanding during periods of high volatility and contracting during quieter times, making it a dynamic tool for traders.
Traders widely use the Bollinger Bands strategy to navigate both bullish and bearish markets. Instead of focusing solely on price-crossing the bands, successful strategies often incorporate price action and volatility to make more informed trading decisions. Below are two of the most popular strategies you can apply using Bollinger Bands:
Many traders mistakenly think that when the price touches the upper or lower band, it's an immediate signal to buy or sell. Price "riding" the bands is common during strong trends. In a bullish market, the price can consistently stay near or above the upper band without reversing, while in a bearish market, prices might hover near the lower band.
Instead of entering a trade solely based on the price touching the bands, it’s better to observe if the price continues riding the band over several periods, indicating that the trend may still have momentum. You can combine this with other indicators, like volume or the Relative Strength Index (RSI), to confirm the strength of the trend before making a move.
The Bollinger Band squeeze is a popular strategy used to anticipate periods of increased volatility. In this strategy, traders look for bands to narrow, indicating that volatility is low. This contraction, or "squeeze," often precedes a significant price move as the market builds up energy before a breakout.
To measure the squeeze, traders can calculate the bandwidth using the formula:
Band Width = (Upper Band - Lower Band) / Middle Band
When the bandwidth hits a historically low level, traders can expect a breakout in either direction. However, the direction of the breakout is unpredictable, so it's essential to wait for confirmation signals, such as increased trading volume or a sharp move outside the bands, before entering a trade.
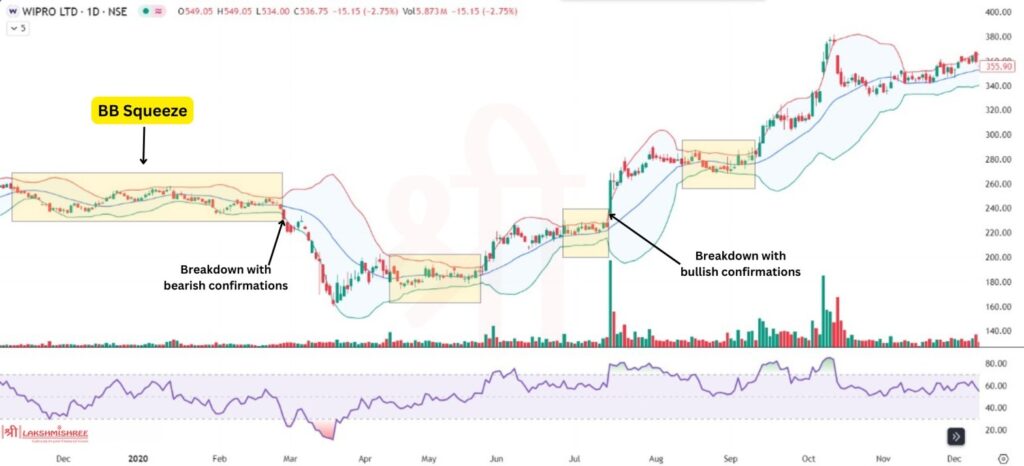
The Bollinger Band Squeeze occurs when the Bollinger Bands contract due to low volatility, signalling a period of consolidation. This happens when the market lacks momentum, and the upper and lower bands come closer together, forming a "squeeze." According to John Bollinger, these periods of low volatility are often followed by high volatility, leading to significant price movements in either direction.
If the price breaks out above the upper band after the squeeze, it often indicates a potential upward trend, creating a buying opportunity. On the other hand, a breakdown below the lower band suggests a potential downward trend, signalling a shorting opportunity. The longer the squeeze, the more powerful the breakout or breakdown is likely to be. For instance, you could observe this on the daily chart of Wipro Ltd. Between 1st January 2020 to 20th March 2020, there was a squeeze, followed by a significant downward move. Later, between 15th June 2020 to 30th September 2020, another squeeze led to an upward breakout.
This strategy is popular among traders because it helps identify major market moves before they happen, providing valuable entry points. However, remember that combining this with other indicators, like volume and moving averages, can confirm the breakout direction and reduce false signals.
Bollinger Bands are a versatile tool for traders looking to understand market volatility and price trends. Whether you’re dealing with a squeeze or watching price movements near the upper or lower bands, this cheat sheet will help you quickly interpret the market's signals and react accordingly.
| Bollinger Band Action | What This Indicates | Potential Reaction |
|---|---|---|
| Upward middle band | Indicates an uptrend | Buy or hold long positions |
| Downward middle band | Suggests a downtrend | Sell or hold short positions |
| Narrow bands (squeeze) | Low volatility; potential for significant price move | Prepare for a breakout; consider entry points |
| Price touching/moving outside the upper band | Potentially overbought | Consider selling or tightening stop-loss orders |
| Price touching/falling outside the lower band | Potentially oversold | Buy or tighten stop-loss orders |
| Price bouncing off the lower band | The lower band is a potential target if price reverses | Consider taking profits or setting a trailing stop-loss |
| Price touches the upper band | Could be a potential exit point if the trend reverses | Consider taking profits or setting a trailing stop-loss |
| Price rebounds from upper/lower bands toward middle | Potential buying or selling opportunity (Bollinger Bounce) | Enter long or short positions; tighten stop-loss orders |
| Price moves outside the band with increased volume | Signals a potential breakout | Enter long positions; set stop-loss below recent lows |
| Decisive move below the lower band with high volume | Could mean a breakdown or start of a bearish trend | Enter short positions; set stop-loss above recent highs |
| Widening bands after a squeeze | Indicates an imminent breakout | Prepare for entry, watch for confirmation |
| Tightening bands | Period of low volatility and potential upcoming breakout | Prepare for a breakout; adjust stop-loss orders |
| Longer squeeze | Indicates a larger breakout could be coming | Prepare for larger price move; increase position size |
Avoiding false signals with the Bollinger Bands indicator requires combining it with other technical tools. While Bollinger Bands can indicate overbought or oversold conditions, these alone can be misleading during strong trends. To filter out false signals, use complementary indicators like the Relative Strength Index (RSI) to confirm momentum or moving averages to validate trend direction. Additionally, waiting for price action confirmation, such as a significant breakout with increased volume, can help reduce the risk of acting on misleading signals.
While Bollinger Bands are widely used for measuring volatility and identifying potential market moves, they have certain limitations that traders should be aware of. Below are the key drawbacks of using this indicator:
Mastering the Bollinger Bands indicator can give traders a deeper understanding of market trends, volatility, and potential breakouts. This versatile tool helps identify whether a security is overbought or oversold, and when combined with other technical indicators like the Relative Strength Index (RSI) or moving averages, it can provide even more accurate signals.
The most common setting is a 20-period moving average with bands set at 2 standard deviations. However, this can be adjusted depending on your trading style or the asset being analyzed.
Bollinger Band width measures the distance between the upper and lower bands. A wider width signifies higher volatility, while a narrow width suggests low volatility, often preceding a breakout or breakdown.
Yes, Bollinger Bands are often used by day traders to spot short-term trading opportunities, particularly during a Bollinger Band squeeze. However, it’s recommended to use additional indicators for confirmation.
When the bands tighten, it indicates low volatility, often leading to a significant price move. This is referred to as a "Bollinger Band Squeeze," which can signal the start of a new trend, either upward or downward.

