logo-lakshmshree
Posted on  August 10, 2024 under  by Ayush Maurya

8 Best Swing Trading Patterns

Have you ever wondered how some people seem to find the right moment to buy and sell stocks? Well, the secret often lies in understanding swing trading patterns. These patterns act like treasure maps, guiding traders to spot great opportunities in the stock market. By learning to recognise these patterns, you can make smarter decisions about when to jump in and when to cash out.

Swing trading can feel like a game of piecing together puzzle pieces. You have to watch the charts and identify clues that would tell you what might happen next. For beginners, this can be quite tricky. Even seasoned traders spend a lot of time studying charts to get it right. But don't worry! We're here to make it easier for you.

What is Swing Trading Pattern?

Swing trading is when an investor tries to gain profit from the short-term price changes of stocks. Unlike day trading, where trades are made within a single day, swing trading involves holding onto stocks for several days or even weeks. This strategy aims to catch the "swings" in the market—that is, upward and downward movements in stock prices.

A swing trading pattern is a unique formation or shape that appears on the stock graph to indicate future price movements. These are designs on charts that can be used to hint at future price action, thus helping a trader establish if the price of a stock will rise or fall. A trader, by studying the graph patterns, is able to understand the movement and hence judge when to sell or buy a stock.

Why It Matters?

Understanding swing trading patterns is important because it allows traders to navigate the market more effectively. If you can identify a good pattern, you will have a roadmap that gives you clear directions on what to do.

Here are some key reasons why swing trading patterns are important:

  • Identify Opportunities:  Patterns help spot when the stock is likely to rise or fall, which would allow entry at low money and selling high.
  • Reduce Risk: Knowing patterns can help avoid bad trades and minimise losses.
  • Boost Confidence: Understanding patterns makes you more confident in your trading decisions.
  • Improve Strategy: Even professional traders use patterns to fine-tune their trading strategies and help them make more exact trades.

You can improve your trading skills by mastering swing trading patterns and potentially see better results.

List of 8 Best Swing Trading Patterns

Overview of Best Swing Trading Patterns

These patterns show potential movements of the market, thus helping traders come up with informed decisions on when to enter or leave a trade. Now, let's go deeper into some of the most essential chart patterns used in swing trading and see how they work.

1. Ascending Triangle

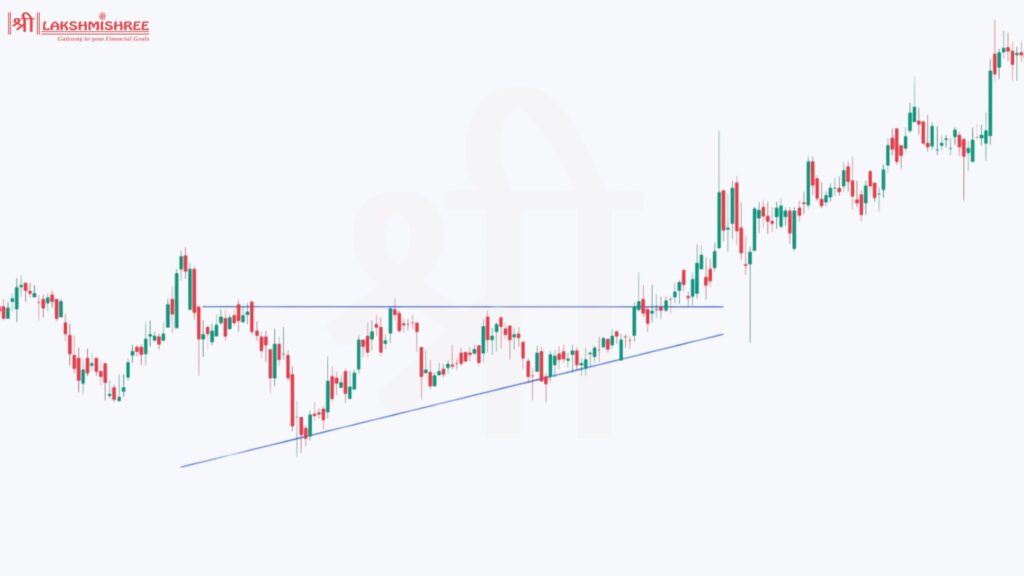
The Ascending Triangle is a chart pattern indicating a bullish market sentiment with the likelihood of an upward breakout. It is formed when the price has higher lows with constant highs, making a triangle pointing upwards.

  • What It Looks Like: On the chart, you'll notice the lows getting progressively higher, while the highs stay around the same level. This creates a rising trend line below the price action and a horizontal resistance line above.
  • How It Works: The pattern indicates that buyers gradually gain strength, pushing the price higher, even though they haven’t yet overcome the resistance level.
  • How to Trade It: Breaking above this resistance line is usually when most traders look to buy, as it likely signals upward momentum will continue. That means waiting for a surge in trading volume usually is a good way to confirm the breakout.
Ascending Triangle pattern

2. Descending Triangle

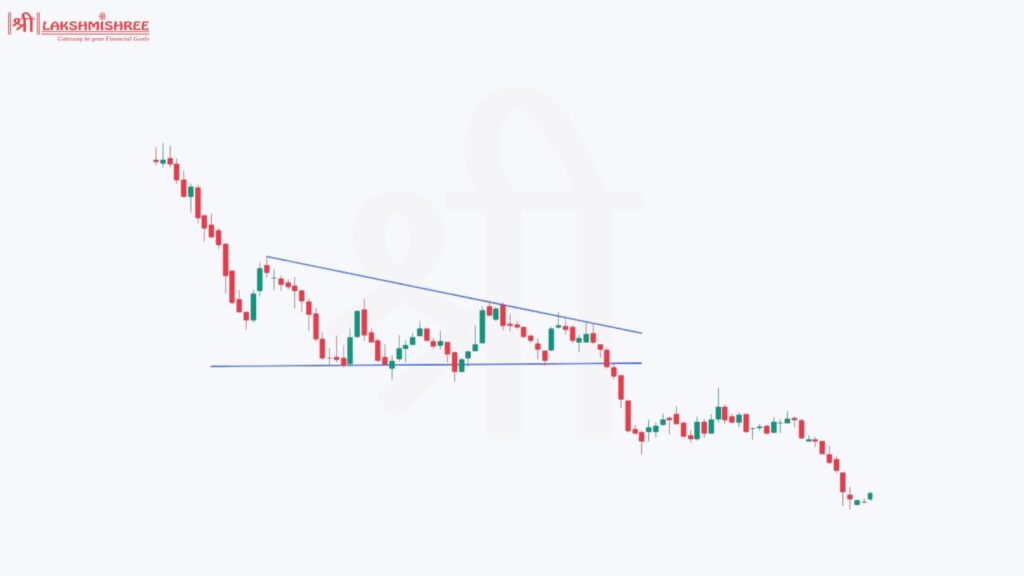
Opposite to the ascending triangle, the Descending Triangle is a bearish pattern that looks forward to a possible breakout to the downside. It is formed when the price has lower highs while the lows remain constant.

  • What It Looks Like: On the chart, the highs are getting progressively lower, forming a descending trend line above the price action, while the lows stay at a consistent level, creating a horizontal support line.
  • How It Works: The pattern suggests that sellers are increasingly taking control, pushing the price lower, even though they haven’t yet broken through the support level.
  • How to Trade It: The most common practice of traders is to sell or short-sell upon the break below the support line with the expectation that the trend will take a further downward move. Again, an increase in volume can be used to confirm the breakout.
Descending Triangle pattern

3. Head and Shoulders

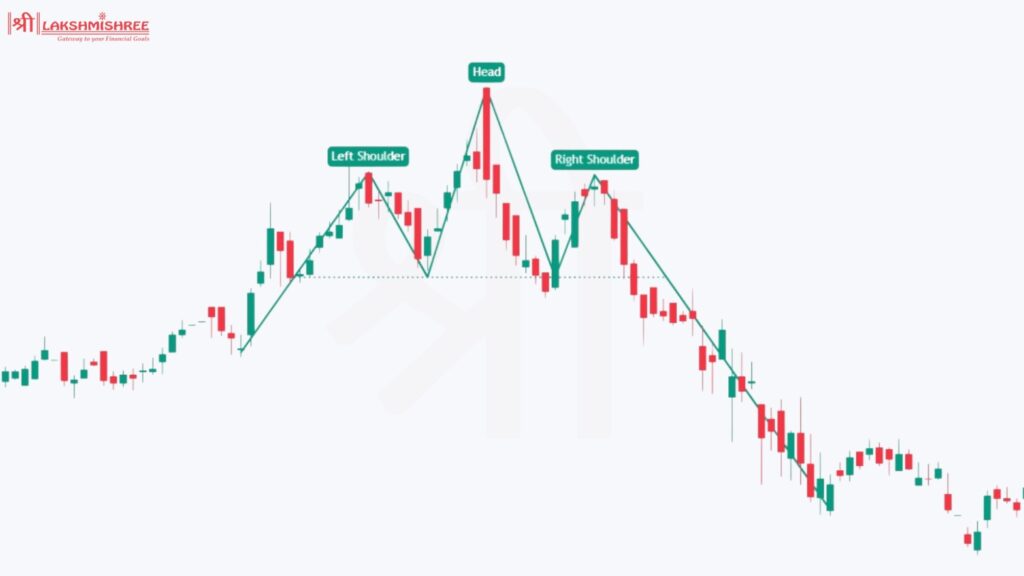
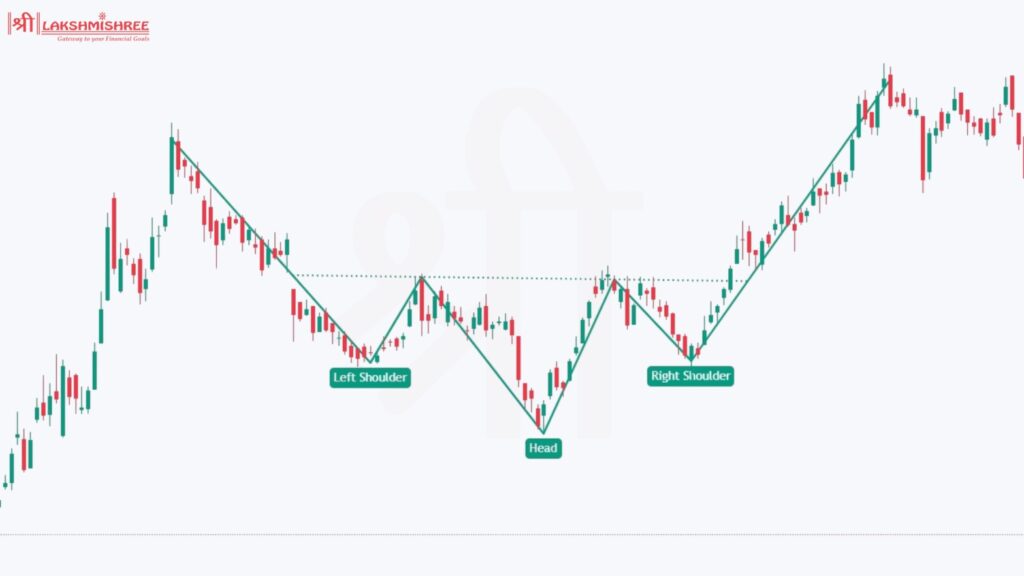
The Head and Shoulders pattern is one of the most recognizable and generally more reliable swing trading patterns, usually indicating a trend reversal from bullish to bearish.

  • What It Looks Like: This pattern has three peaks: a high peak in the middle (the "head") flanked by two smaller peaks on either side (the "shoulders"). The pattern is complete when the price falls below the neckline, which is a line drawn through the bottoms of the two shoulders.
  • How It Works: The pattern suggests that the market has reached a peak, and the trend is about to reverse in direction. In essence, the head represents a final high before the trend changes, while the shoulders indicate that the market is struggling to hold higher prices.
  • How to Trade It: Traders typically wait for the price to break below the neckline before selling, as this confirms that the bearish reversal is underway. To avoid false signals, it's often advisable to wait for the price to close below the neckline with a significant increase in volume.
Head and Shoulders patten

4. Inverse Head and Shoulders

The Inverse Head and Shoulders pattern is the opposite of the standard Head and Shoulders pattern and indicates a reversal from a bearish to a bullish trend.

  • What It Looks Like: This pattern features three troughs: a deep trough in the middle (the "head") flanked by two shallower troughs (the "shoulders"). The pattern is complete when the price rises above the neckline, which is drawn through the peaks of the two shoulders.
  • How It Works: The pattern suggests that the market has found a bottom and is preparing to reverse direction. The head represents the final low before the trend changes, while the shoulders indicate that the market is struggling to go lower.
  • How to Trade It: Here, generally, a trader looks to buy when the price breaks above the neckline because it confirms that the bullish reversal is in place. The same as with the standard Head and Shoulders pattern goes for confirming a breakout: a close above the neckline on higher volume.
Inverse Head and Shoulders pattern- best swing pattern

5. Double Top

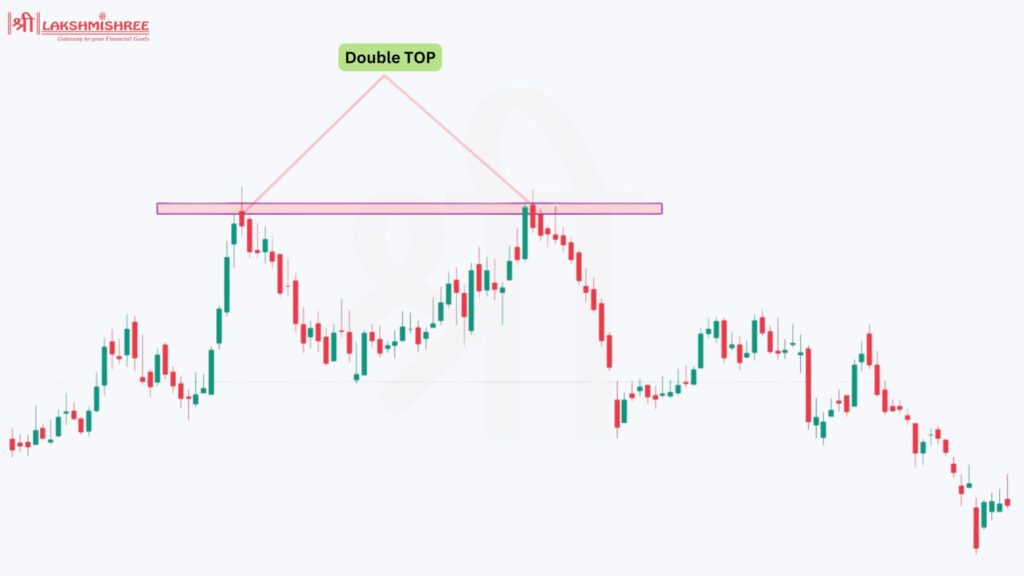
The Double Top chart pattern is a bearish trend reversal pattern, and its formation takes place after an uptrend in price activity. It provides information that the uptrend is losing power and might soon reverse.

  • What It Looks Like: This pattern is characterized by two peaks at roughly the same level, with a trough in between. The pattern is complete when the price falls below the support level, which is drawn through the trough between the two peaks.
  • How It Works: The pattern indicates that the market has tried twice to break through a certain price level but failed, suggesting that the buying pressure is weakening.
  • How to Trade It: Traders typically sell or short-sell when the price breaks below the support level, as this confirms that the bearish reversal is likely to continue. It's important to watch for an increase in volume to confirm the pattern.
Double Top pattern- best swing trading pattern

6. Double Bottom

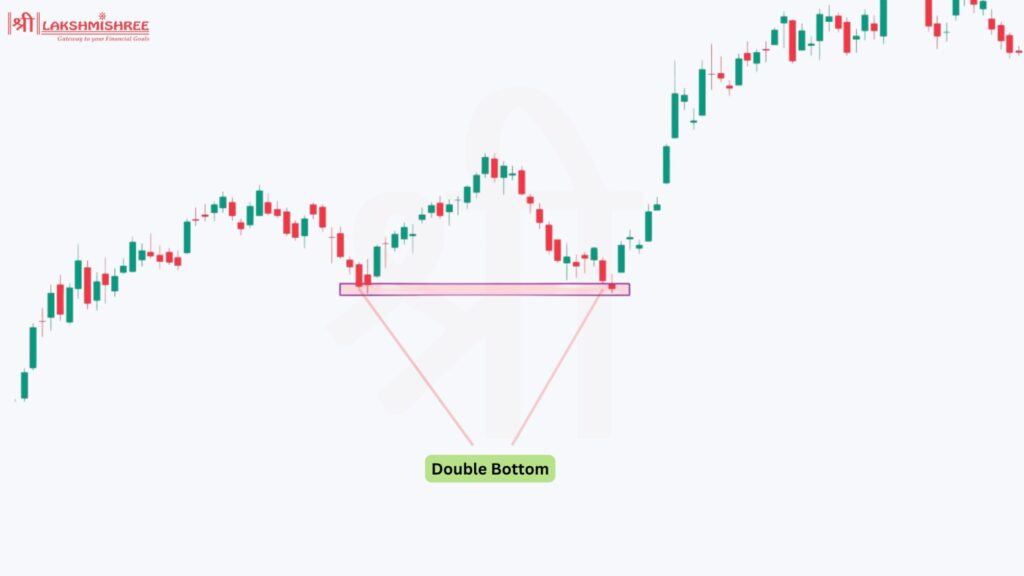
The Double Bottom is the bullish version of the Double Top. It occurs after a downward trend and shows that the down trend might have started losing its momentum and will possibly reverse in a short span of time.

  • What It Looks Like: This pattern is characterized by two troughs at roughly the same level, with a peak in between. The pattern is complete when the price rises above the resistance level, which is drawn through the peak between the two troughs.
  • How It Works: The pattern indicates that the market has tested a certain price level twice and found support, suggesting that the selling pressure is weakening.
  • How to Trade It: Traders typically buy when the price breaks above the resistance level, as this confirms that the bullish reversal is likely to continue. As always, a surge in volume can help confirm the breakout.
Double Bottom pattern- best pattern for swing trading

7. Cup and Handle

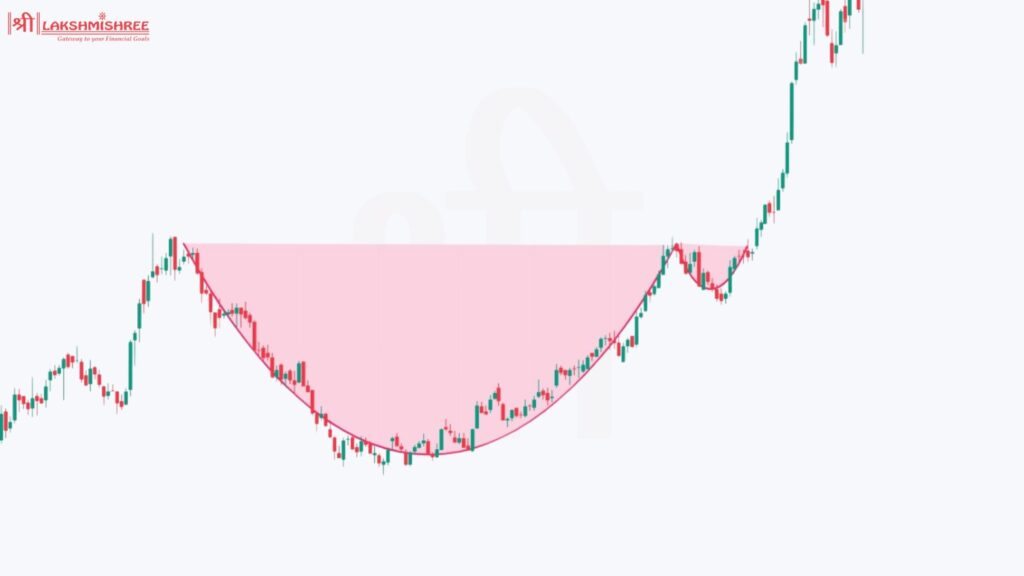
The Cup and Handle is a bullish continuation pattern that signals a possible upward move after a consolidation period. It is one of the most reliable swing trading patterns and thus often used by traders looking to identify potential buying opportunities.

  • What It Looks Like: The pattern resembles a teacup with a handle. First, the price gradually falls and then rises, forming the "cup." The "handle" forms when the price dips slightly after the cup before continuing its upward trend.
  • How It Works: The pattern suggests that the market has paused to consolidate but is preparing for another upward move. The cup represents the consolidation phase, while the handle is a brief pullback before the price breaks out higher.
  • How to Trade It: The best entry comes when the price breaks higher than the resistance at the top of the handle. The breakout usually is a sign for the resumption of the uptrend. Look for increased volume to confirm the breakout.
Cup and Handle pattern

8. Flags

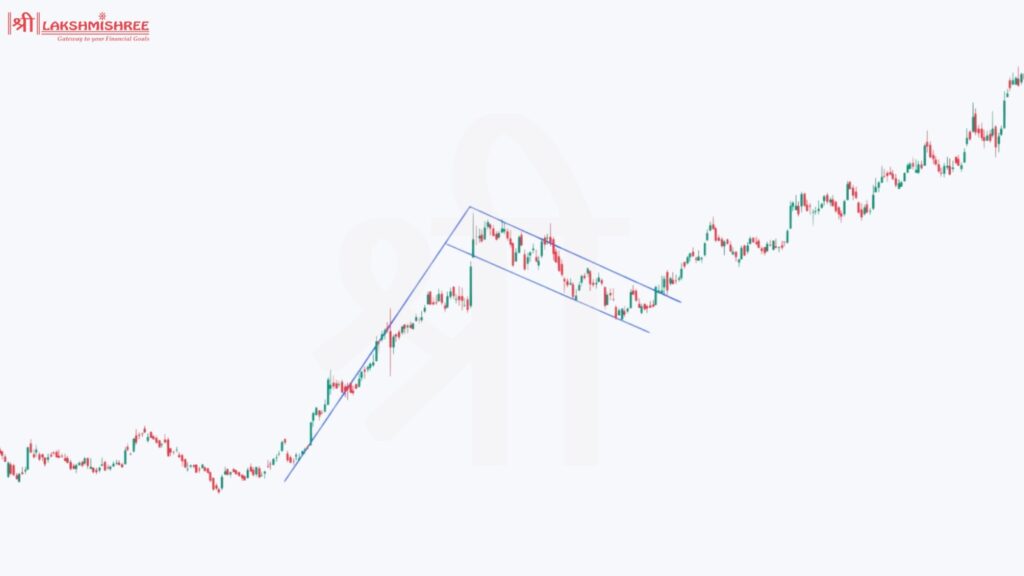
Flag patterns are short-term continuation patterns that occur after a significant price move. They suggest a temporary pause in the market before the resumption of the move in the same direction.

  • What It Looks Like: The pattern forms a small rectangle, or "flag," on the chart, with the flagpole representing the strong initial move. The flag shows a consolidation period where the price moves slightly sideways.
  • How It Works: The pattern suggests that after a sharp price move, the market is pausing to catch its breath before continuing in the same direction. The flagpole indicates the direction of the trend, and the flag shows that the market is consolidating within a narrow range.
  • How to Trade It: Traders usually enter the market when the price breaks out of the flag pattern in the direction of the previous trend. If the breakout is accompanied by higher volume, it confirms that the trend is likely to continue.
Flags pattern- pattern for swing trading

How to Apply Swing Trading Patterns Effectively

Applying swing trading patterns effectively requires a strategic approach that combines technical analysis with disciplined execution. Here's a straightforward guide to get you started:

  1. Identify the Pattern: Never rush into any trade without appropriately identifying a recognizable pattern (like the Head and Shoulders or Cup and Handle) on any chart. Take time; rushed decisions generally tend to be mistakes.
  2. Confirm with Indicators: Technical indicators such as RSI, MACD, or even Moving Averages can be used to confirm the pattern of the market. They will give insights into the momentum of the market and whether to trade or wait.
  3. Set Entry and Exit Points: Determine your entry point based on the pattern's breakout level. Equally important, set clear stop-loss and take-profit levels. This ensures you have a predefined plan, reducing emotional decision-making during trades.
  4. Monitor Market Conditions: Stay aware of broader market trends and news events that could impact your trades. Even the most reliable patterns can fail in volatile or news-driven markets.

Technical Indicators to Complement Swing Trading Patterns

Technical indicators are crucial for validating swing trading patterns and enhancing decision-making. The relative strength index (RSI) is one such indicator that measures the speed and change of price movements. RSI helps identify overbought or oversold conditions, providing confirmation for trend reversals or continuations that align with your swing trading patterns.

Moving Averages (MA) is another essential tool, particularly the 50-day and 200-day moving averages, which help identify the overall trend direction. When a pattern aligns with a moving average crossover, it often signals a stronger trade opportunity, providing traders with added confidence in their positions.

The Moving Average Convergence Divergence adds to this by providing momentum information. MACD plots the relationship of two moving averages; when there is a crossover and it forms a pattern, it can be real strong for a signal in entering or exiting a trade. Finally, Bollinger Bands are great for gauging the volatility in the market. They create a range around a moving average that can be used to spot potential breakouts or reversals. When the price pattern reaches the upper or lower band, this could indicate you are in an overbought or oversold condition for added power in your pattern analysis.

Swing Trading Patterns for Entry and Exit Strategies

Mastering entry and exit strategies is vital for successful swing trading, and patterns play a crucial role in this process. By recognising specific patterns like the Cup and Handle or Double Bottom, traders can identify moments when the market is likely to make a significant move. These patterns signal potential price swings, providing traders with a roadmap for entering positions at the optimal time.

The benefits associated with the swing trading patterns at trade entry points are numerous. For instance, the breakout from the handle in a Cup and Handle pattern usually signals a strong bullish move and hence should be an ideal point for entry. On the other hand, a Double Bottom could be confirmed to indicate that the market is getting ready to reverse its trend, so it would be time to get long. The key is to look for these patterns in conjunction with some other indicators, including volume spikes that could validate the strength of the expected move.

Exit strategies are just as critical and often involve setting a target price based on previous support or resistance levels identified within the pattern. For example, after entering a trade based on a Cup and Handle pattern, setting an exit point near the previous high (resistance) helps ensure that profits are secured before the market reverses. Alternatively, setting a stop-loss at a level below the pattern's low can help minimise potential losses if the trade doesn't go as planned.

Conclusion

Understanding and utilising the best swing trading patterns is essential for anyone navigating the stock market confidently. When combined with technical indicators and thorough chart analysis, these patterns provide traders with a strategic edge. Whether you're identifying optimal entry and exit points or avoiding common mistakes, mastering swing trading patterns can significantly enhance your trading success. With these strategies as part of your trading routine, you will be better positioned to benefit from market swings and achieve your financial goals.

Frequently Asked Questions

1. What is the best swing trading pattern for beginners?

For beginners, the double-bottom pattern is a great starting point. It's relatively easy to identify and signals a potential reversal, making it a reliable pattern for new traders.

2. How reliable are swing trading patterns?

Swing trading patterns can be very reliable when used correctly, especially when combined with other technical indicators like RSI or MACD. However, no pattern guarantees success; market conditions should always be considered.

3. Can swing trading patterns guarantee profits?

While swing trading patterns increase the likelihood of making profitable trades, they don't guarantee profits. Effective risk management and disciplined execution are also critical to achieving consistent success.

4. How often should I trade using swing trading patterns?

The frequency of trades depends on market conditions and the specific patterns you’re tracking. It's more important to focus on high-quality setups than to trade frequently.

5. Do I need to use technical indicators with swing trading patterns?

Yes, technical indicators like Moving Averages, RSI, and MACD can complement swing trading patterns by providing additional confirmation and improving the accuracy of your trades.

Disclaimer: This article is for educational purposes only and should not be considered financial advice. Always conduct your research and consider consulting with a financial advisor before making any investment decisions.
Ayush Maurya

Written by Ayush Maurya

Ayush is a seasoned financial markets expert with over 3years of experience. He has a passion for breaking down complex financial concepts into simple, digestible terms. Through his 50+ articles, Ayush has helped countless individuals navigate the often intimidating world of finance.

open-account-ad-2

Social Share

Subscribe to Our Newsletter

Loading
CIN No U74110MH2005PLC157942     |    Member Ship Details     |    BSE-3281     |    NSE-12817     |    MCX-55910     |    DP:IN-DP-CDSL-490-2008     |    DPID:12059100    |    SEBI Regn. No.: INZ000170330     |    Mutual Fund: ARN-77739    |    Research Analyst: registration number INH000014395
logo-lakshmshree-white
Lakshmishree Investment & Securities Ltd. was incorporated in 2005. We are a Corporate Member of NSE, BSE, MCX and Depository Participant with CDSL.
Most Popular in LISPL
Copyright @ 2024 © Lakshmishree Investment & Securities Ltd. All Right Reserved.