Options trading offers significant opportunities but comes with unique challenges that demand precision and strong market analysis skills. To navigate these complexities, traders rely on technical indicators, which are guiding tools to identify trends, manage risks, and make smarter trading decisions.
In this article, we explore the best indicators for options trading, such as EMA, RSI, Bollinger Bands, and demonstrate how to apply them to improve trading outcomes effectively.
Options trading is a type of financial trading where you buy or sell contracts, known as “options,” that give you the right—but not the obligation—to buy or sell an asset at a predetermined price within a specific time frame. The underlying asset could be stocks, indices, commodities, or currencies. Unlike traditional stock trading, where you directly buy or sell shares, options trading allows you to profit based on price movements without owning the asset.
Let’s break it down with an example:
Suppose the stock price of XYZ Ltd. is ₹500, and you expect it to rise to ₹550. Instead of buying the stock, you purchase a call option for ₹10 per share, which gives you the right to buy the stock at ₹500. If the price rises to ₹550, your profit would be ₹40 (₹50 gain - ₹10 premium). If the price falls, your maximum loss is limited to ₹10, the premium you paid.
Alternatively, with a put option, if you expect the price to drop to ₹450, you can buy an option to sell the stock at ₹500. If the price drops, the value of your options increases, allowing you to profit from the fall.
Using the best indicators for options trading is essential to identify trends, measure market momentum, and assess sentiment accurately. Tools like EMA, RSI, and PCR are popular among traders as they provide precise signals, helping you make informed trading decisions.
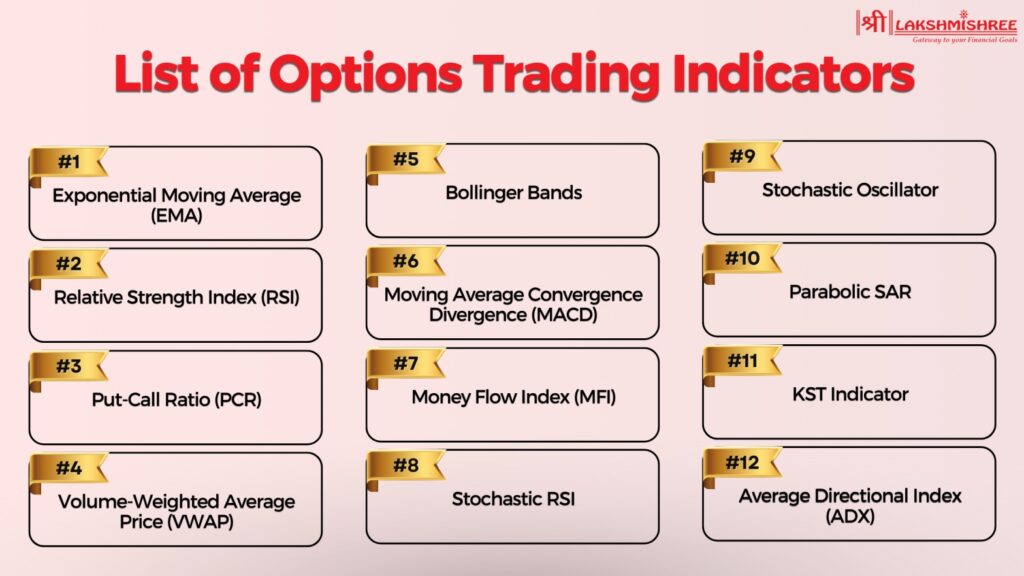
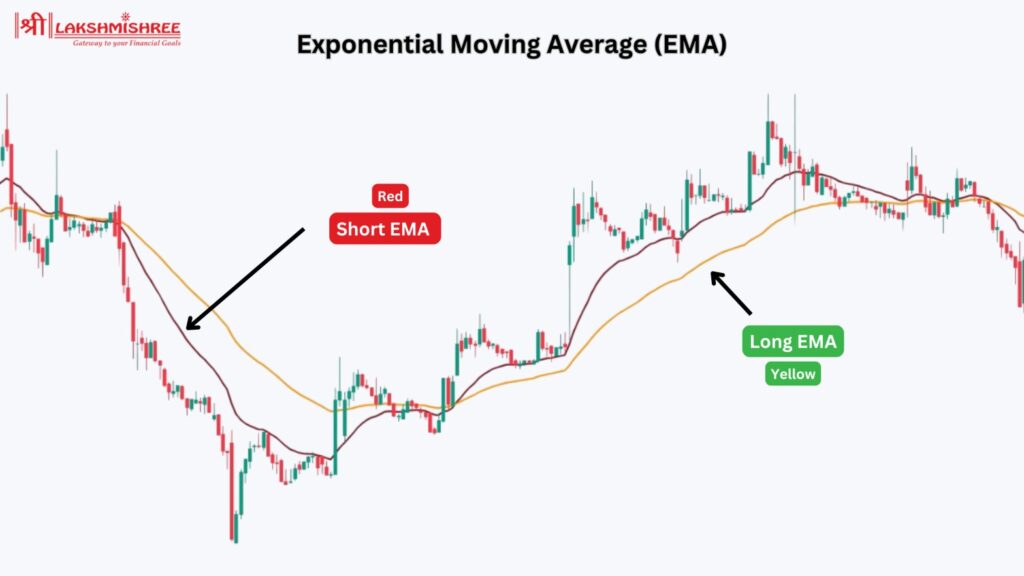
The Exponential Moving Average (EMA) is a widely used tool to identify short-term and long-term market trends. By assigning more weight to recent prices, it reacts faster to market changes than the Simple Moving Average (SMA). This makes it ideal for options traders looking for precise entry and exit points.
How it works:
When the price is above the EMA, it indicates an uptrend, signalling potential buying opportunities. Conversely, if the price falls below the EMA, it signals a downtrend, indicating selling opportunities. Traders often use two EMAs—one short-term (e.g., 9-day) and one long-term (e.g., 21-day)—to identify crossovers.
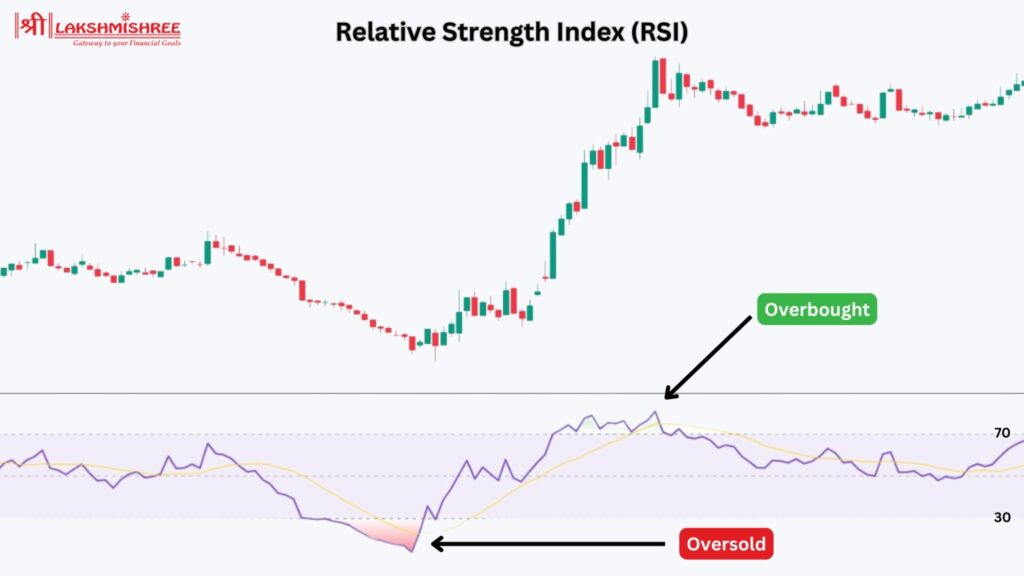
The Relative Strength Index (RSI) is one of the best indicators for option trading; it is a momentum oscillator that measures the speed and change of price movements on a scale of 0 to 100. It helps traders identify overbought and oversold conditions, which are crucial for timing entry and exit points in options trading.
How it works:
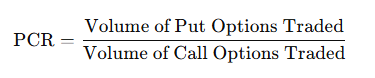
The Put-Call Ratio (PCR) is widely used as the best indicator for options trading, measuring the ratio of put options traded to call options traded over a specific period. This ratio gives traders a deeper understanding of the market’s prevailing sentiment—whether it is leaning bullish, bearish, or neutral.
The PCR is highly valuable in helping traders predict potential market reversals, identify overbought or oversold conditions, and fine-tune their trading strategies.
Formula for Put-Call Ratio (PCR):
For example, if 1,200 puts and 800 calls are traded for a stock, the PCR would be:
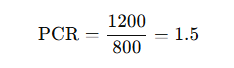
This value suggests more bearish sentiment in the market, as traders buy more puts than calls.
How to Interpret the PCR
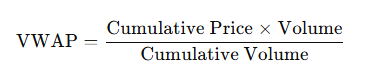
The Volume-Weighted Average Price (VWAP) is a popular indicator used in options trading to determine the average price of an asset, weighted by the volume traded during a specific period. VWAP helps traders identify the market's fair value and is a benchmark for intraday trading decisions.
VWAP calculates the average price by dividing the total value of traded assets (price × volume) by the total trading volume during a session.
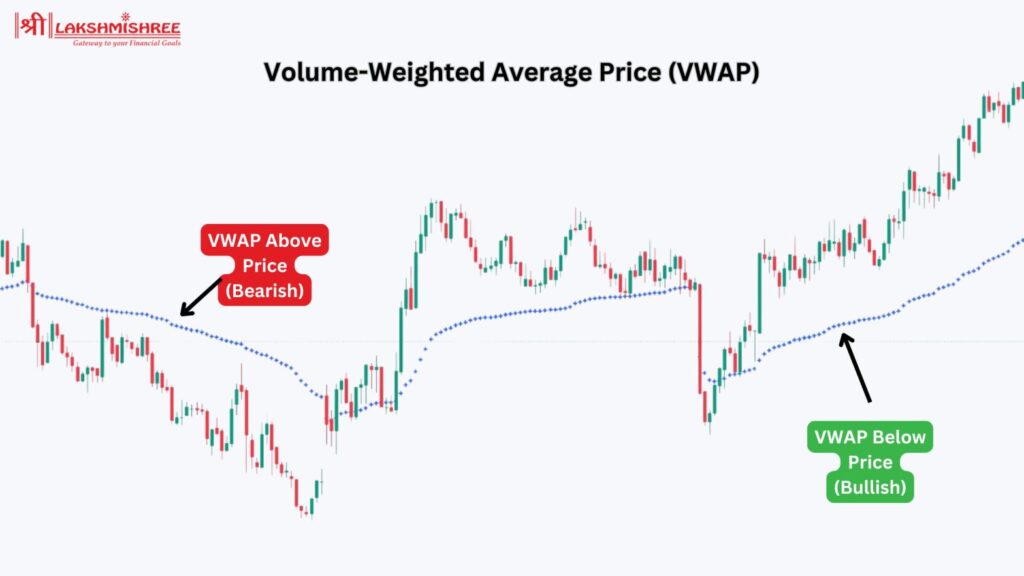
Why VWAP is Useful in Options Trading:

Bollinger Bands is one of the best indicators for option trading and is a volatility-based indicator consisting of three lines:
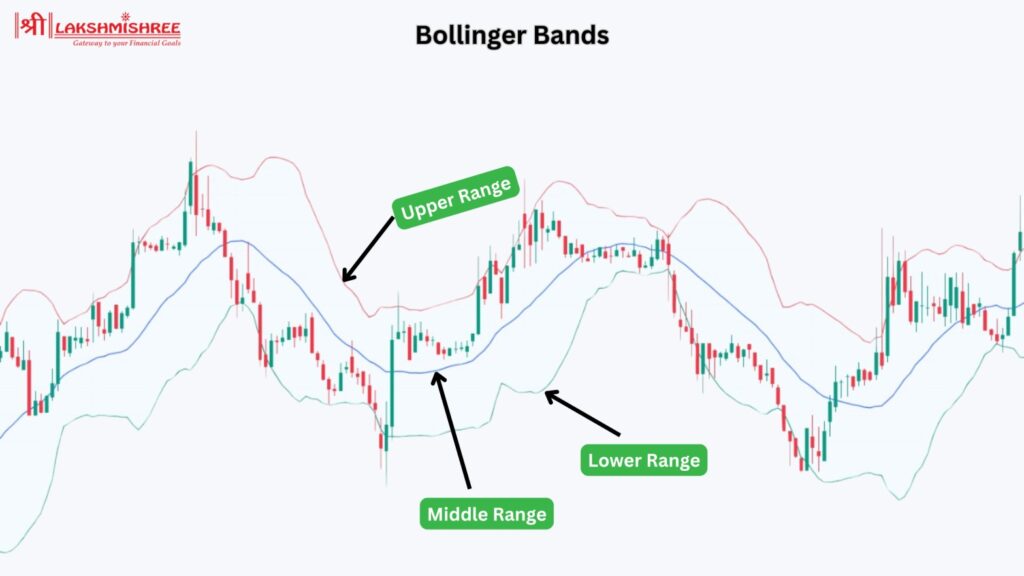
How Bollinger Bands Work:
Bollinger Bands expand and contract based on market volatility.
The Moving Average Convergence Divergence (MACD) is a momentum indicator that tracks the relationship between two moving averages:
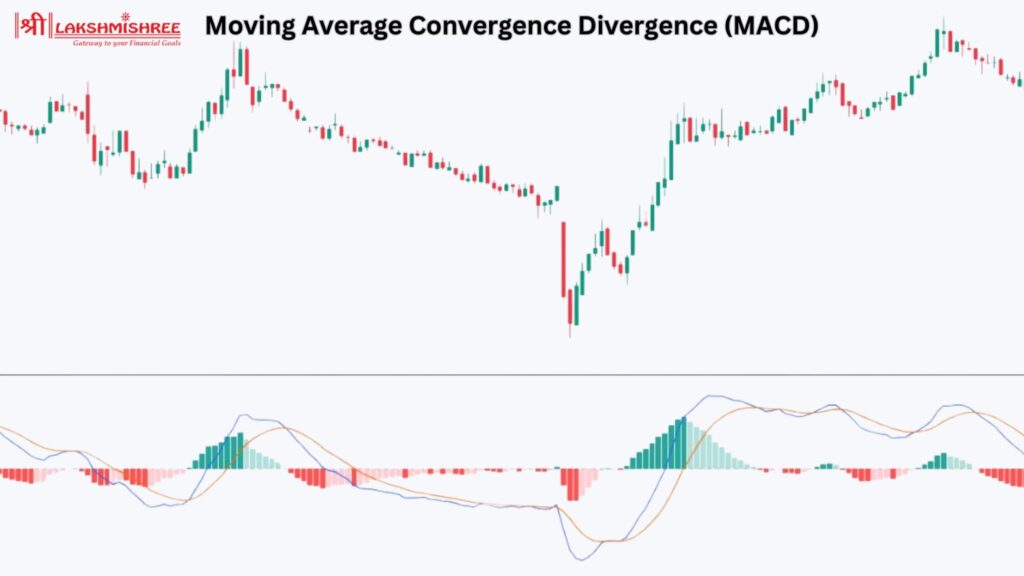
How MACD Works:
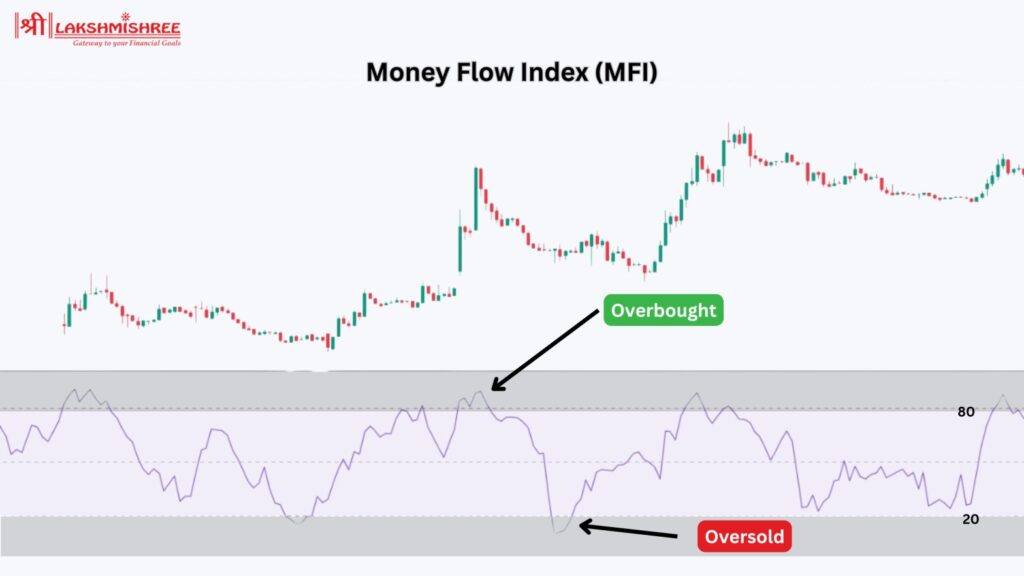
The Money Flow Index (MFI) is a volume-weighted momentum indicator that measures the inflow and outflow of money into an asset over a specific period. It is similar to RSI but incorporates volume into its calculations.
How MFI Works:
MFI Formula:
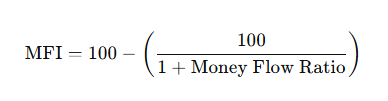
Where:
Combining multiple indicators can enhance the accuracy of your trading decisions by providing confirmation and reducing false signals. Here’s how to use them effectively in options trading:
1. Pair Trend Indicators with Momentum Tools
Using trend-following indicators like the Exponential Moving Average (EMA) with momentum indicators such as the Relative Strength Index (RSI) helps confirm both trend direction and strength.
2. Use VWAP with Bollinger Bands
The Volume-Weighted Average Price (VWAP) works well for intraday trading, especially when paired with breakout indicators like Bollinger Bands.
3. Combine PCR with Technical Indicators
The Put-Call Ratio (PCR) is a key sentiment indicator but becomes even more useful when combined with tools like MACD or MFI.
4. Look for Divergences
Divergences between price and momentum indicators like RSI or MFI can signal potential reversals.
5. Avoid Overlapping Indicators
Using multiple indicators with the same function can cause confusion. Instead of pairing similar tools like SMA and EMA, use EMA with a momentum indicator like RSI or MFI for better clarity.
Options trading can be highly rewarding but also comes with significant risks. To trade efficiently and minimise losses, keep these crucial points in mind:
Technical indicators help traders identify trends, momentum, volatility, and price levels to optimise entry and exit points. Here’s how you can use them effectively:
You can filter out noise and make data-driven decisions by aligning indicators with your options trading strategy.
To succeed in options trading, simplify complex decisions by using the best indicators for options trading, like EMA for trend analysis, RSI for momentum, Bollinger Bands for volatility, and VWAP for fair value assessment. However, no single tool guarantees success—combining multiple indicators, managing risks, and adapting to market conditions is essential. With a disciplined approach and thorough testing, you can gain the edge needed to succeed in the dynamic world of options trading.
Some of the best indicators for options trading include the Exponential Moving Average, Relative Strength Index, Put-Call Ratio, Bollinger Band and MACD, while Combining these indicators helps traders better understand price movements, confirm signals, and develop effective options trading strategies.
Indicators like EMA, RSI, and VWAP are vital because they help traders identify trends, measure price momentum, and spot overbought or oversold conditions. These tools simplify complex market movements and allow for more informed trading decisions.
No, options trading indicators are not 100% accurate. However, combining the best indicators for options trading, like EMA for trends, RSI for momentum, and Bollinger Bands for volatility, can increase reliability. Testing strategies and aligning indicators with market conditions improve accuracy.
The key to successful options trading lies in combining multiple indicators for confirmation, setting clear stop-loss and target levels, and trading with discipline. Tools like EMA and RSI can provide stronger and more reliable signals when used together.
VWAP is one of the most accurate indicators for scalping in options trading. It helps identify intraday trends and fair value levels. Combining VWAP with RSI or Bollinger Bands improves precision and timing.
The VWAP (Volume Weighted Average Price) is highly effective for intraday options trading. It helps traders identify fair value and momentum shifts during a single trading session.
Disclaimer: This article is intended for educational purposes only. Please note that the data related to the mentioned companies may change over time. The securities referenced are provided as examples and should not be considered as recommendations.
