logo-lakshmshree
Posted on  November 12, 2024 under  by Ayush Maurya

Descending Triangle Pattern in Trading: A Complete Guide

In the stock market, prices often follow certain patterns, and learning to spot them can help you make smart trading choices. One of these patterns is called the Descending Triangle Pattern. Imagine a stock that keeps dropping to a certain price but struggles to go much higher over time. This pattern may indicate that sellers are gaining strength, and the price could soon break lower.

In this blog, we’ll explain what the descending tri-pattern means, how to spot it on a stock chart, and ways you can use it to improve your trading game.

What is a Descending Triangle Pattern?

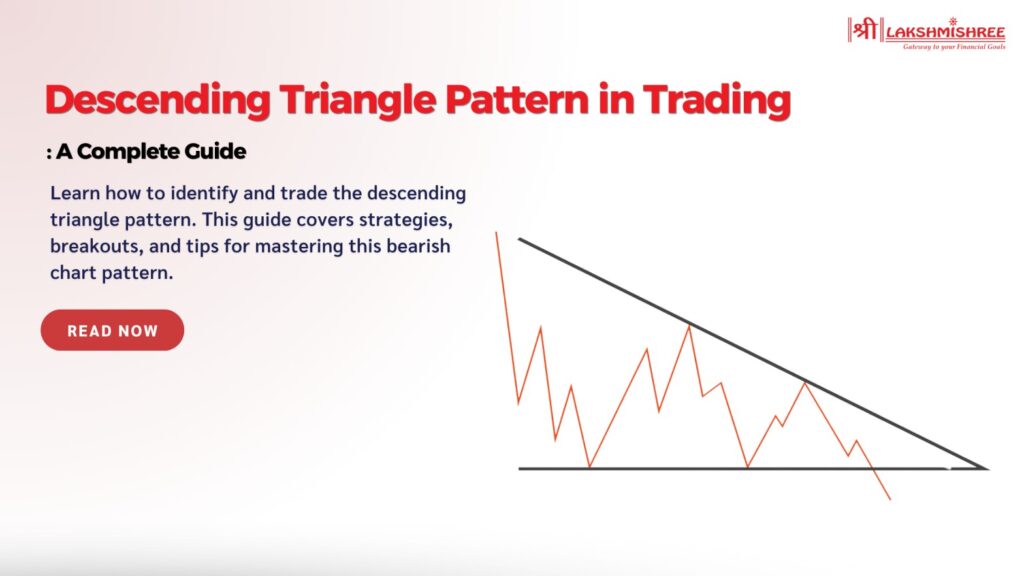
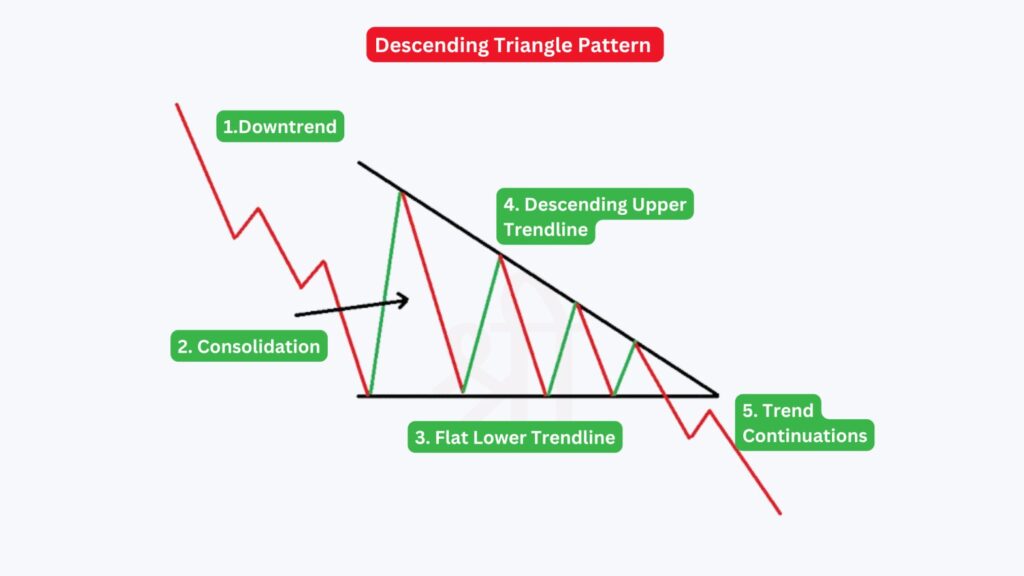
A Descending Triangle is a bearish chart pattern traders often look for when analysing stock prices. This pattern is formed by two key trendlines: a horizontal line connecting a series of lows (the support level) and a downward-sloping line connecting a series of lower highs (known as the resistance level). The shape created by these lines looks like a triangle pointing downward.

This chart pattern indicates that the selling pressure is increasing, whereby buyers cannot push the price upwards. When the price nears the point where both lines meet, it ultimately results in a breakout. In case of breaking the price below the support level, then the indication is a possible downtrend, which further suggests the stock may have more falls. Traders are well aware of this chart pattern so that they may make an informed decision during a bear market environment.

What Does a Descending Triangle Pattern Tell You?

The Descending Triangle Pattern is a key indicator for traders, providing insight into market trends and potential price movements. This pattern typically suggests buyers are losing strength as the stock price keeps forming lower highs while finding support at a certain level.

Here are the key messages conveyed by the descending triangle:
  • Weakening Bullish Momentum: The pattern reflects a shift in market dynamics, showing that buying interest is decreasing.
  • Bearish Breakdown Potential: When the price approaches the support level, there is a high likelihood of a breakout below this line, signalling further declines.
  • Indication of Selling Pressure: The formation of lower highs demonstrates that sellers are becoming more aggressive in the market.
  • Opportunities for Short Positions: Traders may view this pattern as a chance to sell or take short positions, anticipating a downward price movement.
Descending Triangle Pattern

When to Spot Descending Triangles: Uptrends vs. Downtrends

While this pattern is generally associated with downtrends, it can also appear during uptrends, though with different implications. Here’s a practical breakdown of how it functions in each scenario:
Spotting Descending Triangles in Downtrends

  • Main Use Case: The descending triangle pattern is most commonly found within a downtrend. When it appears in a downtrend, it often signals a continuation of the bearish momentum, meaning that prices may continue to fall.
  • Pattern Behavior: The price forms a series of lower highs while holding a support level, indicating selling pressure. Traders closely watch this pattern to prepare for a potential breakdown below the support level, which can lead to further declines.
  • Trading Opportunity: When the price breaks below the support level, it confirms the bearish pattern, and traders often see this as a chance to enter a short position or sell existing holdings. This approach is widely used by traders looking to capitalize on a continued downward trend.

Spotting Descending Triangles in Uptrends

  • Rarer Formation: Though less common, descending triangles can also appear in uptrends, acting as a potential reversal signal rather than a continuation.
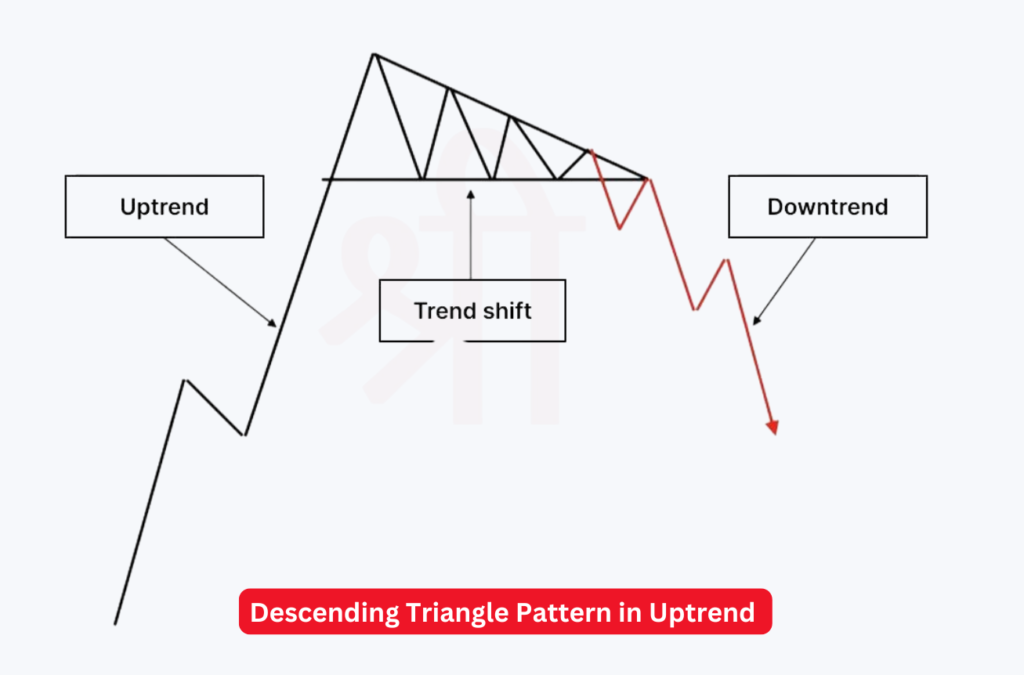
  • Reversal Signal: When a descending triangle forms within an uptrend, it may suggest that buyers are losing momentum and sellers are starting to take control. This could signal an upcoming shift from an uptrend to a downtrend.
  • Trading Approach: Traders often look for a breakdown below the support level as confirmation of this reversal. Once the breakdown occurs, it may signal an opportunity to short the stock or reduce long positions to minimise potential losses.
Descending Triangle Pattern in Uptrend

Descending Triangle Pattern Breakout Strategy

Traders widely use the Descending Triangle Breakout Strategy to capitalize on a potential downward price movement once a breakout occurs. This strategy is especially effective when volume and price action align to indicate a strong bearish signal.
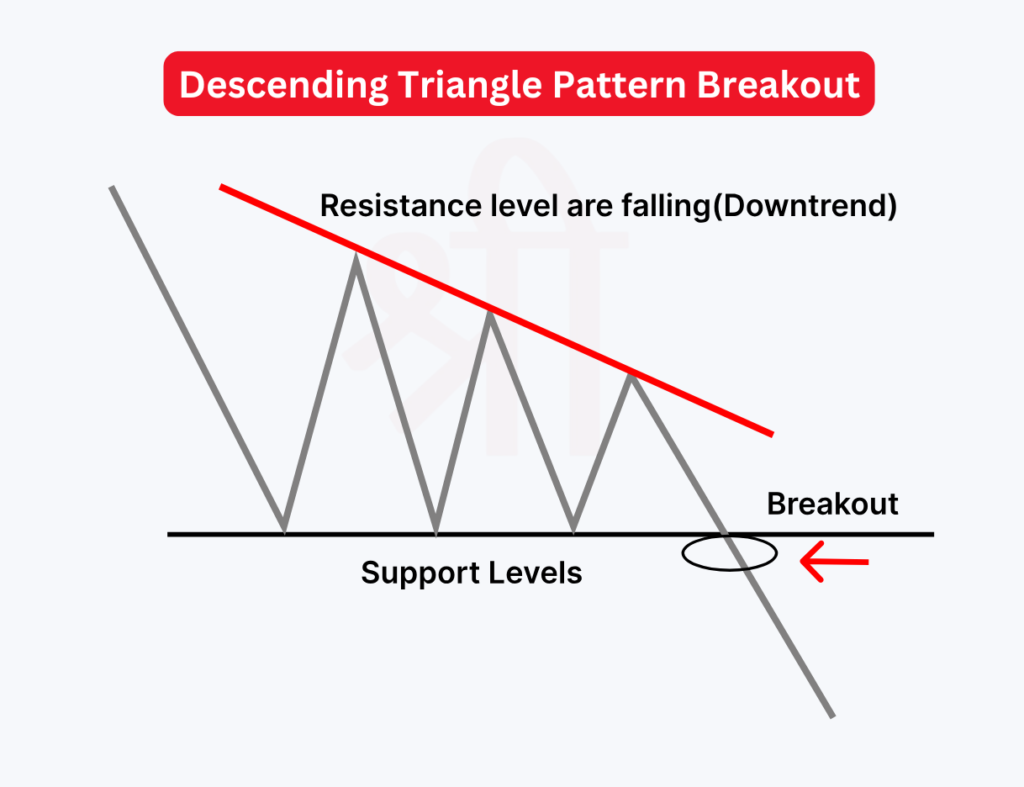
Descending Triangle Pattern Breakout

Here’s a step-by-step approach to applying this breakout strategy:

  • Identify the Setup: Watch for a stock in a downtrend or consolidation phase. In this setup, the descending triangle should display a sequence of lower highs meeting a horizontal support level, suggesting that sellers gradually gain control over buyers.
  • Monitor Volume: Volume levels often decrease as the price nears the triangle’s apex. This decline can signal that a breakout is likely approaching.
  • Confirm with Volume Surge: The breakout typically occurs below the support level, ideally with a spike in volume. This confirms that sellers are firmly in control, making the breakout more reliable.

Descending Triangle Measuring Technique

Once the breakout is confirmed, the Measuring Technique can project a target price for the trade. Here’s how it’s done:

  1. Calculate Pattern Height: Measure the vertical distance between the highest point of the triangle (top of the descending trendline) and the horizontal support level. This measurement gives the pattern height.
  2. Project Target Price Downwards: After the breakout, apply this height downwards from the breakout point to estimate a target price.

Example Calculation

Imagine a stock with a horizontal support level at ₹100 and the highest point at ₹120:

  • Pattern Height = ₹120 - ₹100 = ₹20
  • Target Price = Support Level - Pattern Height
  • Target Price = ₹100 - ₹20 = ₹80

This gives the trader a projected price of ₹80, helping set clear profit targets based on the pattern’s movement.

Start Investing - LISPL Investment

Common Trading Strategies with Descending Triangles

Combining additional technical tools with the descending triangle pattern can strengthen a trader’s confidence in anticipating breakouts. Below are two popular strategies that use Heikin Ashi and Moving Averages alongside descending triangles.

Descending Triangle with Heikin-Ashi Charts

Using Heikin Ashi Charts with descending triangles can make trend identification clearer. Heikin Ashi candlesticks are unique as they smooth price action, making trends easier to spot and reducing “noise.”

  • Identify Trend with Heikin Ashi: Wait for the descending triangle to form. Heikin Ashi candles often turn bullish (green) slightly before a breakout, providing an early indication of a potential reversal or continuation of the trend.
  • Volume and Target Projection: Measure the height between the first high and low within the triangle and project this from the anticipated breakout point. When Heikin Ashi candles align with an increase in volume, it signals a stronger breakout probability.

This combination is especially helpful for short-term trading, as Heikin Ashi charts offer a clearer trend without the usual price fluctuations.

Descending Triangle with Moving Averages

Using Moving Averages with descending triangles pattern can enhance breakout predictions by adding an extra layer of confirmation:

  • Overlay Moving Averages: Place moving averages (such as the 20-day or 50-day MA) on your chart. The descending triangle serves as the primary breakout indicator, while the moving average signals to enter or exit.
  • Breakout Signal: If the price breaks below the triangle’s support line and also crosses below the moving average, it provides a strong bearish signal. This confirmation helps filter out false breakouts and aligns the trade with the existing trend.

Descending Triangles vs. Ascending Triangles

Both descending and ascending triangle patterns are widely recognized chart formations traders use to identify potential trend reversals or continuations. While they share similarities in structure, they convey opposite market sentiments. Here’s a comparison to help understand the differences and trading implications of each:

FeatureDescending TriangleAscending Triangle
Trend DirectionTypically appears in a downtrend (bearish)Usually forms in an uptrend (bullish)
Top Line (Resistance/Trendline)Descending, connecting lower highsHorizontal, connecting equal highs
Bottom Line (Support/Trendline)Horizontal, representing consistent supportAscending, representing increasing support
Market SentimentIndicates selling pressure; sellers control the marketShows buying pressure; buyers dominate the market
Expected BreakoutBreakout below the horizontal support signals a downtrendBreakout above horizontal resistance suggests an uptrend
Trading StrategyShort/sell position upon confirmed breakout downwardLong/buy position upon confirmed breakout upward

These triangle patterns help traders align their strategies with market sentiment, allowing them to anticipate potential breakout directions.

Start Investing - LISPL Investment

When is the Best Time Frame to Trade a Descending Triangle Pattern?

The best timeframe to trade a descending triangle pattern depends on your trading goals and strategy. For day traders and short-term trades, hourly or 15-minute charts may work well as they can capture quick movements around breakouts. Swing traders or those holding positions longer might prefer daily or weekly charts, which can help identify more sustained price movements and avoid smaller, less reliable fluctuations. Confirming breakouts with volume and monitoring the pattern closely to avoid false signals is essential, whichever time frame you choose.

Pros and Cons of Using Descending Triangles

Pros:

  • Clear Entry and Exit Signals: The descending triangle provides structured levels with defined support and resistance, helping traders clearly identify potential entry and exit points, especially around the breakout.
  • Reliable for Bearish Breakouts: In a downtrend, the descending triangle pattern is widely considered reliable for predicting bearish breakouts, making it valuable for traders aiming to capitalize on short-selling opportunities.
  • Applicable Across Timeframes: Descending triangles can be spotted in various timeframes, from intraday to weekly charts. This flexibility makes them useful for day traders and long-term investors alike.

Cons:

  • Risk of False Breakouts: One challenge with descending triangles is the risk of false breakouts, which may trap traders if the price reverses soon after crossing the support level.
  • Volume as a Key Factor: The effectiveness of a descending triangle often relies on volume confirmation. Low volume on a breakout might suggest indecision, reducing the pattern’s reliability.
  • Limited Bullish Signals: Since the descending triangle is typically a bearish pattern, it’s less effective for traders who prefer bullish or upward trends, limiting its application in certain market conditions.

Conclusion

The descending triangle pattern is a valuable tool for predicting potential bearish breakouts and helping traders spot continuation patterns. However, it’s essential to confirm breakouts with volume analysis and avoid making hasty decisions based on initial signals. By carefully combining descending triangles with other technical indicators, traders can make more informed moves and set realistic targets.

Frequently Asked Questions

1. What is a descending triangle pattern?

A descending triangle is a bearish chart pattern that forms when the price creates lower highs while maintaining a horizontal support level. It indicates that selling pressure is gradually increasing, and traders watch for a potential breakout below the support line to signal a downtrend continuation.

2. Is the descending triangle pattern bullish or bearish?

The descending triangle pattern is generally considered bearish. It suggests that sellers are gaining control, and a breakout below the support level signals the potential for further downward movement in the market.

3. How is a descending triangle different from an ascending triangle?

A descending triangle is a bearish pattern where the upper trendline slopes downward, and the lower trendline is horizontal. In contrast, an ascending triangle is typically bullish, with the lower trendline sloping upwards, indicating increasing buying pressure.

4. Can a descending triangle pattern be bullish?

While the descending triangle is typically a bearish pattern, it can sometimes lead to bullish outcomes in rare cases. If the price breaks above the descending trendline rather than below the support, it may indicate a bullish reversal, though this is less common.

5. What is the psychology behind the descending triangle pattern?

The descending triangle reflects growing selling pressure, as lower highs indicate that sellers are willing to accept decreasing prices. The support level shows buyers’ attempts to hold up the price, but a breakout below this level often signals that sellers have gained control.

Disclaimer: This article is intended for educational purposes only. Please note that the data related to the mentioned companies may change over time. The referenced securities are provided as examples and should not be considered recommendations.

Ayush Maurya

Written by Ayush Maurya

Ayush is a seasoned financial markets expert with over 3years of experience. He has a passion for breaking down complex financial concepts into simple, digestible terms. Through his 50+ articles, Ayush has helped countless individuals navigate the often intimidating world of finance.

open-account-ad-2

Social Share

Subscribe to Our Newsletter

Loading
CIN No U74110MH2005PLC157942     |    Member Ship Details     |    BSE-3281     |    NSE-12817     |    MCX-55910     |    DP:IN-DP-CDSL-490-2008     |    DPID:12059100    |    SEBI Regn. No.: INZ000170330     |    Mutual Fund: ARN-77739    |    Research Analyst: registration number INH000014395
logo-lakshmshree-white
Lakshmishree Investment & Securities Ltd. was incorporated in 2005. We are a Corporate Member of NSE, BSE, MCX and Depository Participant with CDSL.
Most Popular in LISL
Copyright @ 2024 © Lakshmishree Investment & Securities Ltd. All Right Reserved.
A Guide to Infrastructure Mutual Funds 5 Reasons to Add Silver ETFs to Your Portfolio NTPC Green Energy IPO: Everything You Need to Know Beginner's Guide to Silver ETF 10 Key Things to Know About Zinka Logistics (BlackBuck) IPO 10 Things to Know About Swiggy’s IPO Maruti Suzuki Q2 FY2025 Results: A Challenging Quarter Maharatna Companies: Driving India’s Growth!