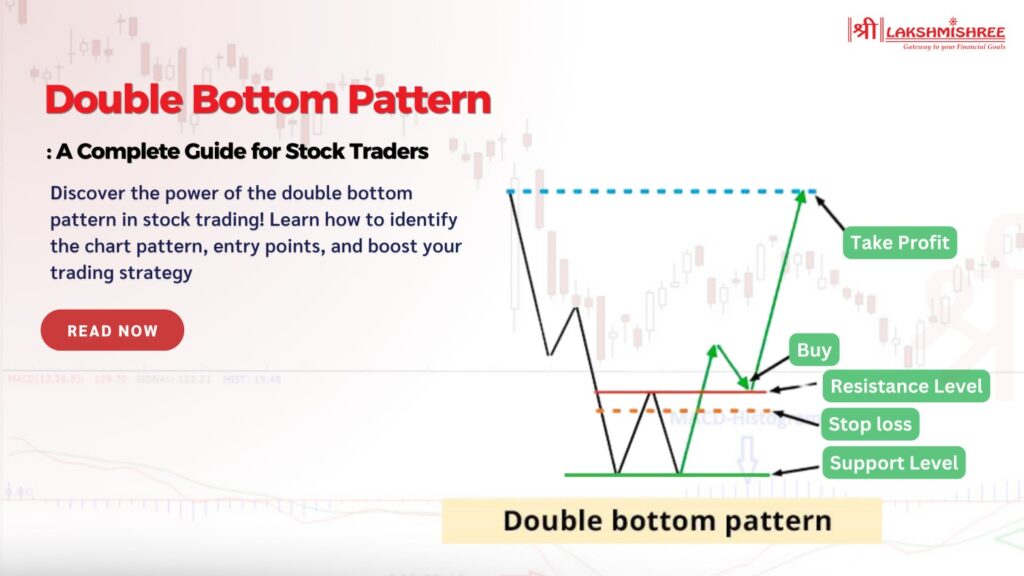
Ever feel frustrated trying to guess when a falling stock will finally turn around? The stock market is full of ups and downs, and while prices often recover, the real challenge is knowing when a reversal is likely to happen. This is where the double bottom pattern can be a game-changer for traders. It’s a powerful chart pattern that helps you spot potential turning points in the market, giving you an edge in identifying when a downtrend might shift to an uptrend.
In this guide, we’ll break down everything you need to know about the double bottom chart pattern—how to recognise it, why it’s important, and how to use it effectively in the Indian stock market.
The double bottom pattern is a popular chart pattern that signals a potential trend reversal from bearish (downward) to bullish (upward) in the stock market. It’s part of price action analysis, where traders study price movements directly on the chart without relying on extra technical indicators. This pattern forms when a stock price hits a low, rebounds slightly, and then drops to the same low level again, creating a "W" shape on the chart. This repeated low point suggests that selling pressure is easing, and buyers are stepping in, preparing for a possible price rise.
The double-bottom pattern typically unfolds in three stages:
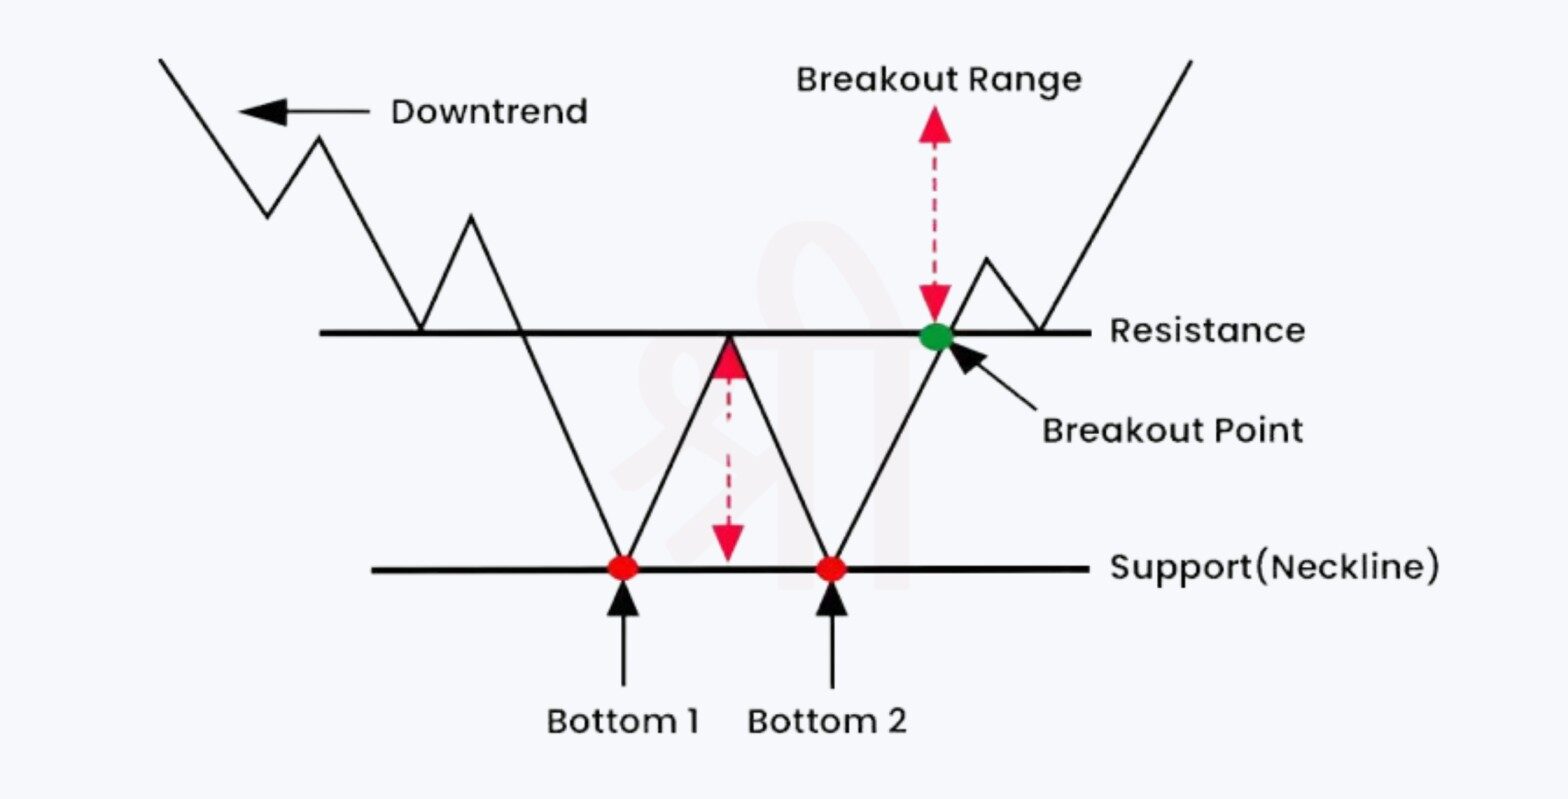
The double bottom pattern provides traders with an early hint that a downtrend might be losing momentum and a reversal could be on the way. Typically, this pattern appears after a significant price decline, and the formation of two similar lows signals that selling pressure is slowing down. This shift suggests buyers are starting to enter, potentially paving the way for an upward trend. This pattern is a reliable sign for traders, as it may indicate that the asset is reaching strong support.
One key element of this pattern is the distance between the two lows. The larger the time and price movement gap, the more reliable the pattern becomes. Additionally, many traders monitor trading volume when analysing the double bottom.
A noticeable increase in volume around the second low or during the breakout above the neckline strengthens the pattern’s validity. This increase in volume reflects higher buying interest, which boosts the chances of a successful trend reversal.
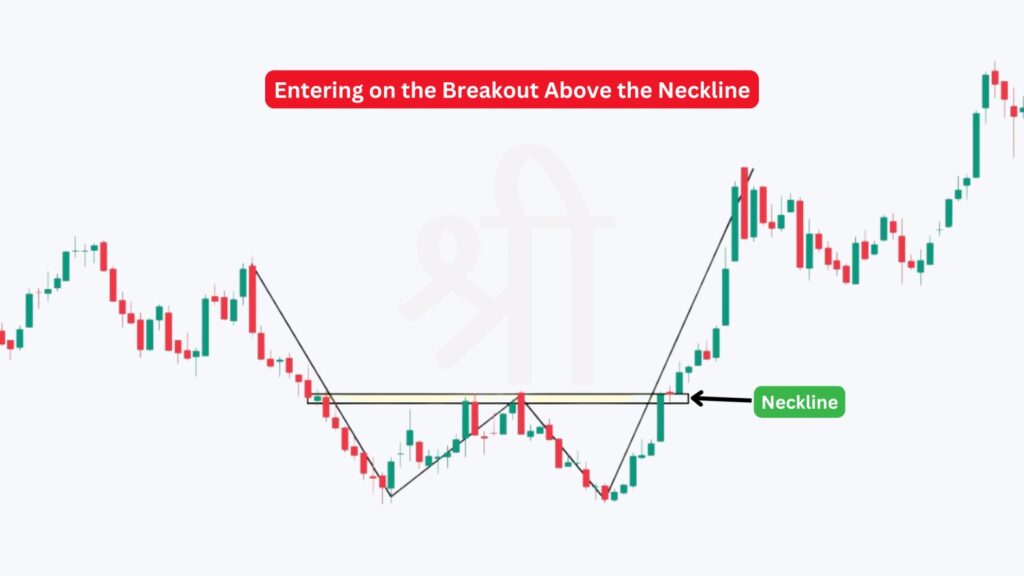
When trading the double bottom pattern, there are two main strategies to consider. These approaches are centred around the “neckline” (resistance level) of the pattern, and each offers a different way to enter the trade depending on your risk tolerance and trading style. Let’s explore both methods:
This strategy involves entering the trade as soon as the price breaks above the neckline (resistance level) of the double bottom pattern. Since the breakout confirms the completion of the pattern, this is a quicker, more aggressive approach to enter the market.
With this strategy, you wait for the price to break above the neckline and then pull back to test the neckline as new support. This approach gives additional confirmation, as the price bounces off the neckline before moving up again.
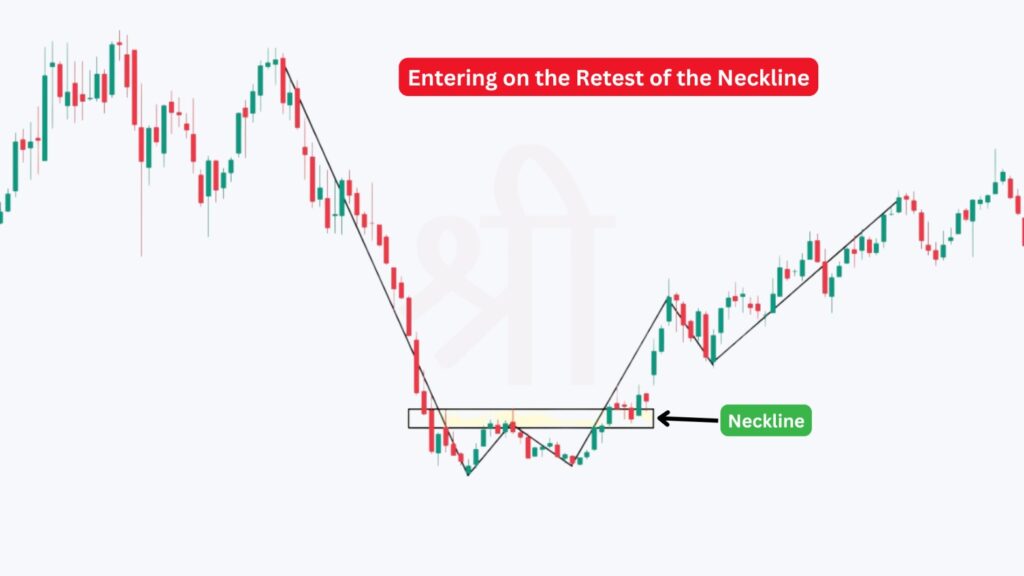
Key Tips for Trading the Double Bottom Pattern
The double bottom pattern is significant because it signals a potential reversal from a downtrend to an uptrend, offering traders an ideal entry point. When a stock forms this pattern, it indicates that the price has a strong support level, meaning buyers are stepping in to prevent it from dropping further. This pattern often marks the end of a bearish phase and the start of a new bullish trend, making it valuable for traders looking to capitalise on market reversals.
For traders, the double bottom pattern indicates changing market sentiment. It suggests that demand is beginning to outpace supply after a period of decline, which could push prices higher. Recognising this pattern in time allows investors to enter near the market low, positioning themselves for potential gains as the trend shifts upward.
The double bottom and double top patterns are important reversal signals but point in opposite directions. While the double bottom pattern indicates a bullish reversal (from downtrend to uptrend), the double top pattern signals a bearish reversal (uptrend to downtrend). Here’s a quick comparison between the two:
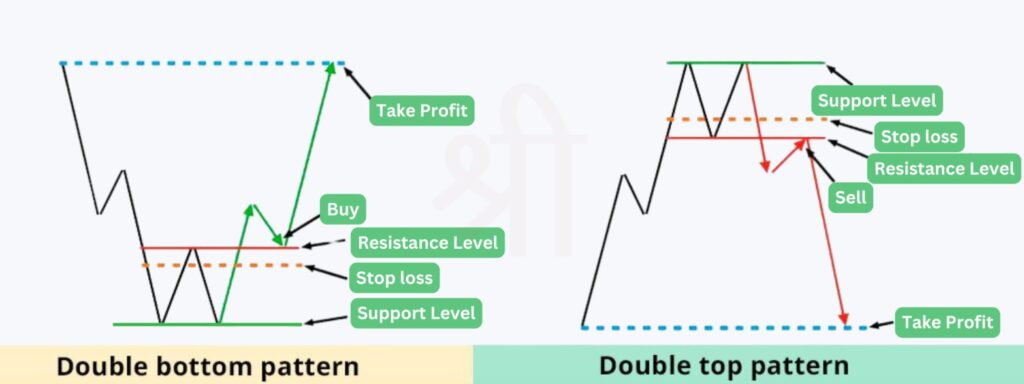
| Feature | Double Bottom Pattern | Double Top Pattern |
|---|---|---|
| Trend Direction | Bullish reversal (downtrend to uptrend) | Bearish reversal (uptrend to downtrend) |
| Appearance on Chart | Forms a "W" shape | Forms an "M" shape |
| Signal | Indicates strong support level | Indicates strong resistance level |
| Trading Strategy | Enter after breakout above neckline | Enter after breakdown below neckline |
| Ideal for | Buying opportunities | Selling or shorting opportunities |
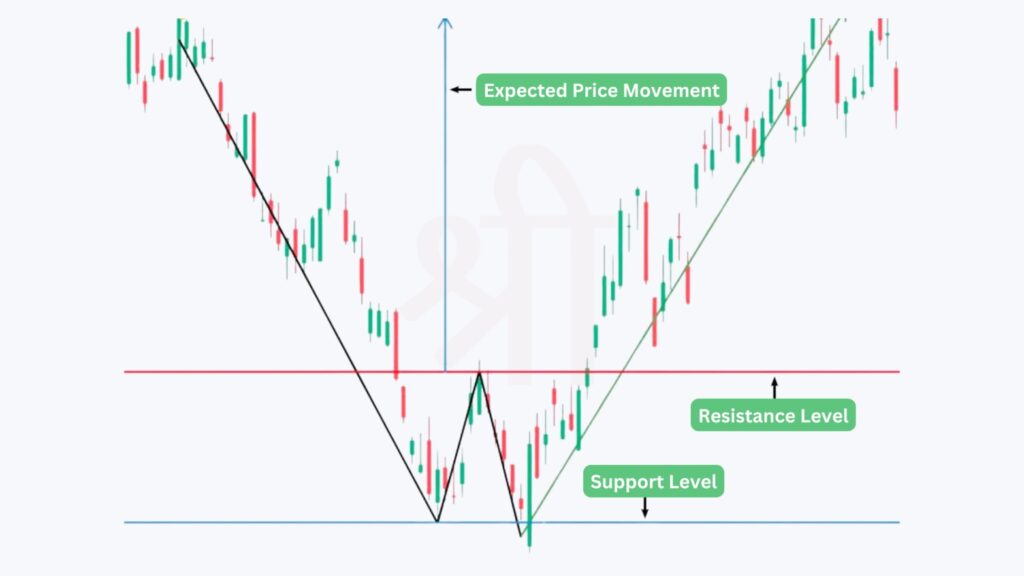
The double bottom candlestick pattern is simply the double-bottom pattern viewed on a candlestick chart. It forms a "W" shape, where each bottom is represented by a series of candlesticks hitting similar low points, separated by a temporary peak (neckline). Candlestick signals, like a bullish engulfing or a hammer, often appear around the second bottom, indicating strong buying interest. These candlestick patterns add an extra layer of confirmation, helping traders confidently identify a potential reversal.
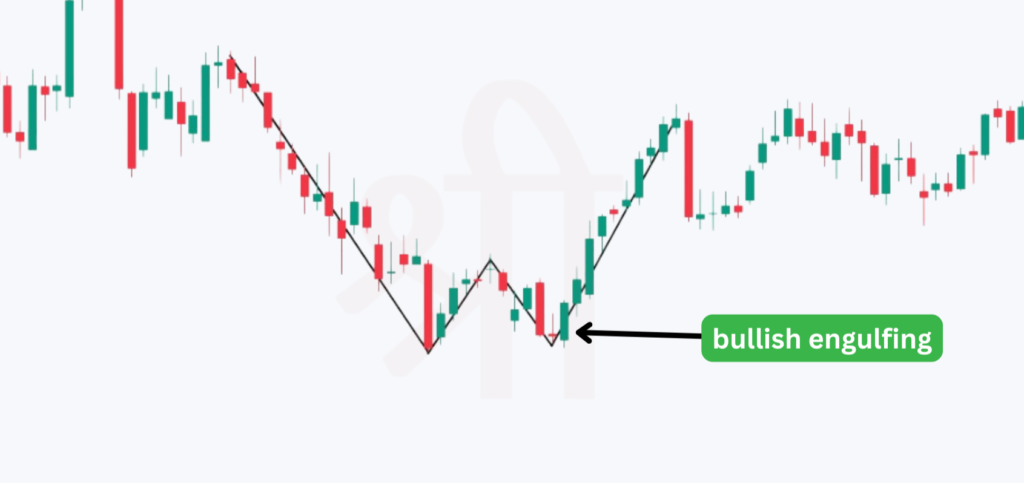
The double bottom pattern is considered a bullish reversal pattern because it signals a downtrend's end and a potential uptrend's start. After forming two consecutive lows at a similar price level, selling pressure diminishes and buyers are stepping in, creating a strong support level. Once the price breaks above the neckline (resistance level), it confirms the shift in market sentiment from bearish to bullish, suggesting that the stock is poised for an upward move. This pattern gives traders confidence that the price may continue rising.
To confirm a double-bottom pattern, traders look for a breakout above the neckline or resistance level. This breakout is essential as it shows that buying pressure has overcome the previous selling resistance, marking a true reversal. Volume plays a crucial role here; a strong breakout with high volume adds credibility to the pattern, indicating that the price has momentum to sustain an uptrend. Without this confirmation, the pattern may not be reliable, as false breakouts can lead to losses.
The double-bottom formation pattern signals a potential bullish reversal, allowing traders to enter near a market low. This pattern is powerful for identifying shifts in market sentiment, particularly after a sustained downtrend. However, confirming the breakout with volume and monitoring other indicators is essential to ensure reliability. When used correctly, the double bottom can be an effective tool for timing entries in the stock market.
The double-bottom formation pattern signals a potential bullish reversal in the market. It indicates that the price has hit a strong support level twice and may soon begin an uptrend. This pattern is often seen as a sign that selling pressure is weakening.
To confirm the pattern, wait for a breakout above the neckline with a noticeable increase in trading volume. The volume spike strengthens the reversal signal, showing buyer interest. Without this confirmation, the pattern could be unreliable.
Yes, the double bottom formation pattern signals a potential reversal in various markets, including stocks, Forex, and commodities. However, it’s more effective in stable, less volatile markets. High volatility can distort the pattern and reduce its accuracy.
The double bottom formation is generally more reliable on longer timeframes, such as daily or weekly charts. Longer timeframes reduce noise and increase the chances of a successful reversal. Shorter timeframes may show false signals due to market fluctuations.
The double bottom formation pattern can fail due to false breakouts, where the price briefly breaks above the neckline but doesn’t sustain. Lack of volume confirmation also weakens the pattern, as it shows insufficient buyer interest to drive the price up.
The double bottom pattern looks like a "W" because it consists of two consecutive lows separated by a small peak. This shape indicates two failed attempts by sellers to push the price lower, suggesting that buyers are gaining strength.
Disclaimer: This article is intended for educational purposes only. Please note that the data related to the mentioned companies may change over time. The securities referenced are provided as examples and should not be considered as recommendations.