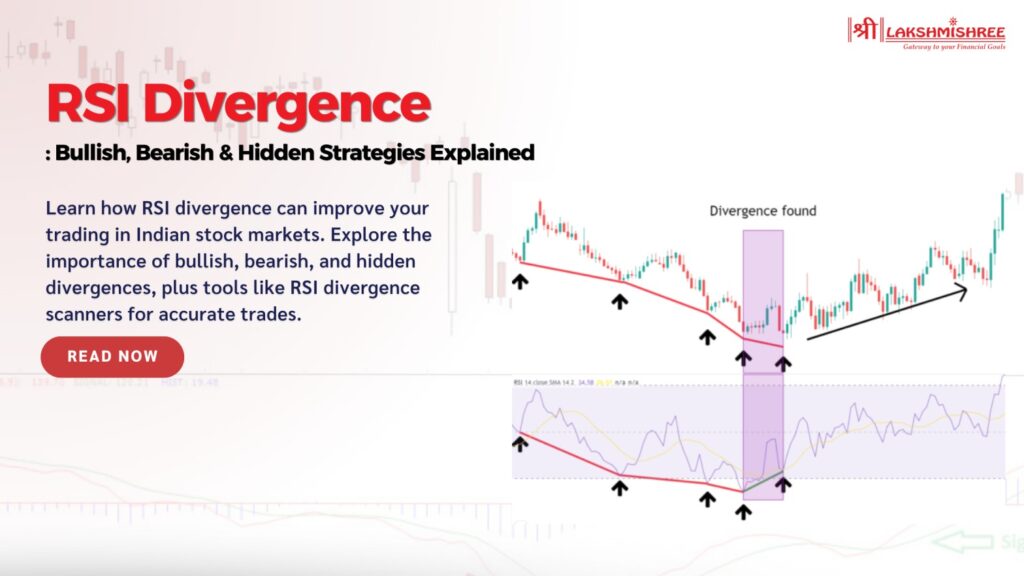
As a trader in the Indian stock market, you’ve probably faced moments when prices move unpredictably. Even with all the charts and indicators, timing a trade perfectly can feel like a shot in the dark. That’s where RSI divergence steps in—a powerful tool that can help you spot potential market reversals before they happen.
By understanding RSI divergence, you’ll gain deeper insights into price trends and enhance your ability to make smarter, more profitable decisions. This blog will explain RSI divergence and how to use it to stay ahead of the market's twists and turns. Ready to unlock this game-changing strategy? Let’s dive in!
RSI Divergence is among technical analyses allowing traders to discover a possible market reversal by comparing price movements with the Relative Strength Index. The RSI tool measures how fast and strong price movements are, ranging between 0 and 100. Typically, when the RSI is below 30, the asset is considered oversold; when it's above 70, it's seen as overbought.
RSI divergence happens when the price and the RSI move in opposite directions. This signals that the current trend may be losing momentum and could reverse soon. For example, if the price keeps rising but the RSI starts falling, it could mean the uptrend is weakening. The same applies in reverse—if the price is falling but the RSI starts rising, it could mean the downtrend is losing steam.
There are three main types of RSI divergence: bullish, bearish, and hidden. Each type gives traders different insights into what might happen next in the market. Traders use this divergence to get early warnings of trend changes, giving them the opportunity to adjust their trading strategies before the market makes its next big move.
Traders use three main types of RSI divergence to analyze potential market changes: bullish, bearish, and hidden divergence. Each type provides a unique clue about whether the current trend is weakening and might reverse or continue.
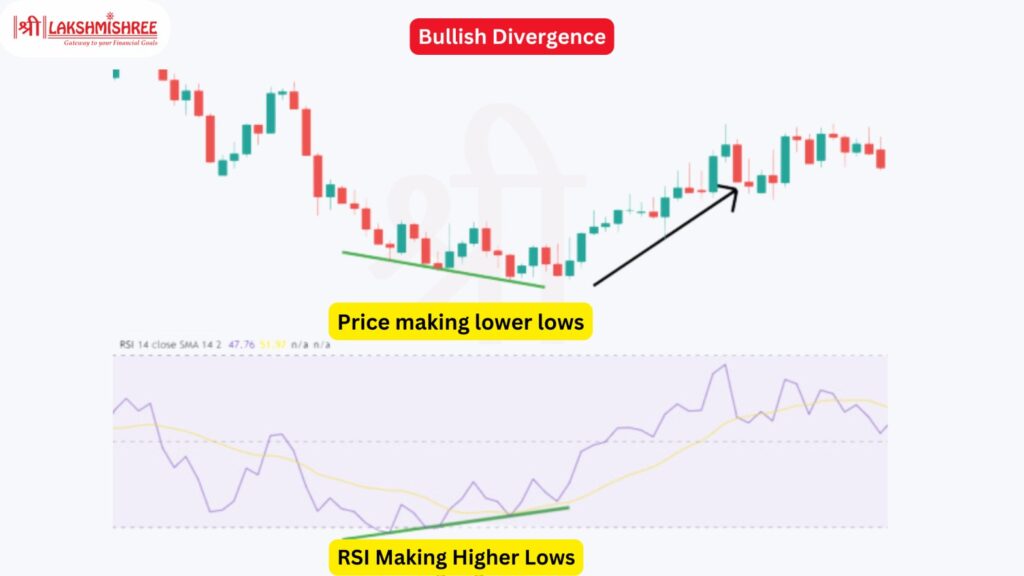
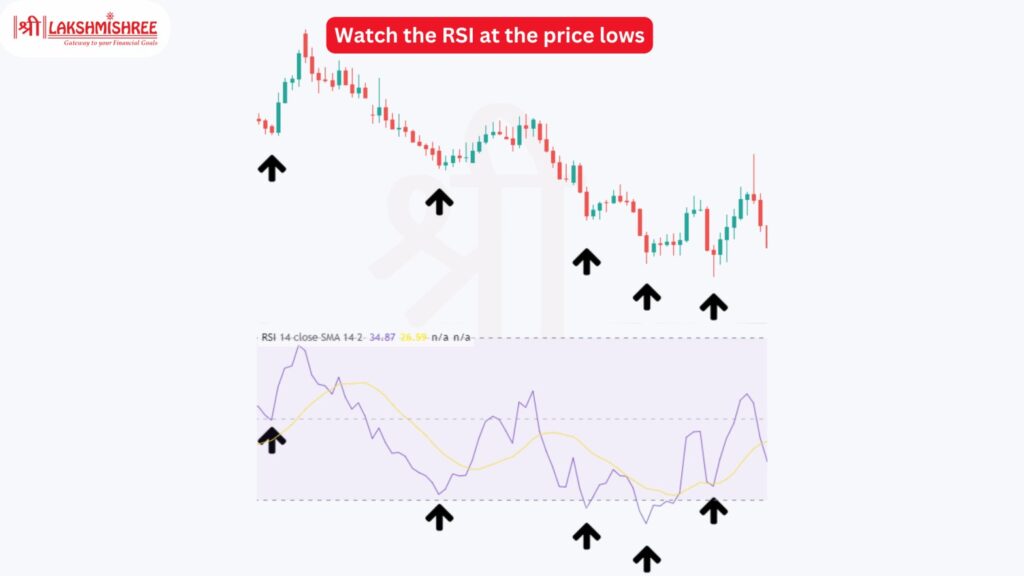
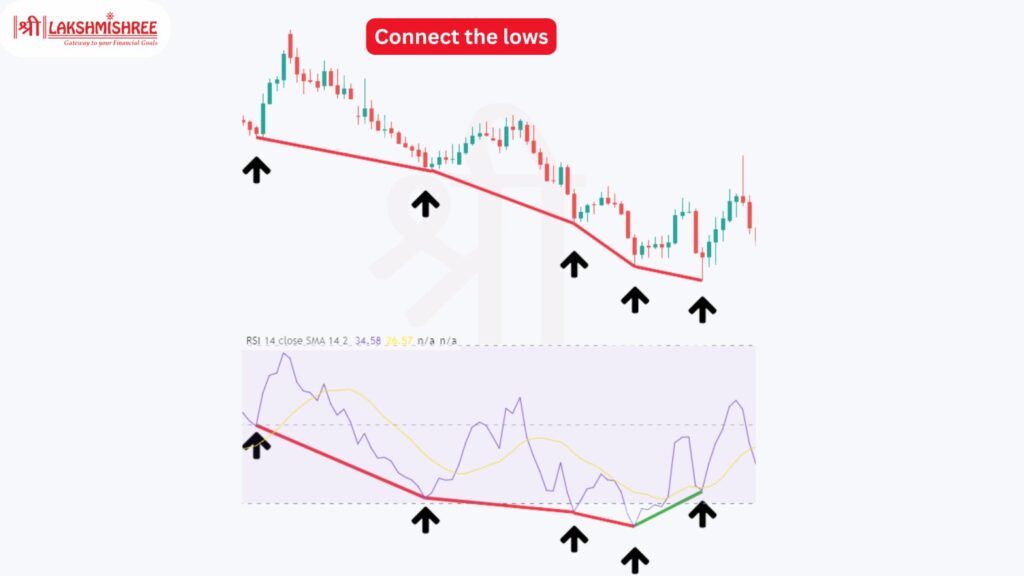
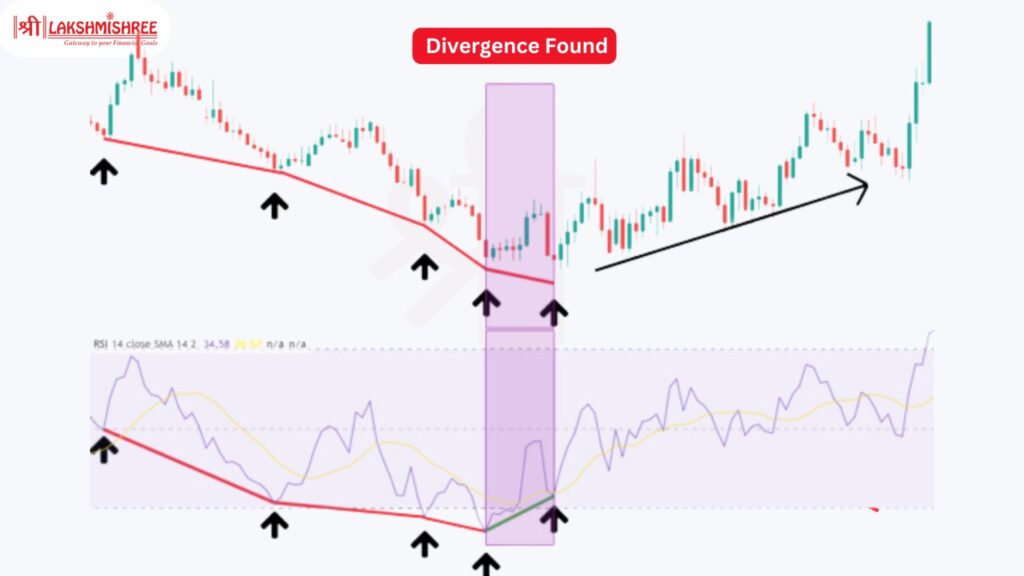
A bullish divergence occurs when the price of an asset is making lower lows, but the RSI is making higher lows. This usually happens when the RSI is below 30, indicating the asset is oversold. Despite the price continuing to fall, the RSI is suggesting that the selling pressure is weakening, and the price may soon rise. This type of divergence is often seen as a signal that a bullish reversal might occur.
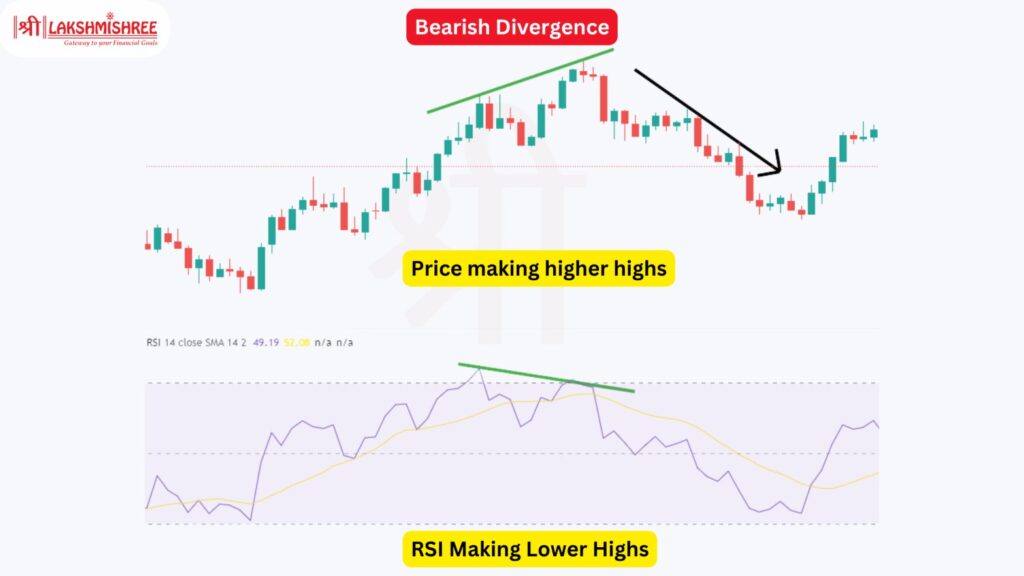
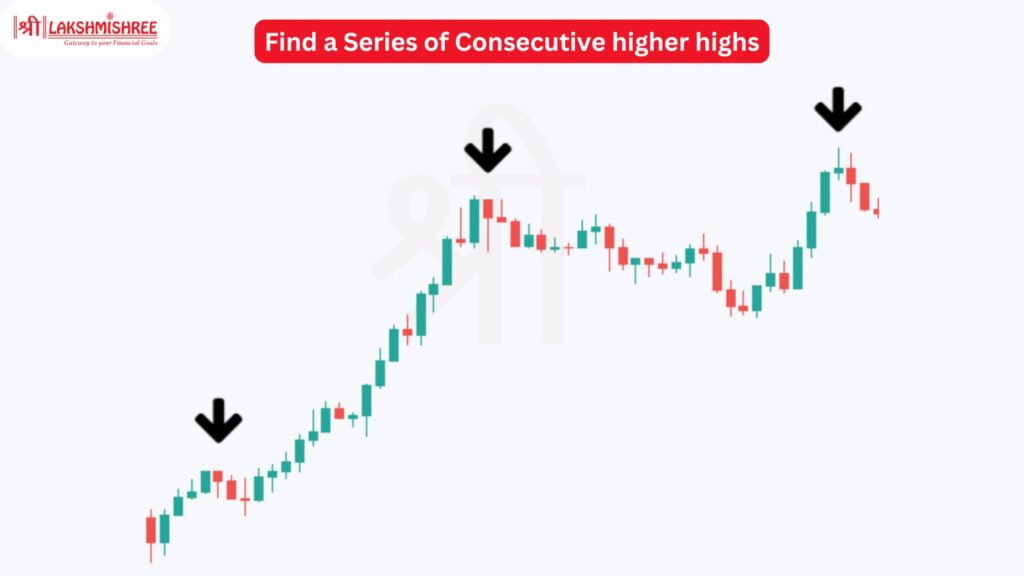
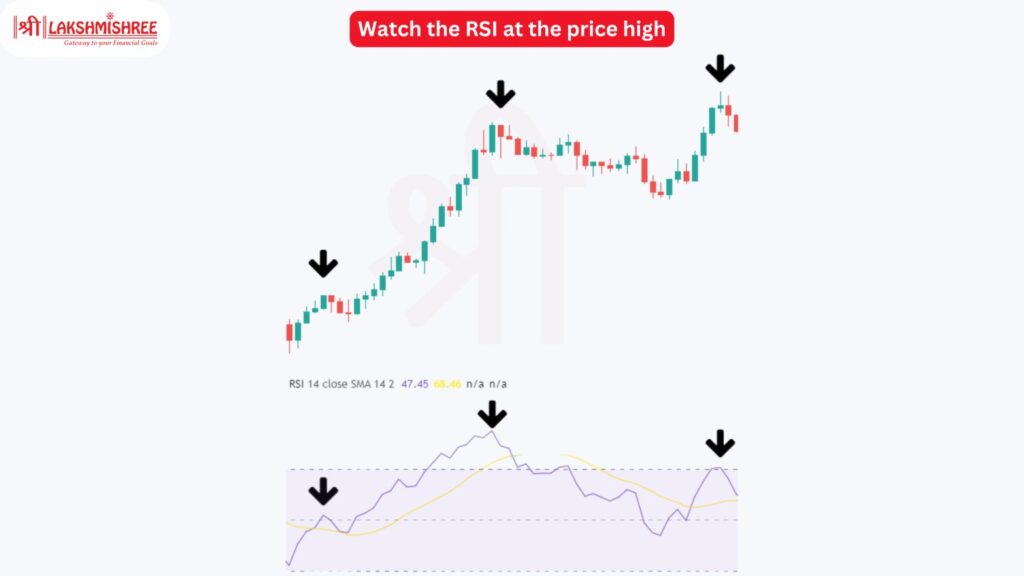
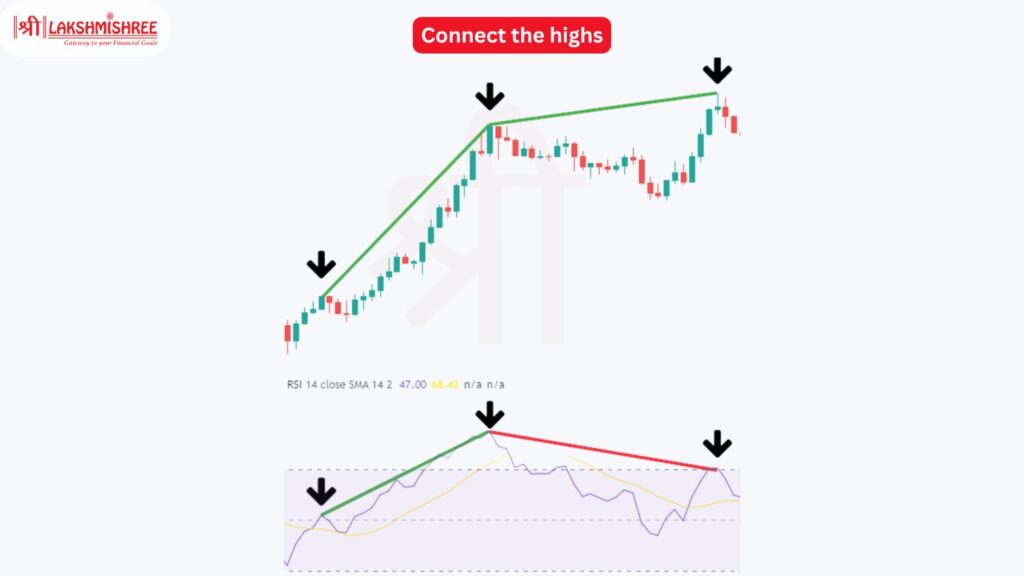
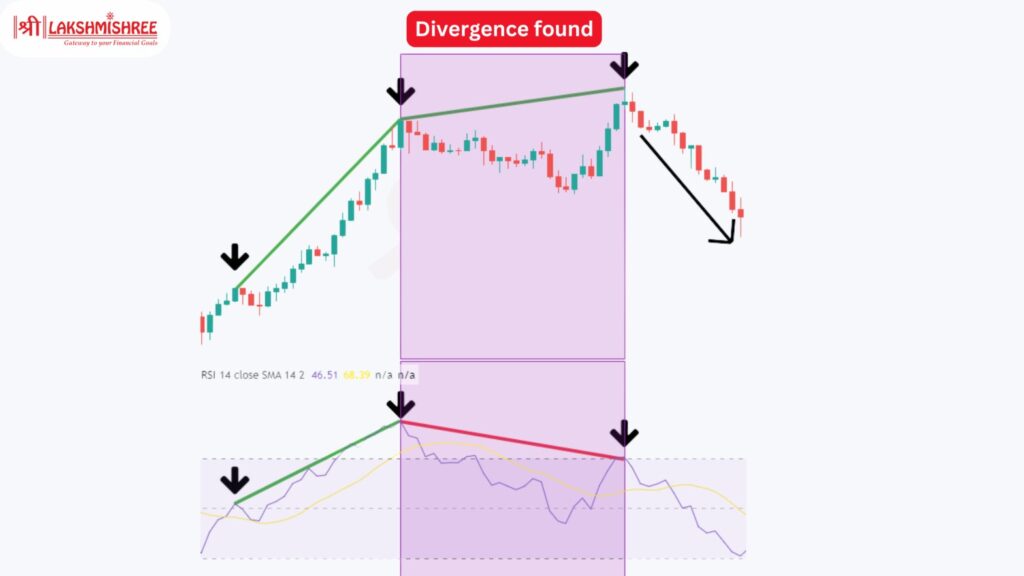
In a bearish divergence, the price is higher, but the RSI is making lower highs, often around 70 or above, signalling that the asset is overbought. While the price keeps climbing, the RSI shows that the buying pressure is fading. This is usually a sign that the uptrend is losing strength, and a downward reversal might be coming.
Hidden divergence differs from regular divergence because it suggests the trend will continue rather than reverse. In a hidden bullish divergence, the price makes a higher low, but the RSI makes a lower low, usually indicating that the market is still strong despite the pullback. Similarly, in a hidden bearish divergence, the price forms a lower high, but the RSI makes a higher high, suggesting the downward trend is likely to continue.
Hidden divergences are often seen as signals that the current trend will hold, and they usually appear when the RSI is around 30 for bullish hidden divergences or 70 for bearish hidden divergences.
RSI divergence is like a hidden clue in the stock market, signalling potential shifts before they happen. It tells us that while the price might still be moving in one direction, the strength behind that movement is weakening. When you spot a divergence, it’s a sign that the current trend may not hold for much longer.
For example, if a bearish divergence shows up—where the price is rising, but the RSI is falling—it’s an early warning that the uptrend might lose momentum and reverse. On the flip side, if you notice a bullish divergence—where the price keeps dropping, but the RSI is rising—it suggests that the selling pressure is fading, and the market might be gearing up for a reversal to the upside.
In both cases, divergence helps you stay ahead of potential trend changes. It’s not about following the crowd but reading the signs of weakening strength in the market before the price moves.
To make the most of RSI divergence in your trading, follow these simple steps:
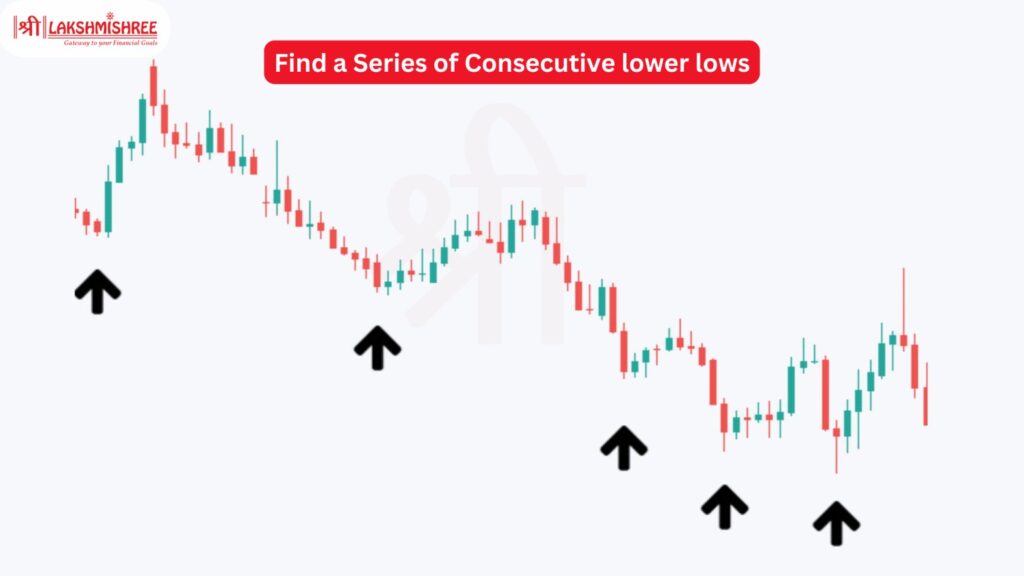
A bullish RSI divergence is a strong signal that the market might reverse from a downtrend to an uptrend. Here's how to spot it step by step:
A bearish RSI divergence indicates that an uptrend might be losing steam, and a reversal to the downside could happen soon. Here’s how you can identify it:
To identify RSI divergence efficiently, traders can use various online tools and platforms. Some of the most popular options include:
These tools help simplify the process of spotting divergences so you can act on potential opportunities faster and more accurately.
For more experienced traders, there are advanced methods to trade divergences. These strategies help you refine your entries and exits, improving your trading success.
Method #1 – The Pullback After the Divergence
In this strategy, you wait for a pullback after identifying a divergence before making a trade. Here’s how it works:
This method works best in markets with clear trends, as the pullback offers a great entry point at lower risk.
Method #2 – The Pullback After the Moving Average Break
This method combines RSI divergence with moving averages to confirm your trades, especially after long trends:
This method is especially useful in markets that have been trending for a long time, as the moving average break often signals the exhaustion of the trend.
To confirm RSI divergence, it’s crucial to use additional technical tools and indicators to avoid false signals and increase accuracy. Here are some effective methods:
By combining these tools with RSI divergence, you can make more informed trading decisions and reduce the chances of false signals
The standard RSI settings typically use a 14-period, which can be adjusted based on your trading style or the asset you are analyzing. Here’s how different settings impact the RSI:
To optimize RSI settings for divergence, consider the asset’s volatility. High volatility assets might need shorter settings, while stable markets could benefit from longer ones.
Mastering RSI divergence can significantly improve your trading decisions, especially when combined with other technical indicators. By understanding the different types—bullish, bearish, and hidden divergence—you better understand when trends are likely to reverse or continue. Whether you're trading in Indian or global markets, spotting these divergences early allows you to time your entries and exits more effectively. Remember to confirm your signals with tools like moving averages, trendlines, and candlestick patterns for better accuracy.
RSI divergence occurs when the price of an asset moves in the opposite direction to the RSI indicator. Depending on the type of divergence spotted, this can signal a potential reversal in the market trend, either bullish or bearish.
To spot RSI divergence, compare the price action with the RSI indicator. If the price makes higher highs, but the RSI makes lower highs, that’s a bearish divergence. If the price makes lower lows and the RSI makes higher lows, that’s a bullish divergence.
Yes, RSI divergence is a reliable early indicator of potential trend reversals. However, it’s best used in combination with other tools like moving averages or trendlines to confirm the signal and reduce the chances of false alerts.
The default RSI setting is a 14-period, which works well for most traders. However, shorter settings (like 7) increase signal sensitivity, while longer settings (like 21) reduce noise and offer more reliable signals, especially for long-term trading.
Yes, day traders can use RSI divergence, but they should pair it with other tools like volume indicators or moving averages to avoid false signals. Shorter RSI settings can also help identify quicker market movements suitable for intraday trading.
RSI divergence is fairly reliable, especially when used alongside other technical indicators for confirmation. However, like all technical tools, it’s not foolproof and should be used as part of a broader strategy that includes risk management.
Hidden RSI divergence occurs when the price makes a higher low in an uptrend (or a lower high in a downtrend), but the RSI moves in the opposite direction. It signals that the trend is likely to continue rather than reverse.
Disclaimer: This article is intended for educational purposes only. Please note that the data related to the mentioned companies may change over time. The securities referenced are provided as examples and should not be considered as recommendations.
