Posted on July 15, 2024 under Commodities by Divyansh Shah
Cup and Handle Pattern: How to Use in Trade with Example
Most of the time, traders make a lot of use of the cup and handle pattern to spot a potential bullish trend; therefore, it becomes an invaluable tool for capitalizing on upward price movements. Knowledge about spotting and using this particular pattern can seriously enhance your strategy. The cup and handle are a commonly used pattern in technical analysis charts to predict future market stock prices. Named for its shape, this pattern looks a lot like a cup of tea with a rounded bottom and a small dip or "handle" on the right side.
This article will further dig into the details of the cup and handle chart pattern: formation, identification, and, most importantly, ways to use it effectively in trading.
Table of Content
What is Cup and Handle Pattern?
The cup and handle pattern is a widely recognised chart formation in technical analysis, utilised by traders to anticipate the continuation of an upward price trend. This pattern gets its name from its distinctive shape, which resembles a tea cup. It consists of two main parts: the "cup" and the "handle."
- The Cup
The price will have an initial decline followed by a slow recovery, forming a rounded bottom like a teacup. The cup can be deeper or shallower, though a shallower cup often indicates a stronger pattern. The time to form the cup can range from a few weeks to several months, depending on the chart's time frame.
The rounding bottom of the cup is significant, showing a consolidation period where market sentiment shifts from bearish to bullish. A smooth, rounded shape is preferable over a V-shaped one as it represents a more gradual and stable change in market sentiment.
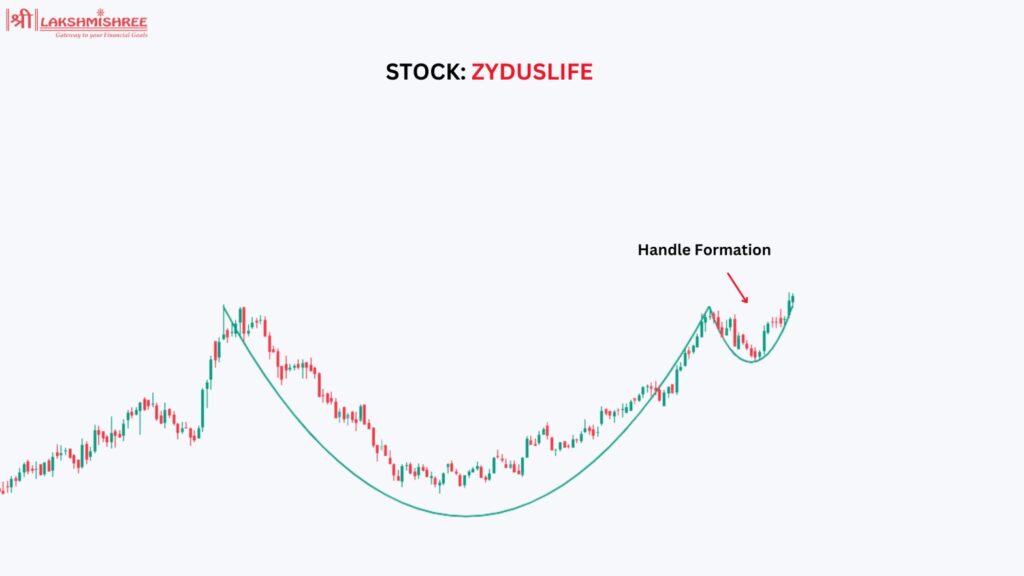
- The Handle
Once the cup formation is complete, the handle begins to form. Typically, the handle develops as a small consolidation or slight downward drift in price, often in the shape of a flag or pennant, sloping slightly downward. This brief consolidation allows the price to digest recent gains and shake out weak hands before the next upward move.
The pattern is complete when the price breaks out above the resistance level created by the handle. This breakout is usually accompanied by a surge in trading volume, signalling strong bullish momentum.
What Does the Cup and Handle Pattern Do?
The cup and handle pattern is a bullish continuation pattern. When properly detected, it signals that the price is highly likely to continue an upward movement after the formation of the handle. This is how traders use this pattern to take long positions to profit from the predicted price increase. The pattern's reliability makes it a favourite tool among traders looking to capitalize on sustained market trends.
How to Identify the Cup and Handle Pattern
Identifying the cup and handle pattern is crucial for traders and investors looking to leverage this bullish continuation pattern. Here’s a step-by-step guide to help you recognise this formation in stock charts:
Step 1: Spot the Initial Decline
Look for a Downward Trend: The pattern starts with a fall in prices. This decline usually lasts for some weeks to several months, forming the left-hand side of the cup. The decline may result from market corrections or profit-taking.
Step 2: Observe the Rounded Bottom
Rounded Shape: The price then flattens and forms a rounded bottom. This marks the consolidation period as the selling pressure relents while the buying interest gradually increases.
Time Frame: Depending on the time frame, it could take several weeks to several months for the base of the cup to be completed. A well-formed, smooth, and rounded bottom indicates a stronger pattern.
Step 3: Watch for the Right Side of the Cup
Gradual Recovery: On the right-hand side of the formation, prices will begin to rise as the market sentiment shifts from bearish to bullish. This rise should be gradual, reflecting a healthy accumulation phase.
Resistance Level: The peak of the left side of the cup may act as a resistance level. The price may hit this level and pull back slightly to form the handle.
Step 4: Identify the Handle Formation
Handle Characteristics: The handle usually has a small consolidation or slight downward drift in price. It resembles a flag or a pennant and slopes slightly downward.
Volume Pattern: During the handle formation, trading volume generally decreases, indicating lower activity and less volatility. The pattern is confirmed when a surge in volume accompanies the price breakout from the handle.
Step 5: Confirm the Breakout
Breakout Above Resistance: The pattern is considered complete when the price breaks out above the resistance level created by the handle. This breakout is usually accompanied by a surge in trading volume, indicating strong bullish momentum.
Entry Point: Traders typically enter long positions at the breakout point, aiming to capitalise on the anticipated upward price movement.
Key Indicators to Use
Support and Resistance Levels: Identify the key support and resistance levels to confirm the pattern's boundaries.
Volume Trends: Monitor the trading volume. A decrease in volume during the handle formation and a subsequent increase during the breakout are strong confirmation signals.
Time Frame Analysis: Analyze the pattern across different time frames to ensure its validity. The cup and handle pattern can appear on daily, weekly, or even monthly charts.
Example of How to Trade with Cup and Handle Pattern
Understanding the cup and handle pattern is essential, but seeing it in action provides practical insights into how to trade it effectively. Here, we will walk through a realistic example to demonstrate how to apply this pattern in your trading strategy.
Example: Trading a Cup and Handle Pattern in ZYDUSLIFE
Let's say you're analysing the stock chart of ZYDUSLIFE and identify a potential cup and handle pattern forming over several months.
Step 1: Identifying the Pattern
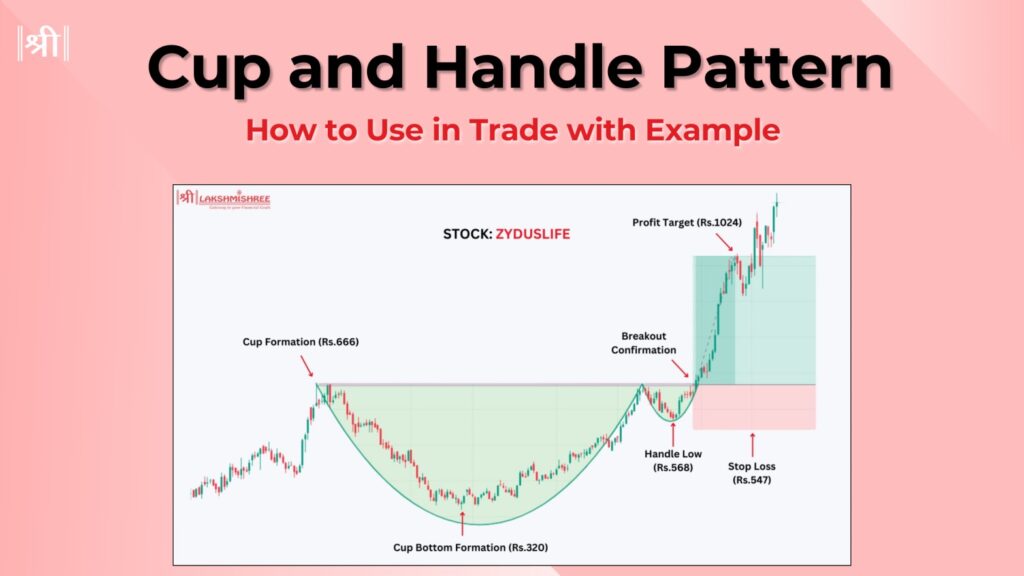
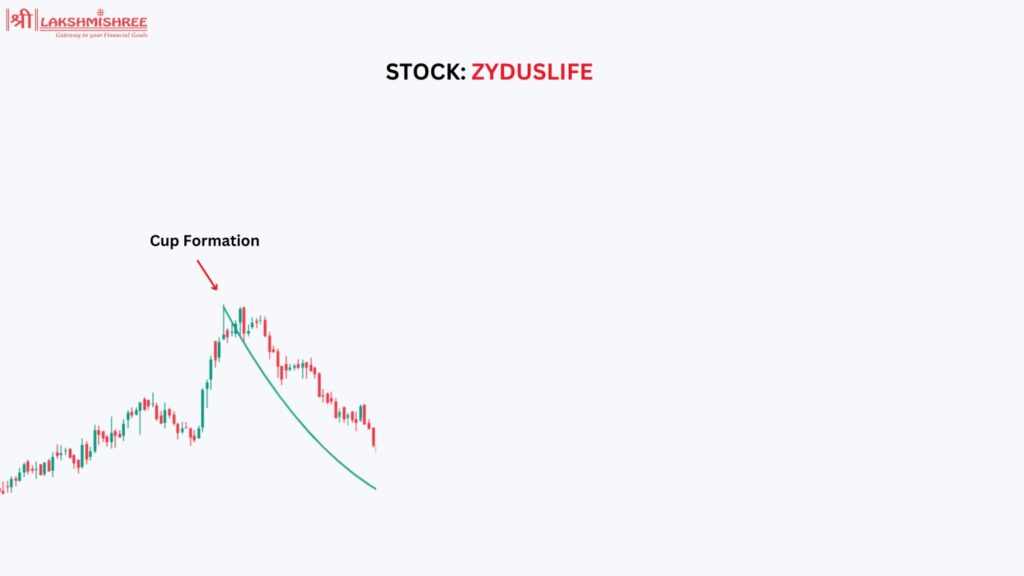
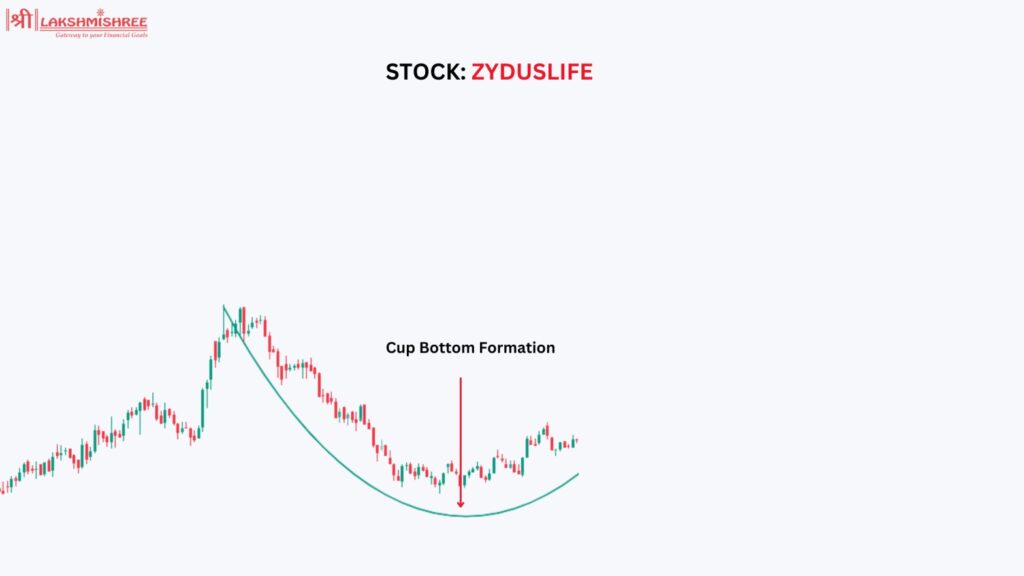
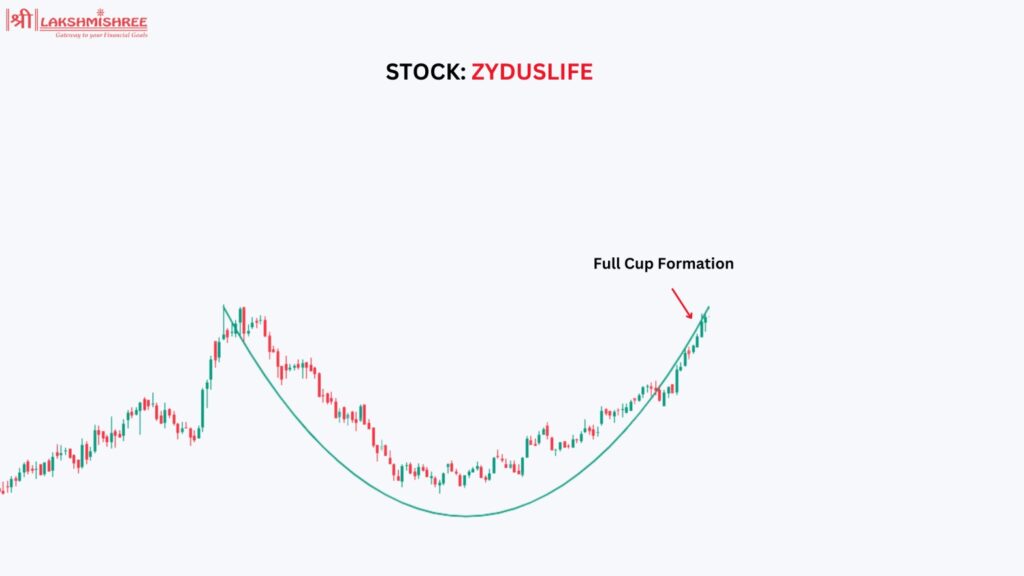
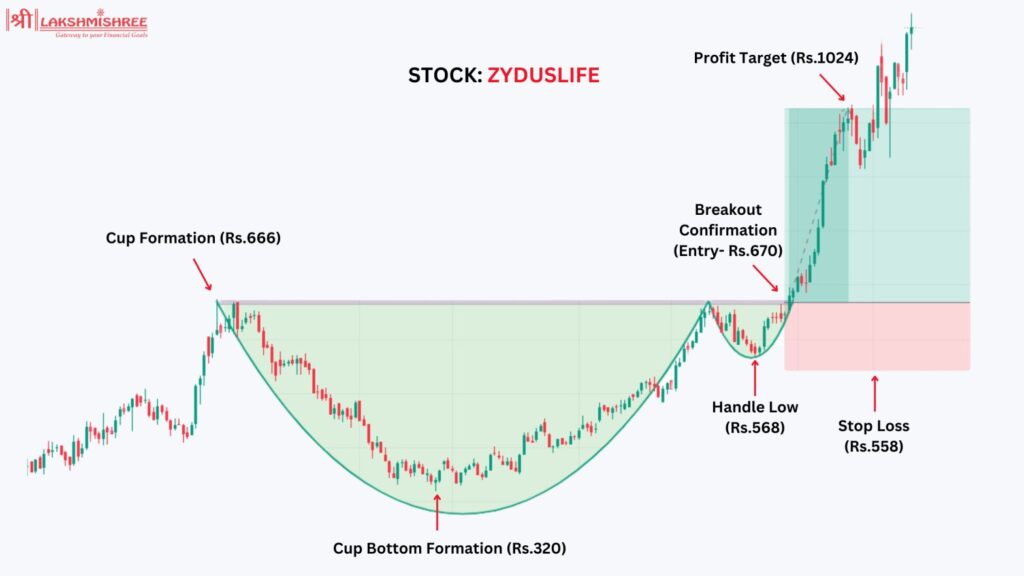
Cup Formation: The stock price of ZYDUSLIFE fell from ₹666 to ₹320, creating the left side of the cup. Over the next few months, the price gradually recovered to ₹666, forming the right side of the cup. The rounded bottom indicates a solid cup formation.
Handle Formation: After reaching ₹666, the price consolidates between ₹666 and ₹570 for a few weeks, forming a slight downward handle. This consolidation period indicates that the market is digesting recent gains and preparing for the next move.
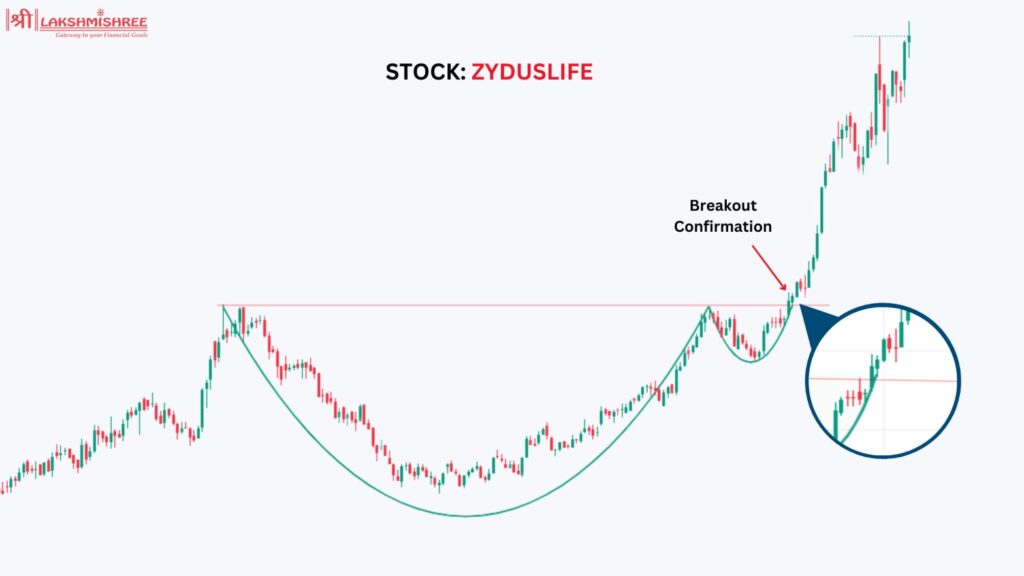
Step 2: Setting Your Entry Point
Breakout Confirmation: The breakout point is when the price moves above ₹666 with increased volume. This breakout above the resistance level formed by the handle is your signal to enter a long position.
Step 3: Placing Your Stop-Loss Order
Stop-Loss Placement: Place a stop-loss order slightly below the handle's lowest point to minimise risk. If the handle's low is ₹568, you might set your stop-loss at ₹547. This protects your capital in case the breakout fails.
Step 4: Setting Your Profit Targets
Measuring the Cup's Depth: The depth of the cup is ₹346 (from ₹666 to ₹320). Add this distance to the breakout point (₹666) to set an initial profit target of ₹1024. In this case, we are taking the Risk/reward Ratio as 1:3
Step 5: Monitoring the Trade
Tracking the Price Movement: After entering ₹666, monitor the price movement. If the price moves as expected and breaks above ₹666, track its progress towards your profit target.
Volume Analysis: Ensure that the breakout is supported by high volume. Continued high volume during the uptrend confirms the bullish momentum.
Step 6: Adjusting Your Strategy
Taking Profits: As the price approaches your profit target (₹1012), consider taking partial profits to lock in gains. Adjust your stop-loss to a higher level, perhaps just below recent support levels, to protect your remaining position.
Reassessing the Position: If the price continues to show strength and reaches ₹1012, reassess the market conditions and the stock's performance.
By following these steps, you can effectively trade the cup and handle pattern in ZYDUSLIFE and maximise your potential for profit while managing your risk. This example highlights the importance of careful analysis, strategic entry and exit points, and ongoing trade management.
Advantages of the Cup and Handle Pattern
Reliability as a Bullish Continuation Pattern
The cup and handle is known to be a bullish continuation pattern, indicating an upward trend in the price. When this pattern forms, it suggests the price will likely continue moving upwards, providing traders with a solid basis for their bullish strategies.
Easy to Identify
This pattern is easy to recognize. It looks like a cup with a small handle on price charts. This distinctive shape makes it accessible for any new or experienced trader to identify and make more informed trades.
High Success Rate
When other technical indicators confirm the pattern, it generally leads to successful trades. This high probability of success means that traders can feel confident using the cup and handle pattern to make profitable trades, as it often results in favourable outcomes.
Clear Entry and Exit Points
The pattern provides clear points for entering and exiting trades. Traders can enter a trade when the price breaks out from the handle and set their exit points based on the depth of the cup. This clarity helps manage risks and maximize potential rewards effectively.
Limitations of the Cup and Handle Pattern
False Signals
Sometimes, the pattern can appear falsely in the market, leading to incorrect trade decisions and potential losses. Traders must be cautious and correctly identify the pattern to avoid these false signals.
Avoid Fake Breakouts
Note: Some false breakouts occur; investors must wait for confirmation before making trade decisions to avoid losses.
Needs Other Indicators
The cup and handle pattern works best when used with other technical tools like volume analysis and moving averages. These additional indicators confirm the pattern, making the trade signal more reliable and reducing the risk of incorrect trades.
Takes Time to Form
The formation of the cup and handle pattern can take several weeks or even months. This lengthy development period requires patience, which might not align with traders' goals for quick trading opportunities.
What Happens After a Cup and Handle Pattern Forms?
Breakout Confirmation
After the handle forms, the price should break out above the resistance level of the cup. This breakout is usually accompanied by increased volume, confirming the pattern. A successful breakout indicates a strong bullish sentiment and the likelihood of a continued upward trend. Traders should enter the trade at this point to capitalize on the expected price movement.
Price Target Calculation
Calculate the target price by measuring the distance from the bottom of the cup to the breakout point at the top of the cup. Add this distance to the breakout point to set your profit target. For example, if the distance from the bottom of the cup to the breakout point is Rs10, and the breakout occurs at Rs50, the target price would be Rs60. This method helps in setting realistic profit goals based on the pattern's characteristics.
Monitor for Pullbacks
After the breakout, the price may pull back to test the breakout level, also known as the resistance turned support level. This retest is normal and can offer another entry point if the price holds above the new support level. Traders should watch for a confirmation that the support level holds, indicating that the upward trend will likely continue.
Watch for Continuation
If the breakout is strong and the volume supports it, the price will likely continue upward. Monitor the trend and adjust your stop-loss to lock in profits as the price rises. Trailing stop-loss orders can be useful to protect gains while allowing the position to benefit from further upward movement. Traders should also be aware of any signs of reversal or weakening momentum, which could indicate the end of the bullish trend.
Is a Cup and Handle Pattern Always Bullish?
The cup and handle pattern is generally seen as a sign that prices will keep rising. It usually forms during an uptrend, suggesting that the price will continue going up after a pause. To confirm this pattern, the price needs to break above the resistance level formed by the rim of the cup. When this breakout happens, especially with high trading volume, it supports the idea that the price will keep rising.
However, be careful of false signals. If the price breaks out but then falls back below the handle, the bullish signal is no longer valid, and losses may occur. Also, while this pattern usually indicates bullish conditions, it’s not always reliable in every market situation. Sometimes, it can show up during a downtrend or bearish market, and its bullish message might not hold true. Traders should always consider the overall market situation before relying on this pattern.
What does a reverse downtrend mean for Cup and Handle?
In a normal downtrend reversal, the reversal occurs when after the handle is formed, the price does not successfully pierce above the resistance level but instead dips below the low of the handle. This breaking will usually involve an increase in selling pressure that will provide the fuel for moving the price down more quickly. Actually, the process can be accelerated with heavy volume.
Graphically, the downtrend reversal in the cup and handle pattern indicates a failure of the prices to break out above the resistance level and then dip below the handle, probably falling lower than the initial formation of the cup. This shows how important it is to wait for a pattern to be confirmed before stepping into a trade, which can lead to huge losses if the pattern reverses when entering the trade too early.
Conclusion
Cup and handle is one of the strongest patterns a trader or investor can have in its arsenal, giving a reliable signal of a bullish continuation. All this helps you trade with a little more insight and some strategy as to pattern recognition. Although the pattern is mainly bullish and it is easy to recognize, one must still keep in mind the importance of confirming the breakout and volume so as to avoid fake signals. Combine a Cup and Handle Pattern with other technical indicators and always remain disciplined to increase your trading performance and maximize profitability from the upside market scenario.
Frequently Asked Questions
1. What is a cup and handle pattern?
A cup and handle pattern is a chart formation that resembles a tea cup, with a rounded bottom and a small consolidation or pullback on the right side, known as the handle. It is used in technical analysis to predict bullish continuations in price.
2. How reliable is the cup and handle pattern?
The cup and handle pattern is considered a reliable bullish continuation pattern when correctly identified and confirmed with a breakout above the handle's resistance and increased trading volume.
3. Can the cup and handle pattern be used in all markets?
Yes, the cup and handle pattern can be applied across various markets, including stocks, forex, and cryptocurrencies. It is versatile and effective in different asset classes.
4. What are the limitations of the cup and handle pattern?
The main limitations include the risk of false signals, the time-consuming formation process, its applicability primarily in bullish markets, and the need for volume confirmation.
5. What should traders do to avoid false signals?
To avoid false signals, traders should wait for a confirmed breakout above the handle’s resistance level with increased volume before entering a trade. This helps ensure the pattern's validity.
6. Is the cup and handle pattern always bullish?
Primarily, the cup and handle pattern is a bullish continuation pattern. However, external factors and market conditions can sometimes lead to false signals, so it’s important to confirm the pattern before making trade decisions.
Disclaimer: This article is for educational purposes only and should not be considered financial advice. Always conduct your research and consider consulting with a financial advisor before making any investment decisions.
Divyansh Shah is a seasoned Risk Analyst with a deep-rooted understanding of financial markets and risk management strategies. With a keen eye for detail and a passion for data-driven insights, Divyansh has honed his skills in identifying and mitigating potential risks within complex financial environments.