Have you ever looked at a stock chart and felt totally confused by all those red and green candles? You're not alone—many new traders feel the same way. But what if I told you that just one simple candle could give you a clear sign of a possible price drop? That’s where the shooting star candlestick pattern comes in.
This blog will help you understand exactly what this pattern is, how to spot it easily, and—most importantly—how to use it to make smarter trading decisions. Whether you're trading stocks, forex, or crypto, this guide is written in simple words just for you. Ready to learn something powerful that most traders miss? Let’s dive in!
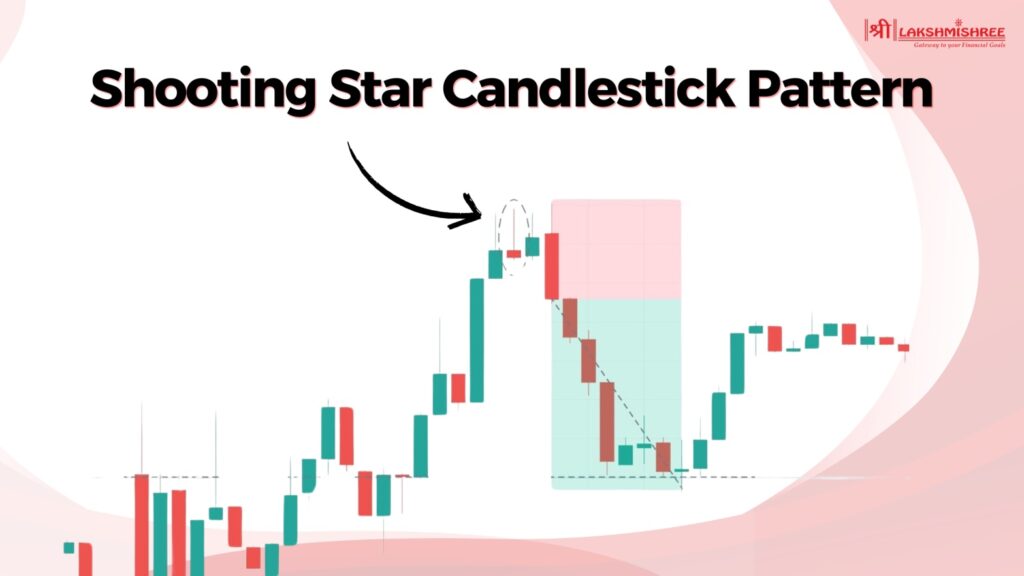
A shooting star candlestick pattern is a special candle that appears on a price chart and gives traders a signal that the price might fall soon. It usually shows up after the price has been going up for a while and tells us that the buyers may be getting tired and sellers are starting to take control.
This pattern looks like a star falling from the sky—hence the name “shooting star.” It has a small body at the bottom and a long upper shadow (or wick), with little or no shadow below. The long upper shadow means that the price went up during the day, but sellers pushed it back down before the candle closed. This creates a sign of weakness in the uptrend.
📌 Here's what you need to remember about this candlestick:
Not all shooting star candlestick patterns are the same. They may look similar, but each one has slightly different meanings based on where they appear and how the market reacts to them.
Let’s break them down in simple terms:
The structure of a shooting star candlestick pattern is what makes it easy to spot—even for beginners. It's made up of three simple parts, and once you see it a few times on a chart, you'll never miss it again!
Here’s what the structure looks like:
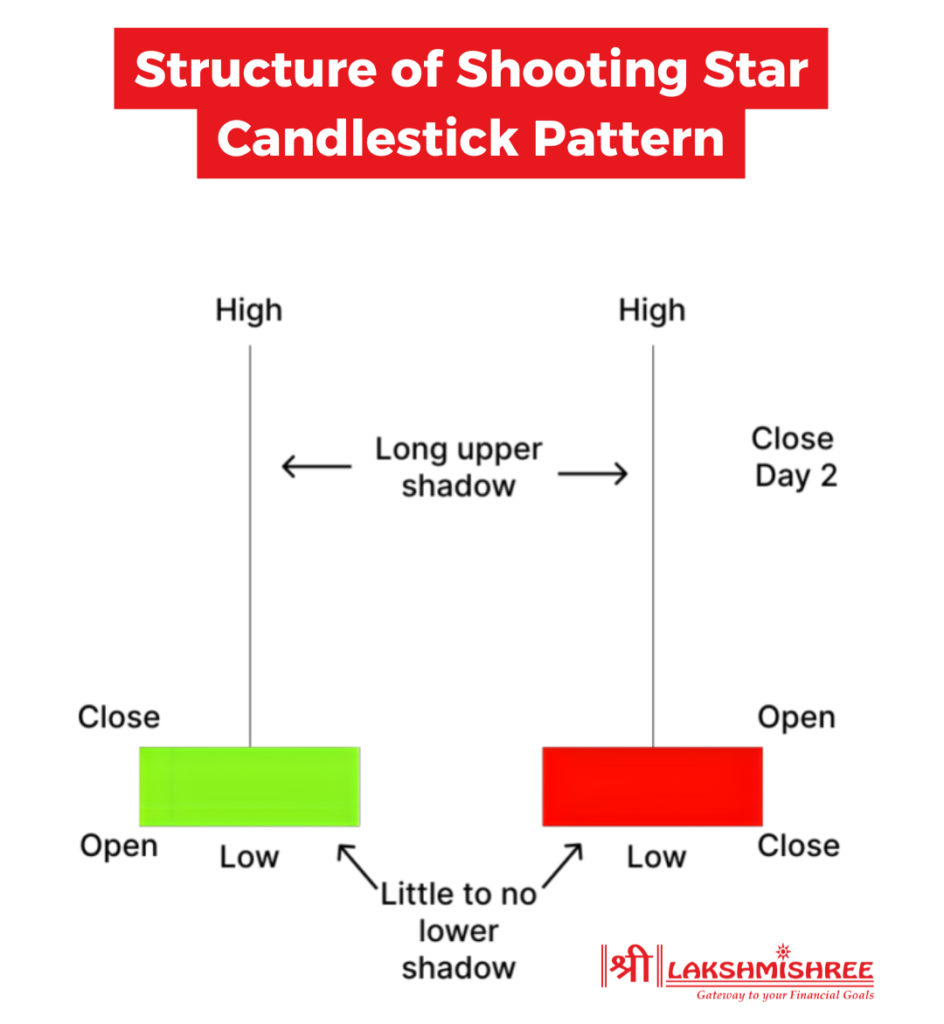
Red or Green—Does It Matter?
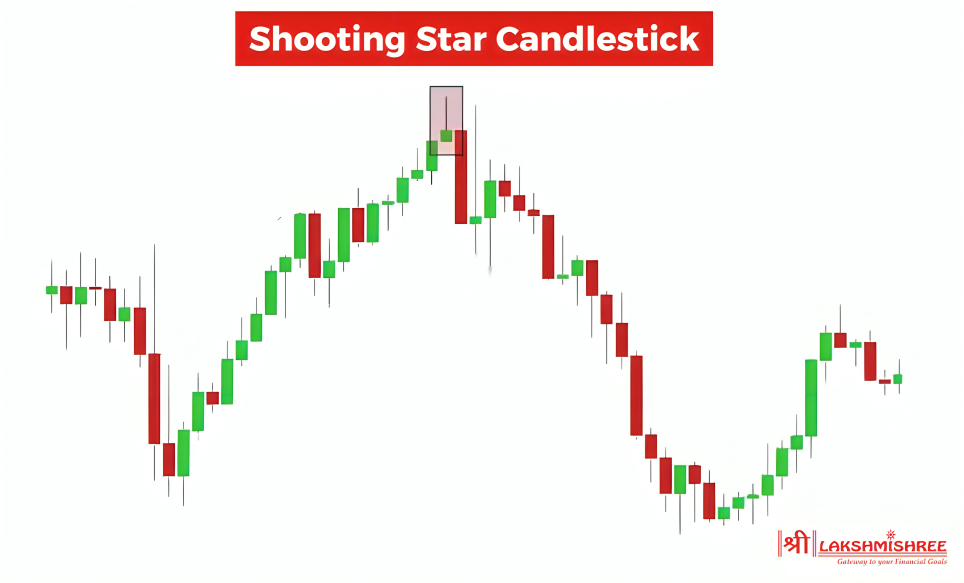
Spotting a shooting star candlestick pattern is not just about looking at the candle shape—it’s about reading the full market story it tells. If you're trading in India or anywhere else, recognising this pattern correctly can give you a big edge. Let’s keep it simple and clear.
Step 1: Look for the Pattern After an Uptrend
This pattern only matters if it comes after a clear upward price movement. If you see a candle that looks like a shooting star, but it's not following a rise in price, then it's not a valid shooting star. It might be something else like an inverted hammer.
Step 2: Check the Shape of the Candle
A proper shooting star has:
The colour of the body (red or green) doesn’t change the pattern name, but a red candle gives a stronger bearish signal.
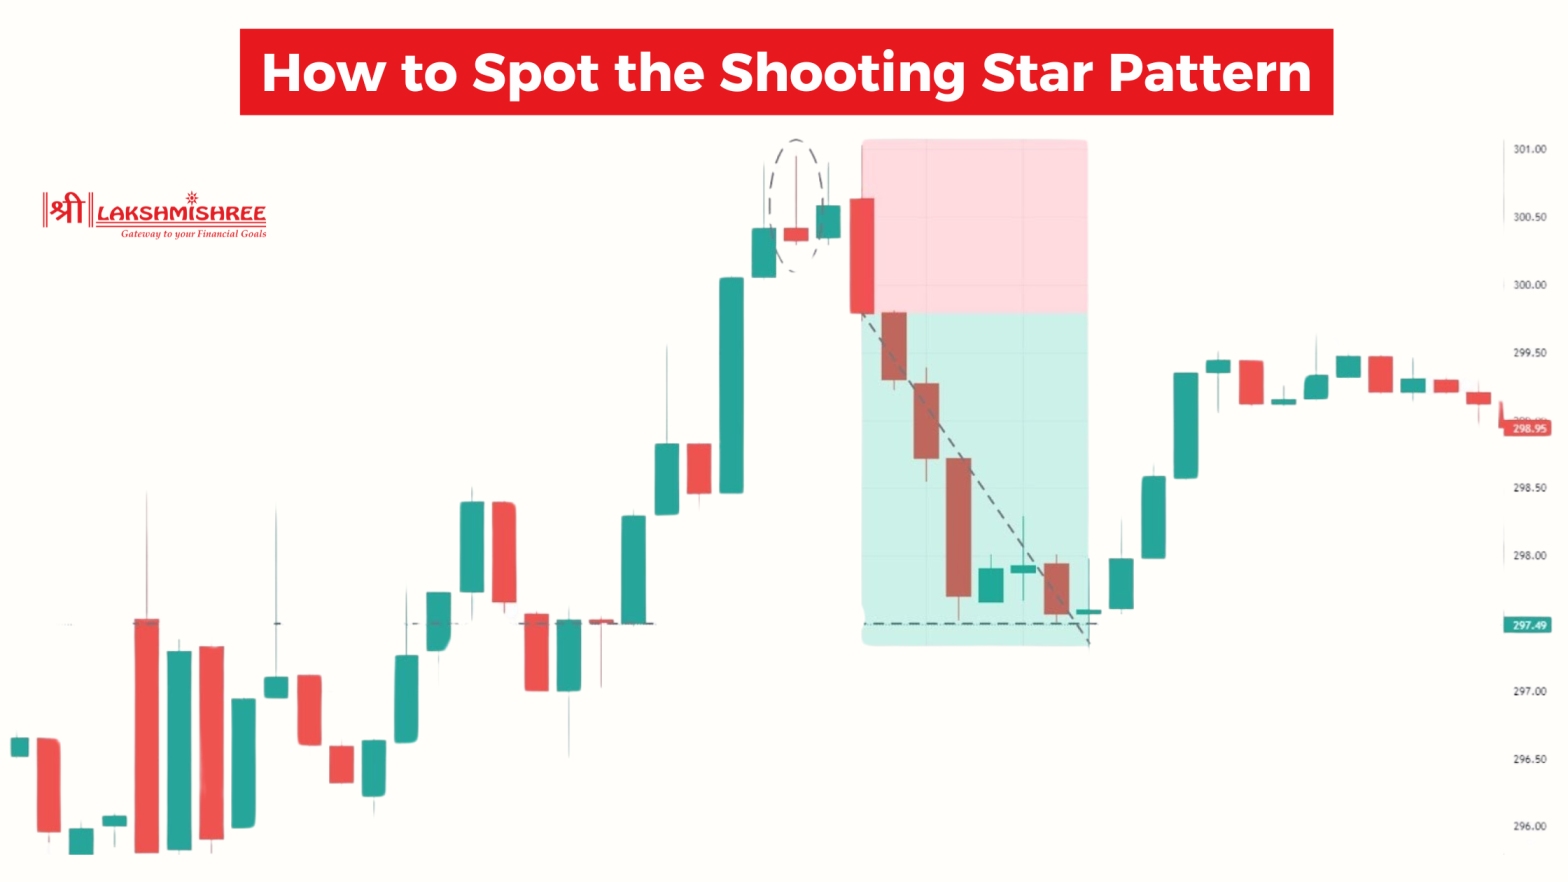
Step 3: Confirm It’s at a Resistance Level
This is something many blogs miss—but it’s super important. A shooting star becomes more reliable when it forms near a known resistance zone (a price area where the market has reversed before). The long upper wick shows that the market tried to break higher, but failed—this means supply is stronger than demand at that level.
Step 4: Check for Confirmation
A true pro doesn't jump in based on one candle. You should wait for a confirmation candle—usually a strong red (bearish) candle that closes below the body of the shooting star. This tells us the sellers are now fully in control.

Let’s break down the key differences between the shooting star pattern and other similar candlestick patterns. Each of these has its own meaning and signals, and understanding the difference can save you from entering the wrong trade.
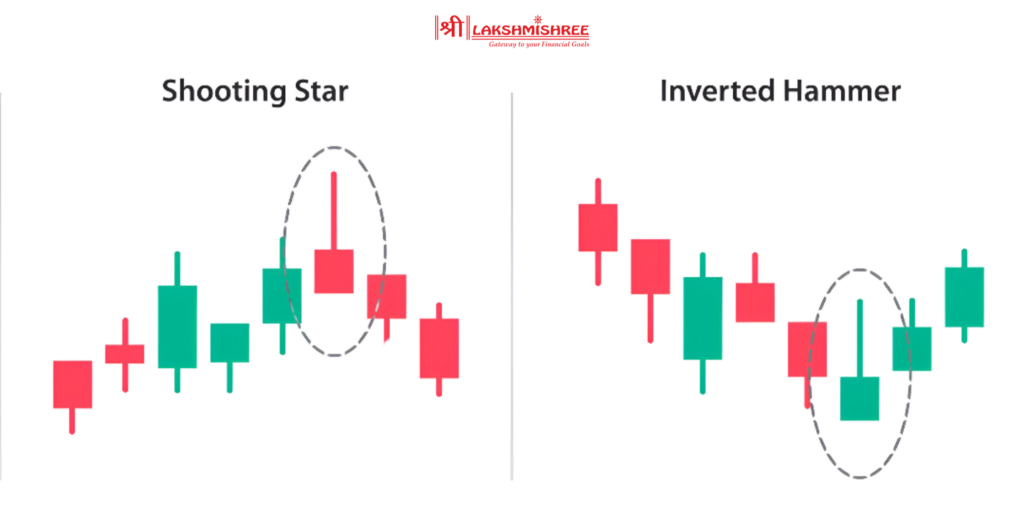
The shooting star and the inverted hammer may look almost the same because both have long upper wicks and small bodies. However, the main difference lies in their position on the chart.
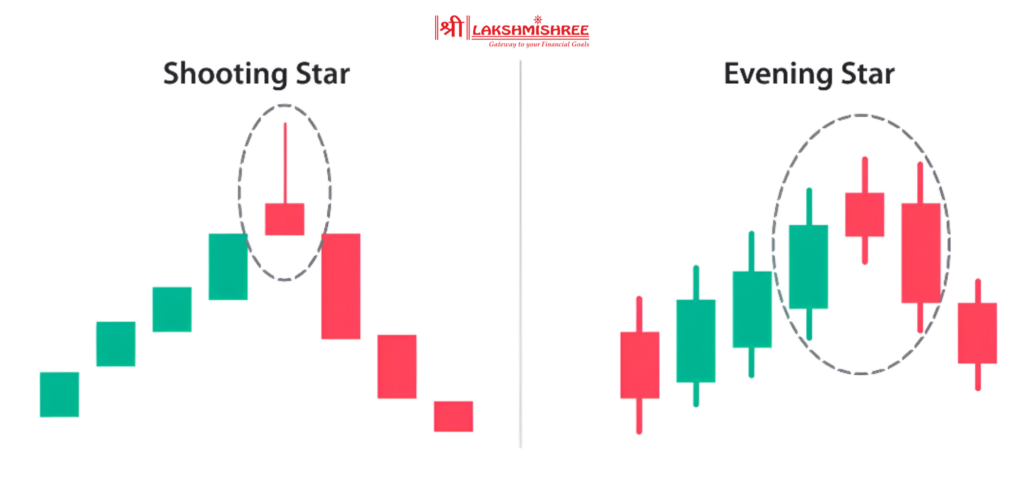
The evening star is a three-candle pattern and gives a stronger signal than a single shooting star. Here's how they differ:
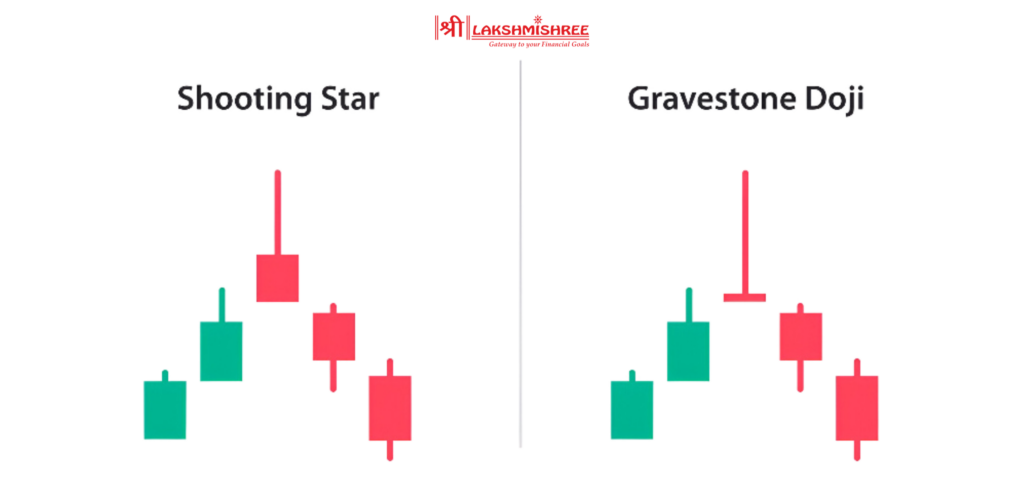
These two look quite similar because both have long upper wicks and almost no lower shadows. But here’s the big difference:
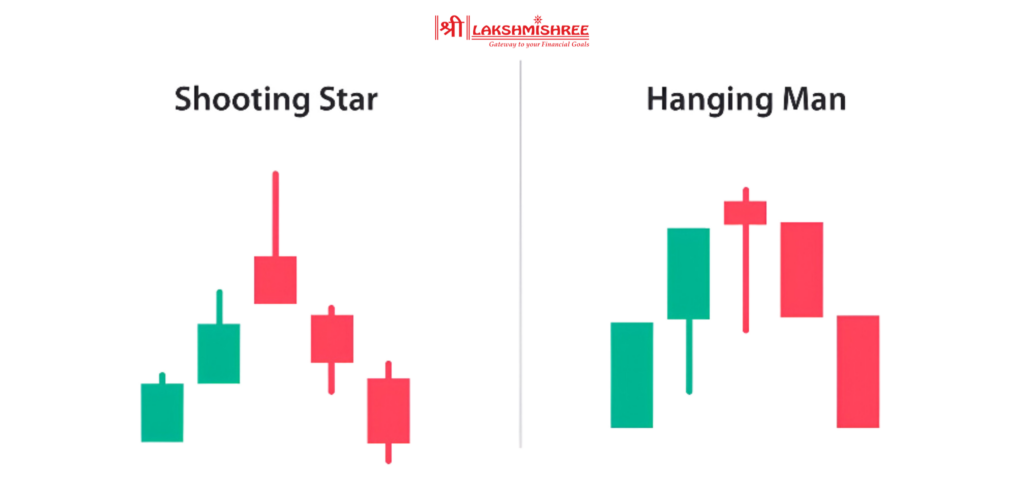
This one is a complete opposite in terms of structure but not in position.
Trading the shooting star candlestick pattern isn’t just about spotting the candle—it’s about planning your entry, exit, and protection like a pro. A smart strategy will help you avoid losses and catch bigger moves.
Step 1: Perfect Entry Timing
The shooting star is most useful at the end of a strong uptrend, especially when prices have been rising for a few sessions. Once you spot the shooting star, don’t rush in. Wait for confirmation—usually a strong bearish candle that closes below the shooting star’s low. This shows that sellers are truly taking over.
Let’s say a stock is in an uptrend and forms a shooting star at ₹510. The low of the shooting star is ₹500. A good strategy would be to enter the trade around ₹499–₹498, once a bearish confirmation candle closes below ₹500.
Step 2: Setting a Safe Stop-Loss
Every good trader uses a stop-loss to protect against market surprises. In the case of the shooting star, the most common place to put a stop-loss is just above the high of the shooting star’s upper wick. This makes sense because if the price goes above this level, the pattern has failed.
Your stop-loss should be just above the high of the shooting star. So if the high is ₹510, you can set your stop-loss around ₹512–₹513 to allow a small buffer. This limits your potential loss to around ₹13–₹15 per share, depending on entry.
Step 3: Planning the Take-Profit Target
Unlike some technical tools, the shooting star doesn’t give an exact price target. So, traders usually rely on:
If your risk is ₹13, aim for at least a 1:2 or 1:3 risk-to-reward ratio.
That means your target profit should be ₹26 to ₹39 per share.
So if you enter at ₹498, your first target could be ₹472 and your second target ₹459—depending on nearby support or Fibonacci retracement levels.
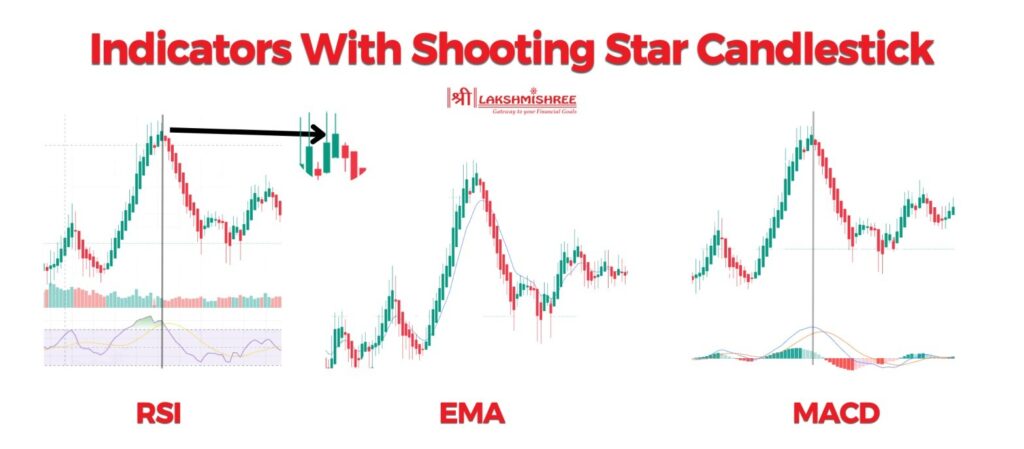
The shooting star candlestick pattern is a reliable bearish reversal signal when used correctly—especially after a strong uptrend, near key resistance levels, and confirmed by a bearish candle. Its accuracy increases significantly when paired with volume spikes or indicators like RSI or MACD. However, like all price action patterns, it should not be used alone as it can give false signals in sideways or weak trending markets.
The best time to trade the shooting star pattern is on higher timeframes like the 1-hour, 4-hour, or daily chart, especially after a sharp uptrend. It’s most effective when the candle forms at a key resistance level or after 2–3 strong bullish candles, often with RSI above 70. For intraday traders, using the 15-minute or 1-hour chart near opening market hours (9:15 AM – 11:00 AM IST) in the Indian stock market can give better clarity and volume support. Confirming the signal with a bearish candle closing below the shooting star's low improves the pattern's reliability and reduces false entries.
The shooting star candlestick pattern is a bearish reversal signal, not bullish. It forms after an upward price move and suggests that buyers are losing momentum while sellers are starting to take control. The long upper wick shows that the price tried to rise but was rejected by strong selling pressure, leading to a potential downward reversal.
The shooting star candlestick pattern is one of the most powerful bearish reversal signals in technical analysis, especially after a strong uptrend. By understanding the different types of shooting star candlesticks—classic, bearish, and even green shooting stars—you can identify market turning points more confidently. Always combine the shooting star pattern with indicators or resistance zones for higher success rates. Whether you’re spotting a bullish shooting star candlestick mistake or correctly identifying a bearish setup, trading with confirmation improves accuracy.
A shooting star candlestick pattern is a bearish reversal signal that forms after an uptrend, showing that sellers are overpowering buyers and a price drop might follow.
The main types include the classic shooting star, bearish shooting star, and inverted shooting star, each showing different levels of reversal strength depending on market context.
A bullish shooting star is not technically correct. If a shooting star appears in a downtrend and suggests a bounce, it is usually referred to as an inverted hammer, not a bullish shooting star.
A green shooting star candlestick forms when the price closes slightly higher than the opening price, but still shows a long upper wick; although still valid, it is considered a slightly weaker bearish signal compared to a red shooting star.
No, if a similar candle shape appears during a downtrend, it is usually called an inverted hammer, which hints at a potential upward reversal, not a bearish continuation.
To confirm a shooting star signal, wait for the next candle to close below the low of the shooting star with strong bearish momentum; also check for high volume, overbought RSI, and resistance nearby for stronger confirmation.
Disclaimer: This article is intended for educational purposes only. Please note that the data related to the mentioned companies may change over time. The securities referenced are provided as examples and should not be considered as recommendations.

