Have you ever felt confused when the stock market is going up, but most of your stocks are still in red? You're not alone! This happens because the index might rise even when only a few big stocks are moving up. That’s where the advance decline ratio comes in — it helps you understand the real mood of the market, not just what the headlines say.
In this blog, we’ll break down the advance decline ratio in a super simple way. Whether you're a beginner or someone already trading on NSE, this guide will show you how to read market sentiment more clearly, spot hidden trends, and avoid common traps.
The advance decline ratio is a market breadth indicator that shows the relationship between the number of advancing stocks and the number of declining stocks over a specific period. It helps traders and investors understand whether the broader market trend is strong or weak, beyond what major indices like Nifty or Sensex are showing.
In the stock market, not every stock moves in the same direction as the index. Sometimes, a few heavyweight companies can push the index up, even when the majority of stocks are falling. It reveals the true internal strength of the market by comparing how many stocks have risen versus how many have fallen.
A higher advance decline ratio indicates that a larger number of stocks are participating in the upward movement, signalling a healthy and strong market trend. On the other hand, a low ratio suggests that the market's rise could be limited to a few stocks, and the broader market might be under pressure.
It is not just useful for day-to-day trading. It can also be used over longer periods to track the overall health of the market. When monitored consistently, this ratio can reveal early warning signs of market reversals or confirm the strength of ongoing trends.
Also Read: What is Upper Circuit and Lower Circuit in the Share Market
There are mainly two types of ADR that traders and investors use to measure market sentiment:
The daily advance decline ratio is calculated based only on the trading activity of a single day. It shows how many stocks advanced compared to how many declined on that particular day. This ratio is useful for understanding short-term market momentum and quickly spotting shifts in market sentiment.
Daily ADR helps traders to:
The cumulative ADR tracks the running total of advancing and declining stocks over a longer period. Instead of resetting every day, it keeps adding the daily difference to the previous total, building a continuous picture of market strength or weakness.
Cumulative ADR is often used to:
Unlike the daily ratio, which can be volatile, the cumulative advance decline ratio smoothens short-term noise and gives a clearer view of underlying market trends.
It is calculated using a straightforward formula that compares the number of stocks that advanced to the number of stocks that declined during a particular period.
Advance Decline Ratio = Total Number of Advancing Stocks ÷ Total Number of Declining Stocks
This formula gives a quick measure of market sentiment.
It is a simple yet powerful tool that helps traders and investors understand the broader market movement, beyond just looking at index levels.
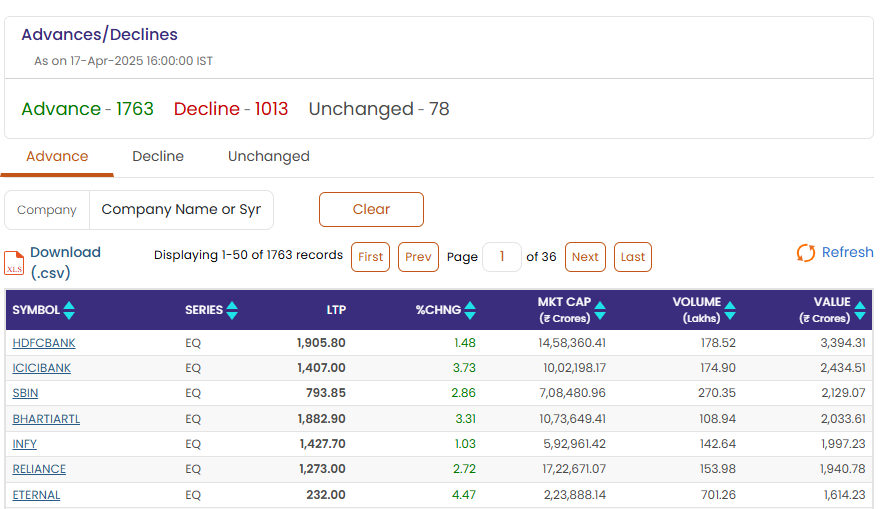
Let us understand how the ADR works with a real example:
Suppose on a trading day at the NSE:
Using the formula:
Advance Decline Ratio = 450 ÷ 300 = 1.5
Interpretation:
An ADR of 1.5 means that for every 1 stock that fell, 1.5 stocks rose. This shows that the market had broad support and the bullish sentiment was strong.

It is an important market breadth indicator that provides deeper insights into the overall market condition. Here’s why it matters:
The NSE advance decline ratio is a useful metric to gauge the internal health of Indian equity markets. In contrast to international indices, the composition of the Indian market is hugely dependent upon a couple of sectoral leaders such as banking and IT. Monitoring the NSE-specific advance-decline data helps to overcome the bias of the headline stocks and measure the extent to which wider sectors are participating.
What enhances the significance of the advance decline ratio today in India is that there is substantial participation by retail investors in conjunction with institutional movements. Monitoring the same on a consistent basis allows one to identify if a rally has some backing of the general market or is narrow and limited to specific heavyweight stocks.
In addition, NSE offers real time advance-decline data across different indices like Nifty 50, Nifty Next 50, Nifty Midcap, and Nifty Smallcap. Considering them separately reveals more insight into what parts of the market are leading or lagging and is extremely beneficial to identify sectors where rotation is taking place.
Also read: Price-to-Book Ratio (P/B Ratio): Your Investment Guide
The advance decline indicator offers powerful insights into the market’s internal strength, but it must be interpreted carefully to make accurate trading or investing decisions. Here are the key ways to correctly read and analyse it:
1. Understand the Key Levels
2. Monitor the Trend of the ADR
3. Watch for Extreme Readings and Spikes
4. Analyse Peaks, Troughs, and Trendlines
It is a powerful tool that helps traders add more confidence to their trading strategies by revealing the true market sentiment. Here are the key ways to use it effectively:
1. Confirming Market Trends
The ADR should move in the same direction as the major market indices, such as Nifty 50.
Following the ADR alongside price trends helps traders avoid false breakouts and unstable rallies.
2. Spotting Sentiment Extremes
By observing extreme readings of the AD Ratio:
However, traders must use historical context to judge extremes, as these levels are relative and can vary between markets.
3. Identifying Early Bull or Bear Market Signals
A steadily rising ADR over months usually confirms a strong bull market where a majority of stocks participate in the rally.
On the other hand, a declining ADR even when prices are flat or slightly rising could indicate the early stages of a bear market, where market breadth weakens long before the indices show it.
Tracking the advance decline ratio today is essential for traders who want real-time insights into the market's true direction. Here are the best tools and platforms where you can access accurate and updated ADR data:
| Feature | Arms Index (TRIN) | Advance Decline Ratio (ADR) |
|---|---|---|
| Considers Volume | Yes | No |
| Measures Market Breadth | Yes | Yes |
| Focus | Buying and selling pressure based on volume | Number of advancing vs declining stocks |
| Formula | (Advancing Stocks ÷ Declining Stocks) ÷ (Advancing Volume ÷ Declining Volume) | Advancing Stocks ÷ Declining Stocks |
| Interpretation Style | Inverted (Lower value = bullish, Higher value = bearish) | Direct (Higher value = bullish, Lower value = bearish) |
| Best Use | Short-term market sentiment analysis | Overall market health assessment |
| Sensitivity | Highly sensitive to daily volume changes | Reflects broader stock participation |
| Common Use | Identifying intraday trend strength and reversals | Gauging long-term market breadth and trend confirmation |
| Ideal for | Day traders and short-term swing traders | Position traders and investors |
Although the AD ratio is a valuable tool for analysing market breadth, it has certain limitations that traders should be aware of:
Institutional investors and professional traders do not simply react to market moves; they carefully analyze the advance-decline ratio (ADR) prior to taking substantial positions. Instead of monitoring day-to-day fluctuations, professional investors and traders monitor longer-term patterns in ADR by sectors and market areas.
Large players frequently seek to identify divergences between ADR and index movement. For instance, if the Nifty is advancing but the ADR declines over several days, this is a sign of underlying weakness. This data serves to help institutions either cut down their exposure or invest in better-performing sectors.
Advance-decline ratio is a useful tool that indicates the true involvement of stocks in a market movement, enabling investors and traders to judge whether the overall market sense is robust or not. Through monitoring ADR, particularly that of leading indices like NSE, traders can make better-informed choices and refrain from being deceived by index moves that are influenced by a limited number of heavyweights.
Along with monitoring other market breadth indicators, using the ADR can significantly sharpen trading strategies, helping spot early signs of trend reversals or confirmations.
The advance decline ratio is a market breadth indicator that compares the number of stocks that closed higher (advances) to the number of stocks that closed lower (declines) during a specific trading session. It helps traders and investors measure the overall health of the market, beyond just tracking the index movements.
You divide the number of advancing stocks by the number of declining stocks for a particular day or time period. The formula is: ADR = Number of Advancing Stocks ÷ Number of Declining Stocks. A ratio above 1 indicates bullish sentiment, while below 1 signals bearish sentiment.
Advance decline ratio indicators are tools that display the relationship between advancing and declining stocks over time. These indicators help in visualising market breadth trends, detecting divergences, and confirming the strength or weakness of a market move. They can be tracked daily or cumulatively for more detailed market analysis.
A good advance decline ratio for the NSE generally means a figure greater than 1.0, indicating that more stocks are advancing than declining. A ratio significantly above 1.0, especially above 1.5 or 2.0, suggests strong market breadth and healthy bullish sentiment.
Yes, the advance decline ratio can be very useful for intraday trading. It helps intraday traders quickly gauge whether the buying or selling pressure is broad-based or limited to a few stocks. Watching the ratio live during the trading session allows traders to adjust their strategies in real-time based on the strength or weakness of market participation.
While both ADR and volume-based indicators provide insights into market behaviour, they focus on different aspects. The ADR measures the number of advancing versus declining stocks without considering their traded volume, whereas volume-based indicators focus on the quantity of shares traded to confirm strength or weakness in price moves.
Disclaimer: This article is for educational purposes only and should not be considered financial advice. Always conduct your research and consider consulting with a financial advisor before making any investment decisions.
