Imagine knowing exactly when a stock or cryptocurrency is about to make a big move—before it even happens. That’s the power of the ascending triangle pattern! This popular chart pattern in trading is often seen as a sign that a strong breakout is on the way. But how do you spot it? And more importantly, how do you trade it successfully?
In this guide, we’ll break down how to identify an ascending triangle, its bullish vs bearish signals, and the best trading strategies to maximize profits. Whether you’re a beginner or an experienced trader, this blog will give you practical, easy-to-understand insights to master the ascending triangle chart pattern.
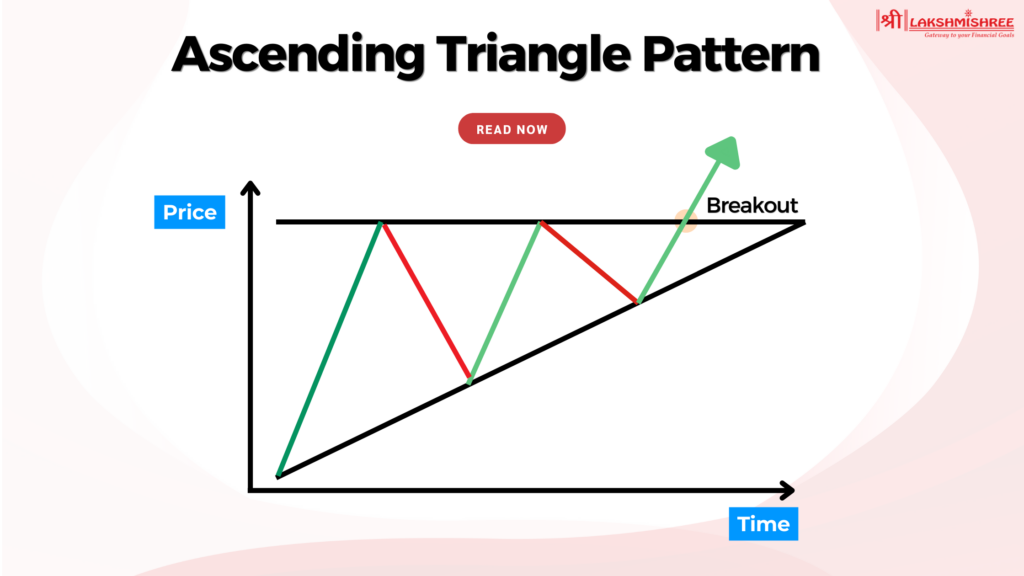
The ascending triangle pattern is a bullish chart formation that traders use to predict potential stock, forex, and crypto market breakouts. It forms when the price moves between a flat resistance level and a rising trendline, creating a triangle-like shape on the chart. As the price keeps making higher lows while facing resistance at the same level, it signals that buyers are gaining strength.
This pattern is considered a continuation pattern, which usually appears in an uptrend and indicates that the price may continue moving higher after breaking through the resistance. However, in some cases, it can also appear in a downtrend, leading to a breakout in either direction.
The ascending triangle pattern in trading tells us one key thing: buyers are becoming stronger. As the price keeps forming higher lows, demand is increasing. At the same time, the resistance level remains unchanged because sellers are still trying to hold their ground.
However, the market usually reaches a breaking point as the pressure builds. If the price breaks above the resistance level with strong volume, it confirms a bullish breakout. On the other hand, if the price fails to break out and drops below the rising trendline, it could signal a trend reversal. This is why traders closely watch this pattern, looking for confirmation signals before making a trade.
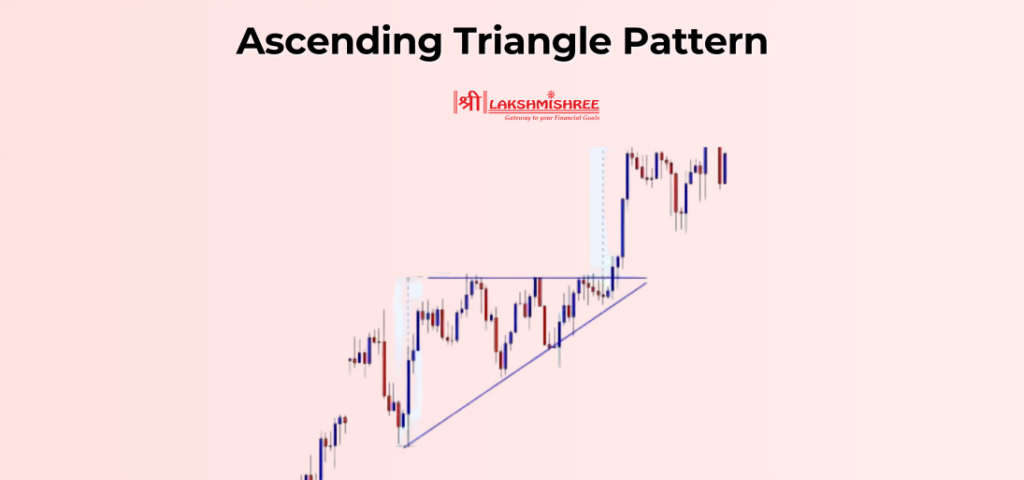
The ascending triangle pattern has distinct features that make it easy to recognize on a trading chart. Here’s what to look for:
Identifying the ascending triangle chart pattern correctly is essential for making profitable trades. Here’s a simple step-by-step guide:
Not every breakout leads to a successful trade—timing, volume confirmation, and risk management are crucial. Below is a step-by-step approach to correctly identifying and trading an ascending triangle breakout.
1. Identify the Ascending Triangle Formation
The first step in trading an ascending triangle pattern is to spot it accurately on the chart. Look for the following signs:
This pattern can appear in various timeframes, from intraday charts to long-term trends. The longer the pattern takes to form, the stronger the potential breakout.
2. Wait for the Breakout Confirmation
A breakout occurs when the price moves above the resistance level of the ascending triangle. However, not every breakout is real—some may be false breakouts that trick traders into entering too early. To confirm a legitimate breakout:
3. Enter the Trade at the Right Moment
Once the breakout is confirmed, traders have two ways to enter a position:
4. Set a Stop-Loss to Minimize Risk
5. Determine the Profit Target
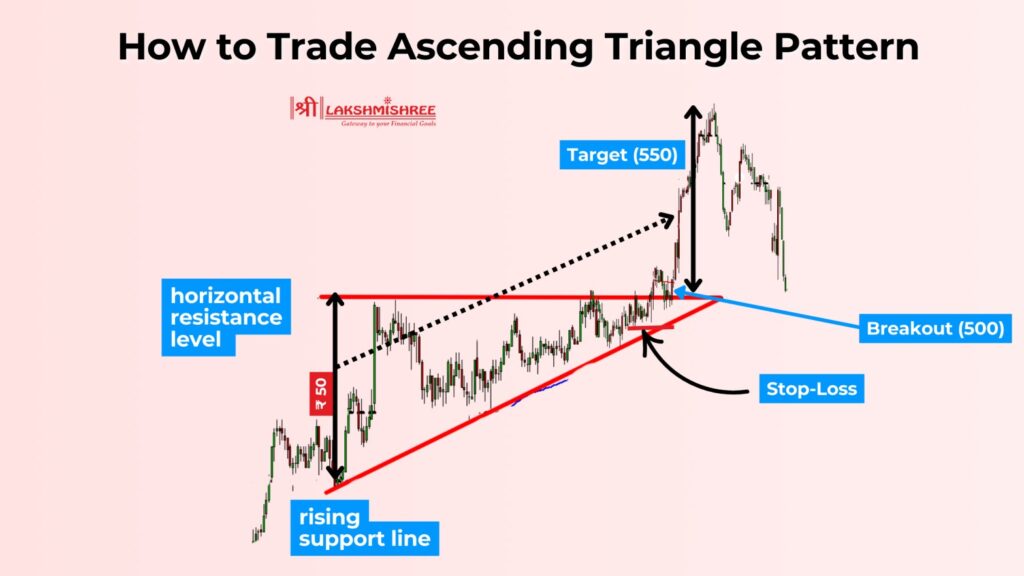
To estimate the price target after the breakout, use the height of the ascending triangle pattern:
📏 Measure the height of the triangle from the base (lowest point) to the resistance level.
📈 Add this height to the breakout level to determine the target price.
For example, if the ascending triangle has a height of ₹50, and the breakout happens at ₹500, the target price would be ₹550.
The ascending triangle pattern is often compared to other chart patterns that look similar but have different implications for price movement. Below, we compare the ascending triangle with two commonly misunderstood patterns: the descending triangle and symmetrical triangle.
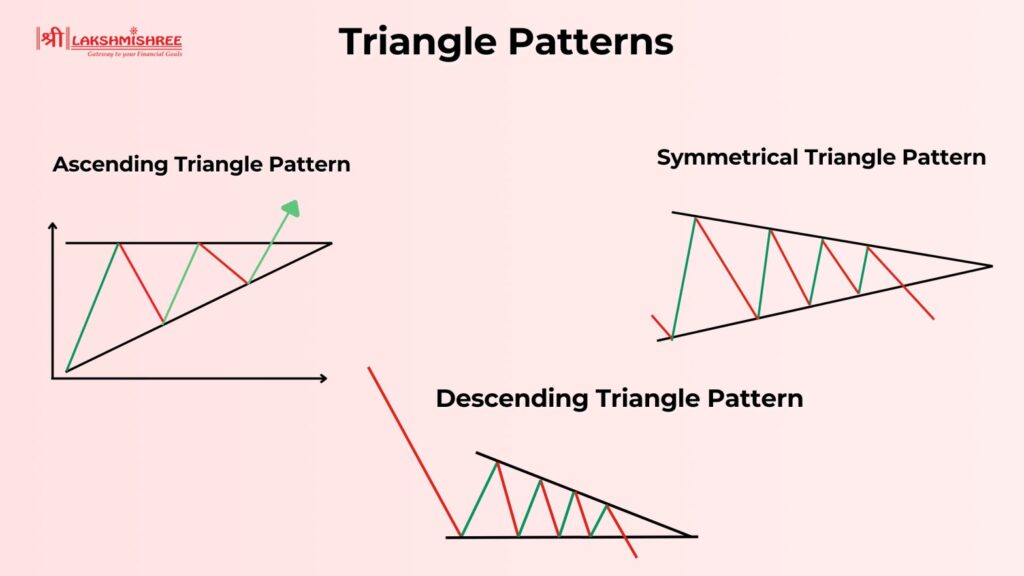
The key difference between an ascending triangle and a descending triangle pattern lies in their breakout direction and market sentiment.
In simple terms, the ascending triangle shows buying strength, while the descending triangle reflects selling pressure.
While both the ascending triangle and symmetrical triangle involve price consolidation, their structure and breakout expectations are different.
The main takeaway is that the ascending triangle is directional (mostly bullish), whereas the symmetrical triangle is neutral, requiring additional confirmation before making a trade.
The ascending triangle pattern is considered a highly reliable bullish pattern, with a success rate of 60-75% when traded correctly. Its accuracy depends on factors such as breakout confirmation, volume surge, and market conditions. One key factor that increases reliability is the time it takes for the pattern to form—the longer the ascending triangle takes to develop, the stronger the breakout tends to be.
Patterns that form over weeks or months generally lead to more sustained price movements than those forming in just a few days. To improve success rates, traders should confirm the breakout with high trading volume and technical indicators while managing risk with proper stop-loss placement.
The reverse ascending triangle pattern is the opposite of the traditional ascending triangle. Instead of a flat resistance and rising support, this pattern features a flat support level at the bottom and a descending resistance line at the top. This formation indicates that sellers are gaining control, gradually pushing the price lower.
Unlike the bullish breakout seen in a regular ascending triangle, the reverse ascending triangle typically leads to a bearish breakdown. Traders watch for a price drop below the flat support level, usually confirmed by an increase in trading volume. This pattern is commonly seen in downtrends and signals potential further declines.
The ascending triangle pattern is primarily a bullish continuation pattern, as it forms when buyers push prices higher while facing resistance. In most cases, the price breaks out upward, confirming a bullish trend. However, in rare instances, an ascending triangle can break downward, making it temporarily bearish. To confirm the breakout direction, traders should look at trading volume, candlestick patterns, and technical indicators.
Using technical indicators alongside the ascending triangle pattern increases the accuracy of breakouts and reduces false signals. Two of the most effective indicators for confirming ascending triangle trades are:
1. Volume Indicator (Most Important for Breakout Confirmation)
Volume is crucial when trading the ascending triangle breakout. A strong breakout is usually accompanied by higher-than-average volume, signaling that buyers are in control.
2. Relative Strength Index (RSI) (Confirms Momentum Before Breakout)
The RSI indicator helps determine whether an asset is overbought, oversold, or gaining momentum before the breakout.
A false breakout in an ascending triangle chart occurs when the price temporarily moves above resistance but fails to sustain the breakout, quickly falling back inside the pattern. To avoid false signals, traders should check for low volume during the breakout, as a weak volume surge often means a lack of buyer commitment.
The best timeframe to trade an ascending triangle pattern depends on the trader’s strategy, but the most reliable signals come from higher timeframes like the 4-hour (H4) and daily (D1) charts. On these timeframes, price movements are more stable, and false breakouts are less common. Intraday traders may find opportunities on 15-minute or 1-hour charts, but these require quick execution and confirmation with volume indicators.
Mastering the ascending triangle requires more than just spotting the setup. Here are some advanced tips to increase accuracy and profitability:
The ascending triangle pattern is one of the most reliable bullish continuation patterns in trading, often leading to strong breakout opportunities. It forms when the price consolidates between a flat resistance level and a rising support line, signalling increasing buying pressure. While the pattern is generally bullish, traders should always confirm breakouts with volume indicators and use stop-loss strategies to manage risk. Comparing it with similar patterns, such as the descending triangle, helps traders avoid confusion.
An ascending triangle pattern is a bullish chart formation that occurs when the price consolidates between a flat resistance level and a rising support trendline. It signals that buyers are gradually gaining strength, often leading to a breakout above resistance.
The ascending triangle pattern is typically bullish, as it suggests buyers are pushing the price higher against resistance. However, in some cases, a breakdown below the rising trendline can turn it bearish, making confirmation with volume essential before entering a trade.
An ascending triangle has a flat resistance and rising support, indicating bullish momentum. In contrast, a descending triangle has a flat support and falling resistance, signaling bearish pressure and a likely downward breakout.
It is considered highly reliable, with a success rate of around 60-75%, depending on volume confirmation and market conditions. Traders improve accuracy by using indicators like RSI and moving averages for additional breakout confirmation.
To calculate the target price after an ascending triangle breakout, measure the height of the triangle from the base to the resistance level and add it to the breakout point. This projection gives an estimate of how far the price might move after breaking resistance.
Disclaimer: This article is intended for educational purposes only. Please note that the data related to the mentioned companies may change over time. The securities referenced are provided as examples and should not be considered as recommendations.
