If you are a trader looking to spot potential breakouts and trend reversals, then the symmetrical triangle pattern is a must-know chart pattern. It appears when price movements start narrowing into triangles, showing a temporary balance between buyers and sellers. But here’s the catch—this pattern doesn’t last forever! Sooner or later, the market makes a strong move, either up or down, creating a great trading opportunity.
But how do you recognise this pattern? How can you predict whether the breakout will be bullish or bearish? In this guide, we’ll break it all down in a simple and easy-to-understand way, helping you master the symmetrical triangle like a pro.
1. Symmetrical triangle patterns can break in either direction—bullish or bearish.
2. Volume confirmation is crucial—a breakout with high volume is more reliable.
3. A symmetrical triangle is identified by two converging trendlines.
4. Using technical indicators can help confirm the breakout before entering a trade.
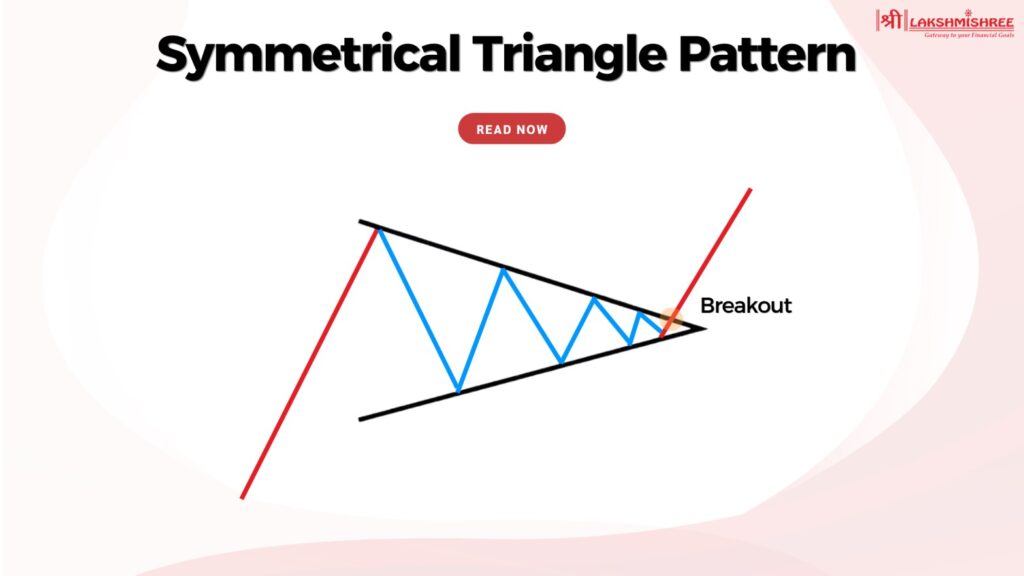
A symmetrical triangle pattern is a widely recognised chart pattern in technical analysis that signals a period of market consolidation before a potential breakout. This pattern forms when the price moves within a narrowing range, creating two converging trendlines—one sloping downward (resistance) and the other sloping upward (support).
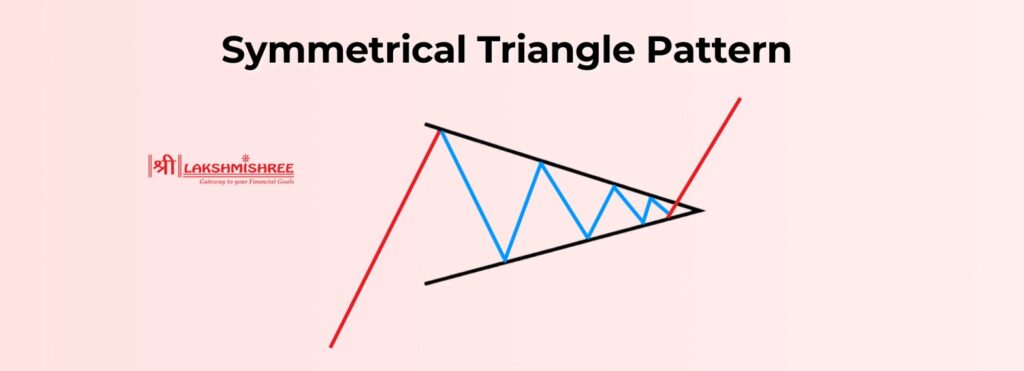
As the price bounces between these trendlines, the gap between them decreases, indicating that buying and selling pressures are reaching a point of equilibrium. Eventually, a breakout occurs, leading to a strong price movement in either direction.
The symmetrical triangle is considered a neutral pattern, meaning it does not inherently signal a bullish or bearish trend. Instead, the direction of the breakout determines the market’s next move. Traders closely watch this pattern as it offers clear entry and exit points, helping them avoid premature trades.
The symmetrical triangle is a versatile chart pattern that can lead to either an upward (bullish) breakout or a downward (bearish) breakout. While the pattern itself is neutral, traders analyse key signals to predict which direction the breakout is likely to occur. Let’s explore the two possible outcomes:
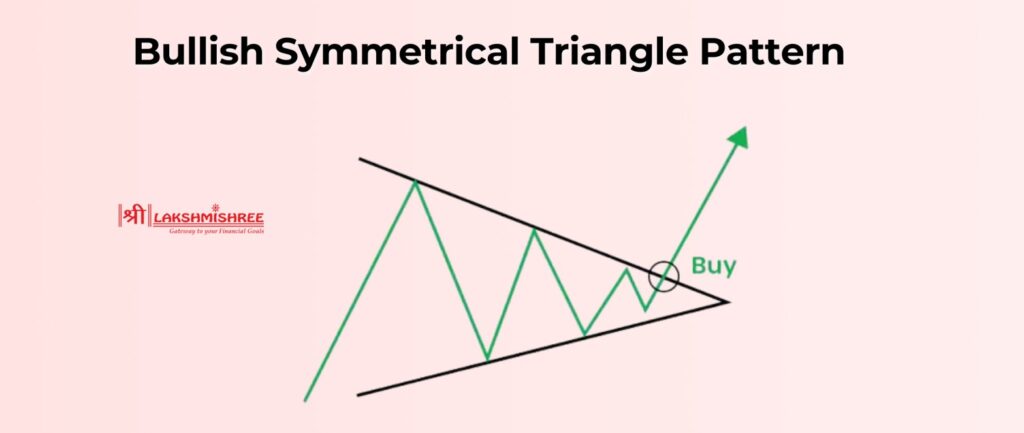
A bullish symmetrical triangle pattern forms when the price consolidates within the triangle and eventually breaks above the resistance trendline. This indicates that buying pressure has overcome selling pressure, leading to a potential uptrend continuation.
Key Characteristics of a Bullish Breakout:
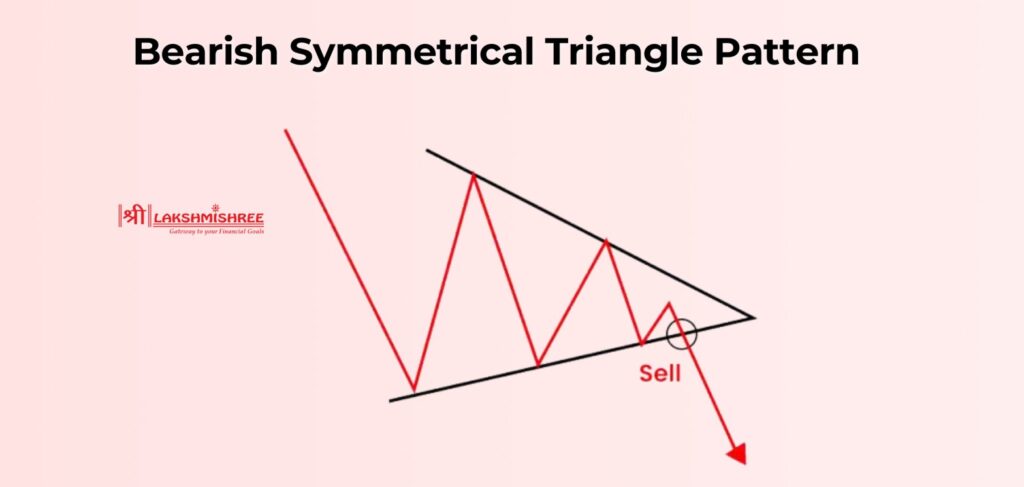
A bearish symmetrical triangle occurs when the price consolidates within the triangle and eventually breaks below the support trendline. This suggests that sellers have gained control, leading to a downtrend continuation.
Key Characteristics of a Bearish Breakout:
A symmetrical triangle chart pattern is formed when an asset's price moves within two converging trendlines—one descending from the top and one ascending from the bottom. This results in a triangle-like shape where price fluctuations become narrower over time.
Steps to Identify a Symmetrical Triangle:
Example of Identifying a Symmetrical Triangle:
A stock moves in a sideways pattern after a strong uptrend. You notice the price forming lower highs and higher lows, converging into a triangle shape. As the stock approaches the apex, volume decreases. Finally, it breaks out above resistance with a spike in volume, confirming a bullish symmetrical triangle breakout.
Trading a symmetrical pattern requires patience and confirmation to avoid false breakouts. Below are the key steps to successfully trade this pattern with proper risk management.
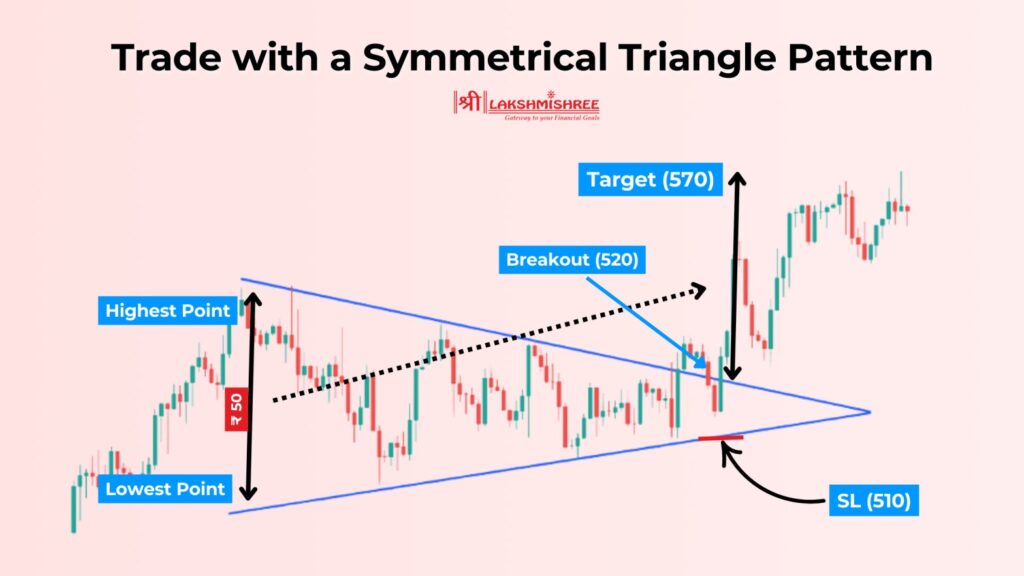
Consider a stock trading at ₹500, forming a symmetrical triangle over several weeks.
1. Formation of the Symmetrical Triangle Pattern
2. Breakout Confirmation
3. Target Price & Stop-Loss Placement
4. Result & Trade Outcome
The symmetrical triangle is one of the most valuable tools for traders in the Indian stock market. It helps predict potential breakouts and identify trading opportunities with a proper risk-reward setup.
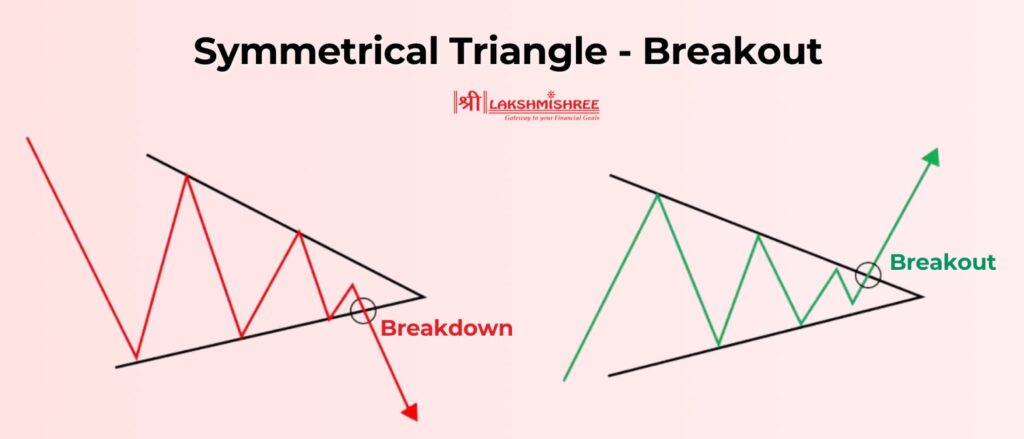
The symmetrical triangle breakout is the most critical phase of this pattern. It determines whether the price will move upward (bullish breakout) or downward (bearish breakout). Traders must be cautious while entering a trade, as false breakouts are common.
Key Factors to Consider for a Symmetrical Triangle Breakout

A symmetrical triangle is a consolidation pattern with two converging trendlines, indicating an impending breakout in either direction. In contrast, a pennant is a small triangular pattern that appears after a strong price movement, acting as a brief pause before the trend continues.
Comparison Table: Symmetrical Triangle vs. Pennant
| Feature | Symmetrical Triangle | Pennant |
|---|---|---|
| Formation | Forms when price consolidates within two converging trendlines | Forms after a strong price movement, resembling a small triangle |
| Trend Direction | Can break upward or downward, making it a neutral pattern | Typically follows the previous trend (bullish or bearish) |
| Timeframe | Develops over weeks to months | Shorter duration, usually lasts a few days |
| Volume Behaviour | Volume decreases as the pattern forms and surges on breakout | Volume drops during formation and increases at breakout |
| Trading Approach | Traders wait for breakout confirmation before entering a trade | Traders enter as soon as price breaks the pennant’s boundary |
| Reliability | Requires additional indicators for confirmation | More reliable when following a strong trend |
Yes, false breakouts are common in the symmetrical triangle, and they can mislead traders into making incorrect trade decisions. A false breakout occurs when the price temporarily moves beyond the support or resistance trendline but quickly reverses and re-enters the triangle. This happens due to low trading volume, market manipulation, or weak momentum.
A symmetrical triangle pattern differs from ascending and descending triangles in both formation and breakout behaviour. A symmetrical triangle has two converging trendlines that slope toward each other at nearly the same angle, indicating market indecision before a breakout. In contrast, an ascending triangle has a flat resistance level and an upward-sloping support line, indicating a potential bullish breakout.
A descending triangle, on the other hand, has a flat support level and a downward-sloping resistance line, suggesting a likely bearish breakout.
The symmetrical pattern can last from a few weeks to several months, depending on the timeframe of the chart. The pattern typically forms during price consolidation, with the breakout occurring near the apex of the triangle, where the two trendlines converge. The duration is influenced by market volatility, stock liquidity, and trend strength. Traders should analyse the timeframe carefully to align their trading strategy with the expected breakout.
Trading the symmetrical triangle pattern effectively requires the use of technical indicators to confirm breakouts and avoid false signals. While no single indicator guarantees success, combining multiple indicators increases accuracy and reliability. Below are the best indicators to trade with a symmetrical triangle chart pattern:
The symmetrical triangle pattern is a powerful technical analysis tool that helps traders identify potential breakouts in the stock market. This pattern forms when two converging trendlines create a triangle shape, signalling market consolidation before a substantial price movement. A symmetrical triangle breakout can be bullish or bearish, depending on the price's direction. To trade it effectively, traders should use volume confirmation, stop-loss strategies, and target projections based on the triangle’s height.
A symmetrical triangle pattern is a neutral chart pattern that forms when an asset's price moves within two converging trendlines, creating a triangular shape. It indicates market indecision, with a breakout occurring in either an upward (bullish) or downward (bearish) direction.
The accuracy of the symmetrical triangle pattern depends on breakout confirmation and volume strength. When accompanied by high trading volume, its success rate improves significantly. Traders often use technical indicators like RSI and MACD to validate breakout signals.
A symmetrical triangle pattern is a neutral formation, meaning it can lead to a bullish or bearish breakout. The direction depends on whether the price moves above resistance (bullish breakout) or below support (bearish breakout).
To calculate the symmetrical triangle pattern target, measure the height of the triangle (distance between the highest and lowest points) and project it from the breakout point. For example, if the triangle height is ₹50 and the breakout occurs at ₹500, the target price would be ₹550 for an upward breakout.
A symmetrical triangle pattern breakout is confirmed when the price moves above resistance (bullish) or below support (bearish) with strong volume. Traders wait for a full candle close beyond the trendline before entering a trade.
The success rate of a symmetrical triangle pattern varies based on market conditions and volume confirmation. Studies show that when breakouts occur with strong volume, the pattern has a success rate of 60%–75% in predicting future price movements. Using additional technical indicators enhances accuracy.
Disclaimer: This article is intended for educational purposes only. Please note that the data related to the mentioned companies may change over time. The securities referenced are provided as examples and should not be considered as recommendations.
