Imagine you are trading in the stock market, and suddenly, the price of a stock stops rising at a certain level and starts falling. Later, when the price drops, it stops at another level and moves back up. Ever wondered why this happens? These price barriers are known as support and resistance, two of the most powerful concepts in technical analysis.
Whether you're a beginner or an experienced trader, mastering these levels can give you a major advantage in the stock market. This blog will explore what they are, how to identify them, and the best strategies to use them effectively in trading.
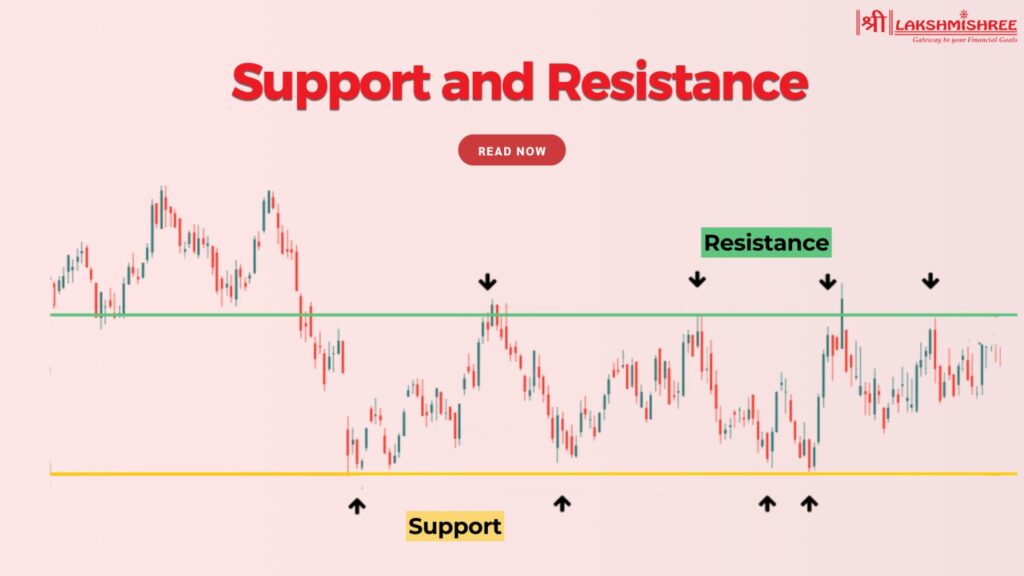
In stock trading, both support and resistance refer to significant price levels at which a price will stop and reverse direction. Resistance and support function similarly to invisible walls, in that a price will reverse direction at, or break through, such price levels. They are integral to technical analysis, in that a price will make an informed decision about buying, selling, and stop-losses.
In stock market trading, support is the level where the price of a stock will stop and reverse. These are like invisible walls, so you know where the price will reverse or break through. These are critical for technical analysis so you can make better decisions on buying, selling and setting stop losses.
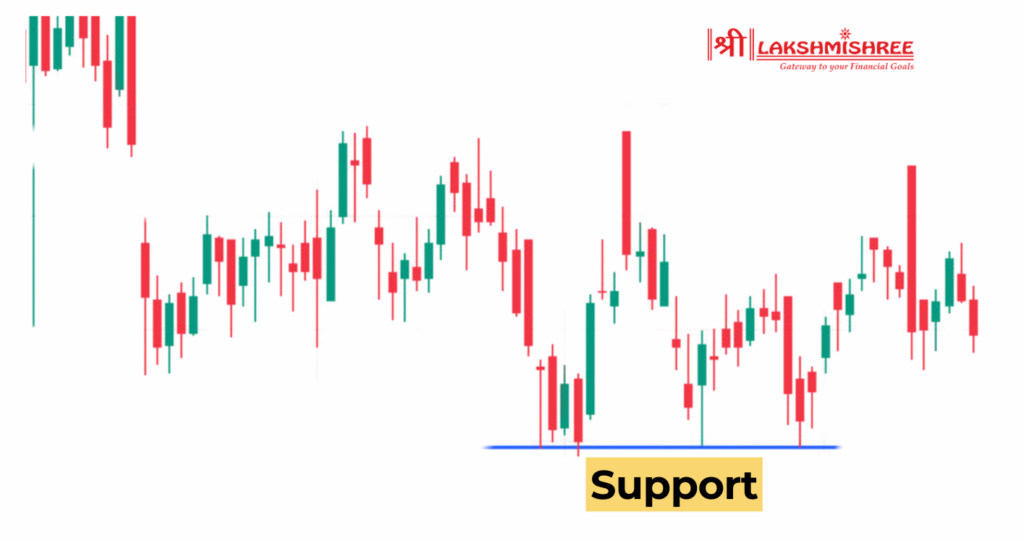
When the price of a stock touches a level of support, buyers enter, and demand takes off, sending prices up again. That is simply because most investors believe that at such a level, the security is undervalued and a buying opportunity.
However, if the price dips below the level of support, then buying demand will become less strong concerning selling pressure. This will make the price drop even lower, with speculators expecting the price to drop even lower till a new level of support is attained.
Resistance is the opposite of support. It is a price level where a stock struggles to go higher because selling pressure increases. It acts like a ceiling, preventing the price from rising further as traders begin to sell their positions.
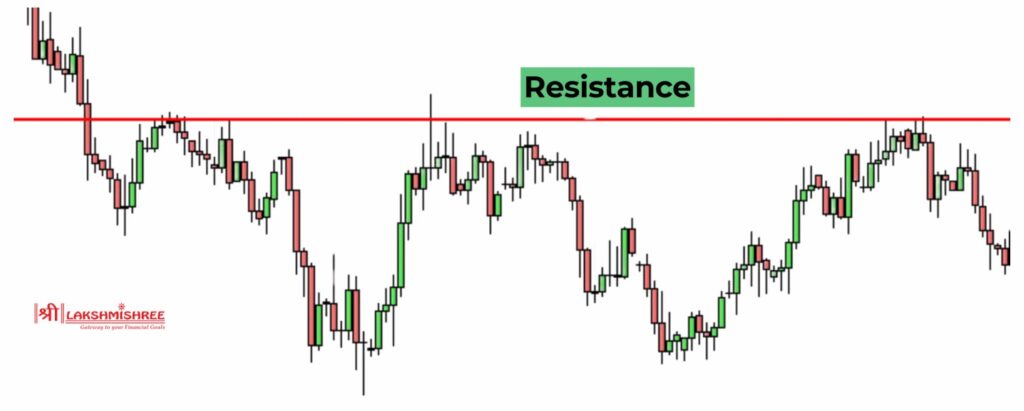
When a stock’s price reaches a resistance level, many traders believe it has become overvalued, leading to increased selling activity. This selling pressure causes the price to stop rising and often results in a reversal.
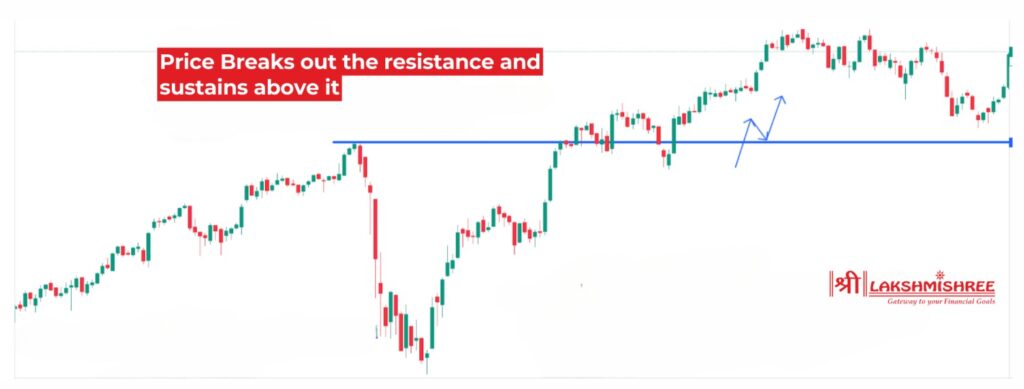
However, if the price breaks above resistance, it signals that buyers have overpowered sellers, and the stock may continue its upward movement. In such cases, the previous resistance level can turn into a new support level, as traders who missed the initial breakout may look to buy when the price retraces.
They are crucial in predicting price movements and making informed trading decisions in stock market trading. These levels help traders identify potential reversal points, entry and exit opportunities, stop-loss placements, and trend direction changes.
1. Setting Entry and Exit Points
Support and resistance levels help traders determine ideal trade entry and exit points.
Candlestick patterns at these levels, such as pin bars, doji, or engulfing candles, provide additional confirmation of price action.
2. Stop-Loss and Target Setting
Using these zones helps traders logically set stop-loss orders and profit targets:
3. Trend Reversal Indication
If a stock price breaks below support, it suggests that sellers have taken control and If a stock price breaks above resistance, it indicates strong buying momentum.
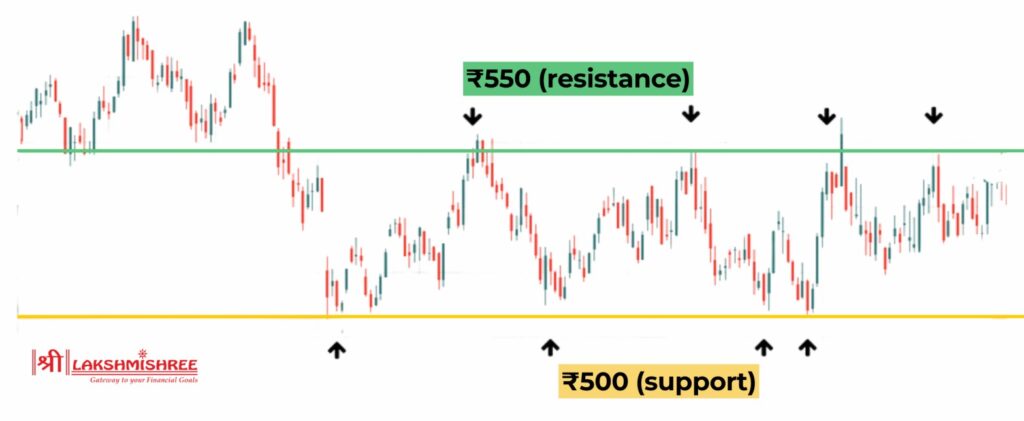
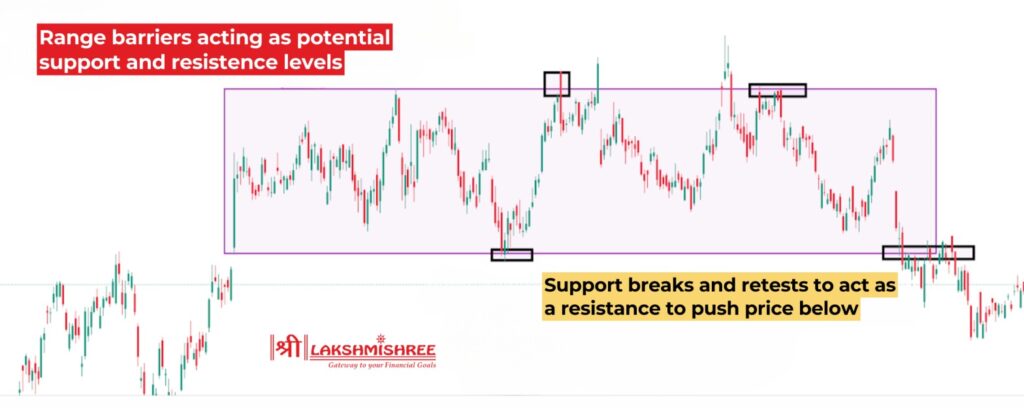
A common example of support and resistance is seen in stocks trading within a price range. Suppose a stock repeatedly bounces between ₹500 (support) and ₹550 (resistance). When the price reaches ₹500, buyers step in, pushing the stock up. Conversely, at ₹550, selling pressure increases, causing the price to fall back.
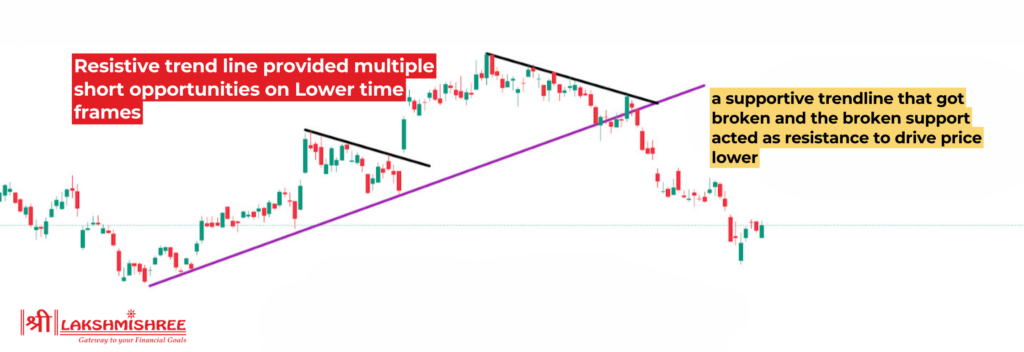
Another example is when a stock follows an upward trendline, where higher lows form a rising support line. If the price consistently respects this trendline, it indicates strong buying interest. However, once the trendline is broken, it may signal a shift in market sentiment, leading to a downward move. Traders use such patterns to predict price movements and refine their entry and exit strategies.
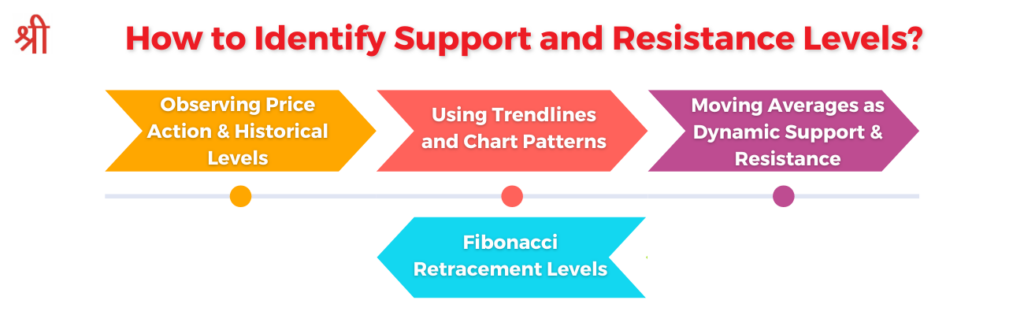
Drawing resistance and support lines is an essential skill in technical analysis, helping traders identify key price levels. There are several methods to find these levels accurately.
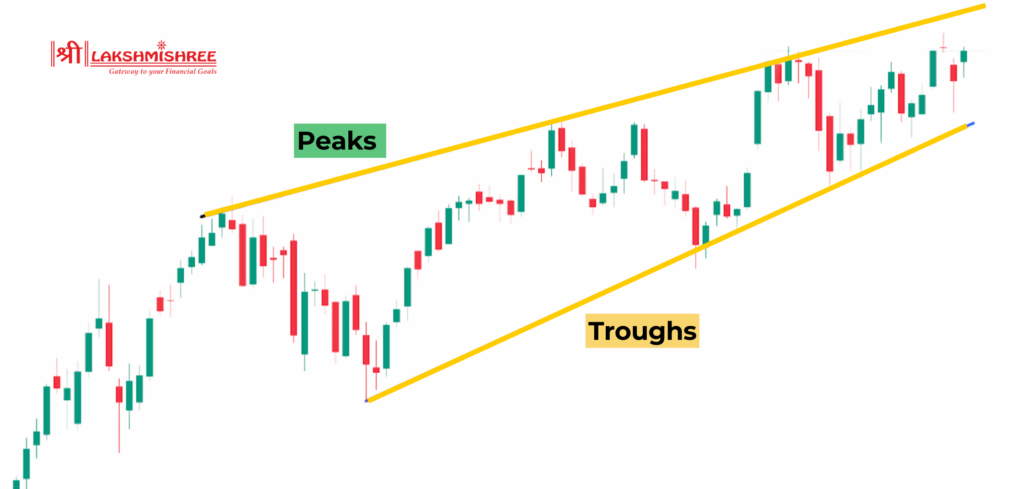
One of the simplest ways to draw support and resistance lines is by identifying previous highs (peaks) and lows (troughs) on a chart. A support line is drawn by connecting multiple swing lows, while a resistance line is drawn by connecting multiple swing highs. The more times the price has tested a level, the stronger the support or resistance becomes.
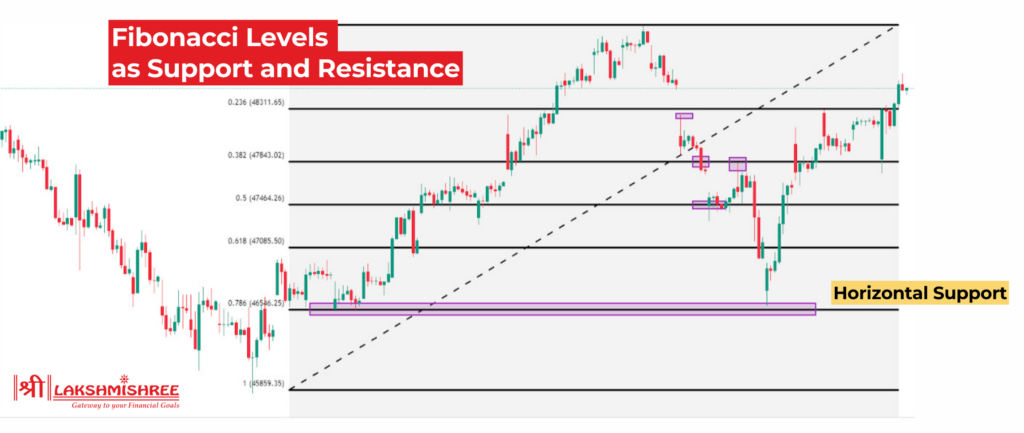
Fibonacci retracement is a mathematical tool used to identify potential zones. Traders plot Fibonacci levels from a significant high to a significant low, and key levels like 38.2%, 50%, and 61.8% act as support or resistance. These levels help predict where the price might reverse after a trend move.
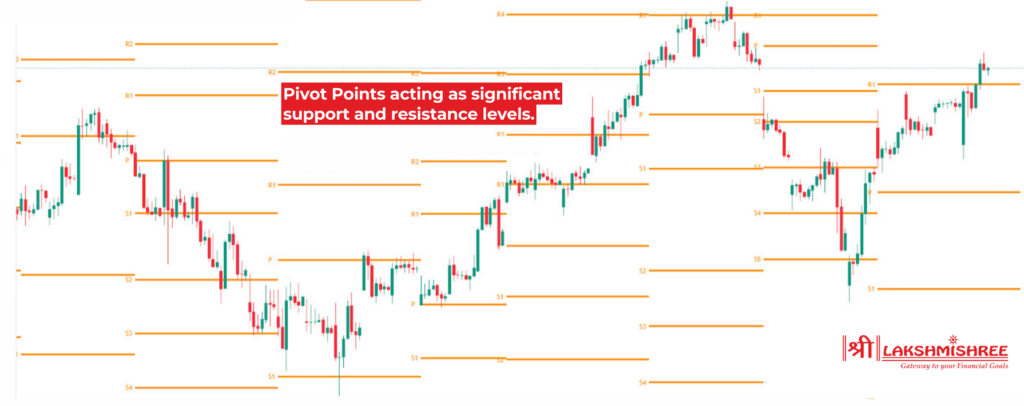
Pivot points are calculated using the previous day's high, low, and close prices. They provide multiple levels of support (S1, S2, S3) and resistance (R1, R2, R3), helping traders determine potential turning points in price action.
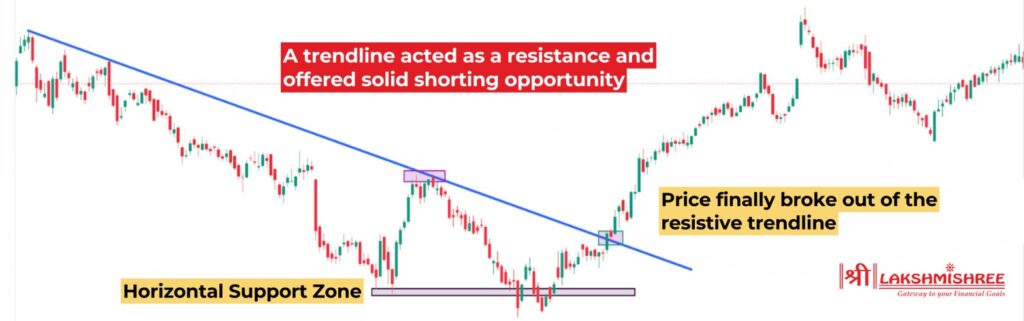
Trendlines are drawn by connecting two or more price points in an uptrend or downtrend. An ascending trendline connects higher lows and acts as support, while a descending trendline connects lower highs and acts as resistance. These trendlines help traders identify the overall direction of the market and potential breakout areas.
Indicators such as the 50-day and 200-day moving averages, Bollinger Bands, and Ichimoku Cloud also act as dynamic levels. These indicators adjust with the price, providing traders with flexible zones to anticipate market movements.
These indicators help traders identify key price levels where stocks may reverse or break out. These indicators provide a structured approach to analysing price action, reducing guesswork in trading decisions.
Other useful indicators for identifying levels include pivot points, Bollinger Bands, and trendlines, each offering unique insights into price movement and market trends.
Understanding support and resistance is not just about recognising key levels but also about knowing how to trade them effectively. Below are some of the best trading strategies based on levels.
Range trading works well when a stock is moving sideways between a well-defined support and resistance zone. Traders identify a price range where the stock consistently bounces off support and falls from resistance.
This strategy is ideal for markets that lack a clear trend and where the price moves within a predictable range. Traders need patience to wait for the right entry and exit points.
Breakout trading focuses on entering a trade when the price breaks above resistance or below support with strong momentum. This signals a potential new trend formation.
Breakout trading is effective when combined with high trading volume, which confirms that the breakout is genuine and not a false signal.
Trendlines act as diagonal support and resistance levels, connecting swing highs in a downtrend and swing lows in an uptrend. Traders use these lines to make trading decisions.
A break of a trendline can indicate a trend reversal, signalling traders to adjust their positions accordingly.
Moving averages provide dynamic levels, helping traders make trade entries and exits.
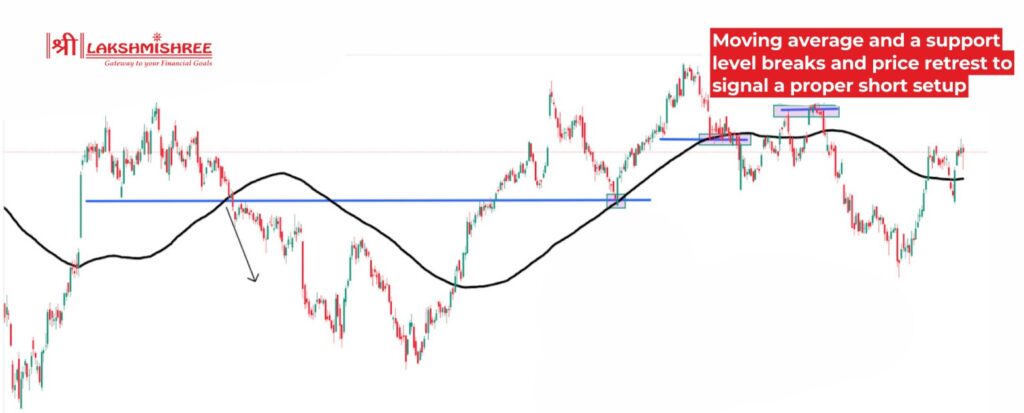
When a stock price breaks through level, it often signals a potential trend reversal or continuation. If support is broken, it means sellers have overpowered buyers, leading to further price declines. This broken support can then turn into a new resistance level, where selling pressure increases.
On the other hand, if resistance is broken, it suggests strong buying momentum, often leading to a price surge. The previous resistance may then act as a new support level, attracting buyers on pullbacks. Traders confirm breakouts by looking at increased volume and price action signals to avoid false breakouts, which can trap inexperienced traders.
Support and resistance levels are essential for making informed trading decisions. These key price zones help traders determine entry and exit points, set stop-losses, and identify trend reversals. Whether using moving averages, Fibonacci retracement, or trendlines, combining different techniques improves accuracy. However, traders should avoid common mistakes, such as ignoring confirmations and overtrading weak levels.
Support is a level where buying interest is strong enough to prevent the price from falling further. It acts as a floor, stopping downward movement. Resistance is a level where selling pressure prevents the price from rising higher. It acts as a ceiling, stopping upward movement.
The best support and resistance indicators include moving averages and Fibonacci retracement. Moving averages, such as the 50-day and 200-day SMA, help traders identify dynamic levels as prices fluctuate.
Fibonacci retracement levels, such as 38.2%, 50%, and 61.8%, highlight potential reversal zones based on previous price movements.
Traders often use mathematical formulas to estimate key support and resistance levels. The formulas are:
Support Level = Previous Low – (Price High – Previous Low)
Resistance Level = Previous High + (Previous High – Price Low)
Both Levels can be found by analysing past price movements. Traders look for historical highs and lows where the price has reversed multiple times, as these often act as strong levels. Other methods include using Fibonacci retracement, pivot points, and moving averages to find key price zones.
To draw support and resistance lines, traders first identify previous swing highs (resistance) and swing lows (support) on a price chart. These levels should have been tested multiple times to be considered strong. Connecting multiple highs or lows with a horizontal line forms a clear support or resistance level.
Yes, support and resistance levels can switch roles in a concept known as role reversal. When a stock price breaks below a strong support level, it often turns into a new resistance level, preventing further upward movement.
Disclaimer: This article is intended for educational purposes only. Please note that the data related to the mentioned companies may change over time. The securities referenced are provided as examples and should not be considered as recommendations.
