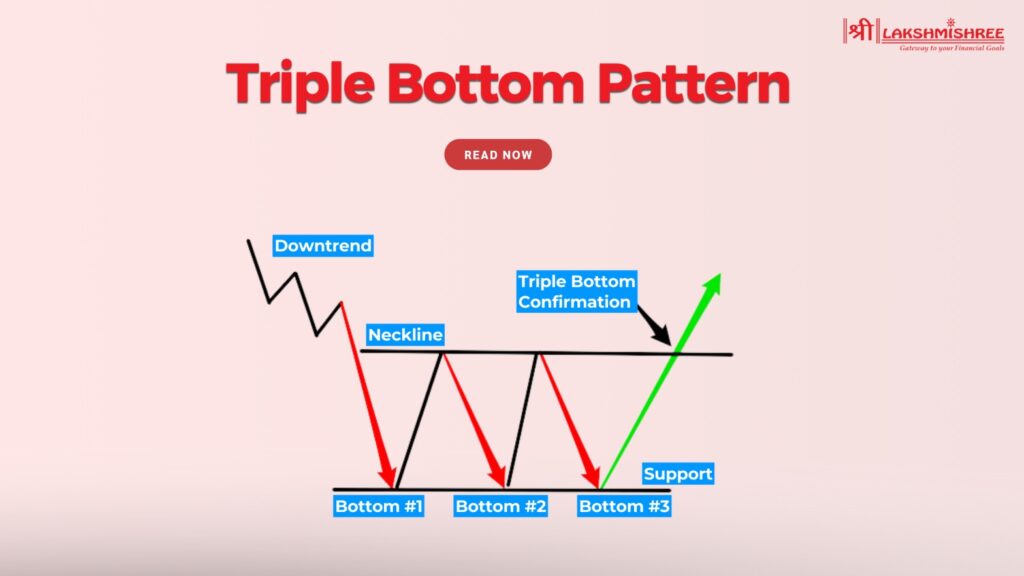
If you’re learning about trading, you’ve probably encountered terms like “chart patterns” and wondered how they help traders. Well, one pattern that stands out for spotting trend reversals is the triple bottom pattern. It’s like a hidden clue in the market that can help you predict when prices might rise after falling.
In this blog, we’ll explain the concept in simple terms, show you how to find it on a chart and share easy strategies. Whether you’re new to trading or just curious about how it works, this guide will clarify things. Keep reading to discover how this pattern can make a difference in your trading journey!
A triple bottom is a chart pattern used in technical analysis that indicates a potential reversal. It happens when the price has been in a downtrend and is stabilising, forming three lows at roughly the same price. It means sellers have tried to push the price down three times and failed, so buyers are taking over the market.
Think of it like the market testing a support level three times before deciding to go the other way. Once the price breaks above a resistance level after this pattern, it’s often a strong buy signal, so it’s a key tool for traders to look for buying opportunities.
In short, a triple bottom signals that the market will stop going down and go up!
Identifying a triple bottom might sound hard but it’s much easier once you know what to look for. This will walk you through so that even beginners can spot this pattern on a chart.
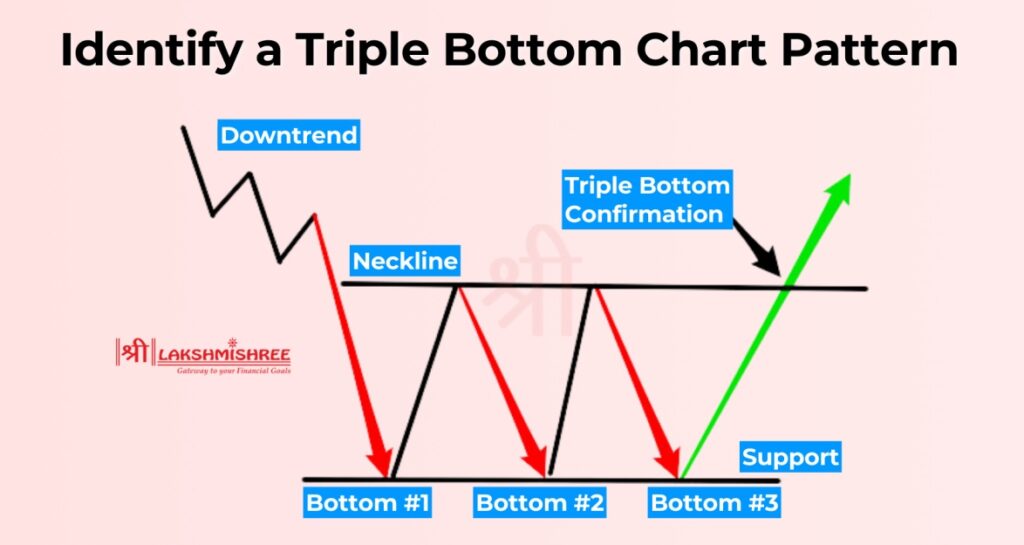
Steps to Identify the Triple Bottom Chart Pattern:
The triple bottom is important because it gives you a clear signal of a market reversal. When a stock or asset has been going down in price, this pattern tells you the sellers are losing steam and buyers are taking over. That’s why it’s a bullish pattern and a great opportunity to get in at the right time.
One of the best things about the triple bottom pattern is its reliability. Unlike other patterns, it gives you multiple confirmations (three bottoms and a breakout above resistance) before it signals a reversal. That reduces the false signals and makes it a great pattern for new and experienced traders. Plus it often appears in markets that are consolidating after a long downtrend so you can ride the bounce.
In short, the triple bottom pattern is significant because it combines predictability with practicality, giving traders the confidence to make well-informed decisions.
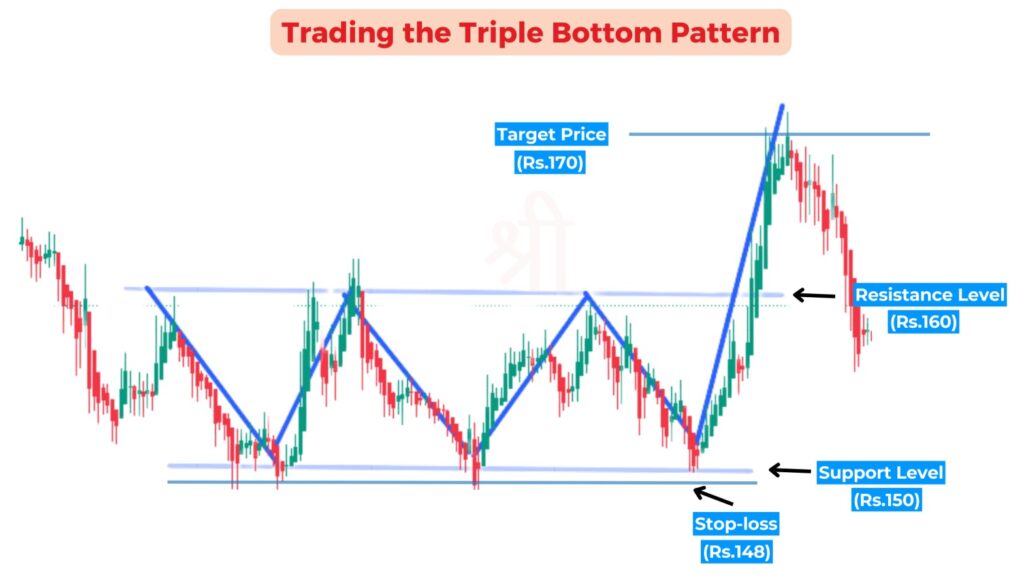
The triple bottom pattern is very reliable when confirmed and risk-managed. Below is a step-by-step guide to help you trade this pattern and an example to make it easier to understand:
1. Identify the Pattern
Find three lows at roughly the same price on the chart, a solid support area. For example, if a stock goes to ₹150 three times in a few weeks and doesn’t go lower, it means buyers are coming in at this level to stop the fall.
Also check for minor highs (temporary rallies) between the three lows, creating resistance. In this case the stock might go to ₹160 after each drop but fail to go above this level.
2. Confirm with Indicators
Don’t jump into a trade just because you see a triple bottom pattern. Use technical indicators like RSI to confirm the reversal. For example, if RSI shows the stock is oversold during the third low, it strengthens the signal that a bullish reversal might happen.
3. Wait for the Breakout
A triple bottom pattern is confirmed only when the price breaks above the resistance created by the two small peaks. For example if the stock is struggling to go above ₹160, wait for it to close above this level with good volume. The breakout means buyers have taken control and the price will move up.
4. Set Your Stop-Loss
To limit your risk, set your stop-loss below the lowest point of the triple bottom. In our example if ₹150 is the lowest low, set your stop-loss at ₹148 so that your losses are limited if the trade doesn’t go as expected.
5. Calculate and Set Your Target Price
After the breakout, set your target at the height of the pattern. Measure from the support ₹150 to ₹160.
This gives you a clear exit plan while maximising profits.
Example in Action:
Imagine trading a stock where:
This structured approach helps reduce the risk of false signals and gives you a clear entry and exit plan.
The triple bottom is a bullish reversal pattern that means a downtrend reverses into an uptrend. It forms when the price tests a strong support three times and can’t break below and then breaks above the resistance created by the small highs. This shows sellers are losing steam and buyers are taking control so it’s a good indicator of a price up.
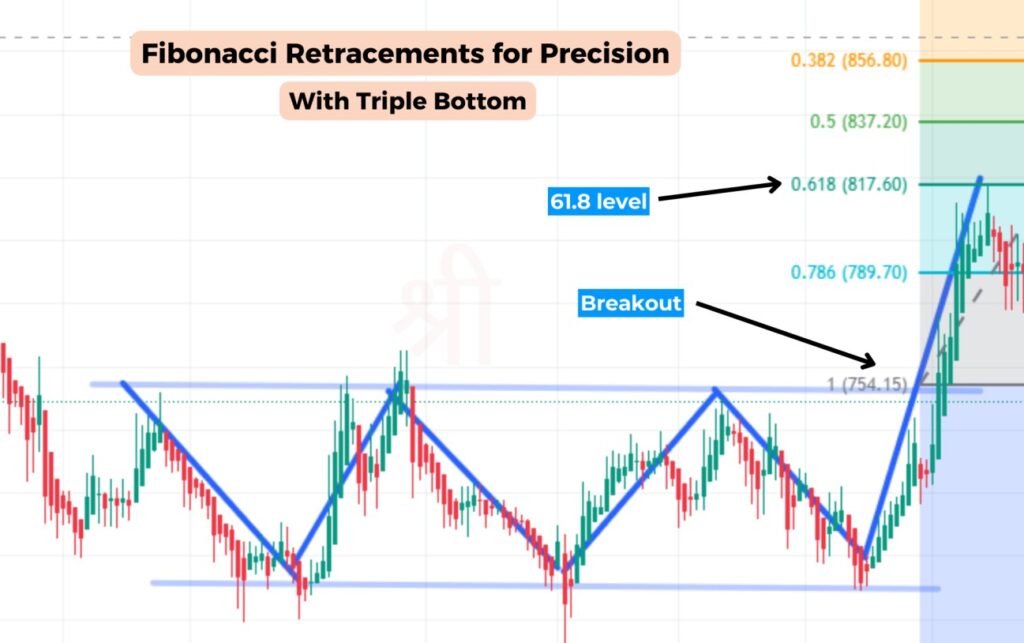
1. Use Fibonacci Retracements for Precision
Combine the triple bottom with Fibonacci retracements to find entry and exit points. For example, measure the move from the breakout to the target price and overlay Fibonacci levels (e.g. 61.8%) to find potential pullbacks or profit targets.
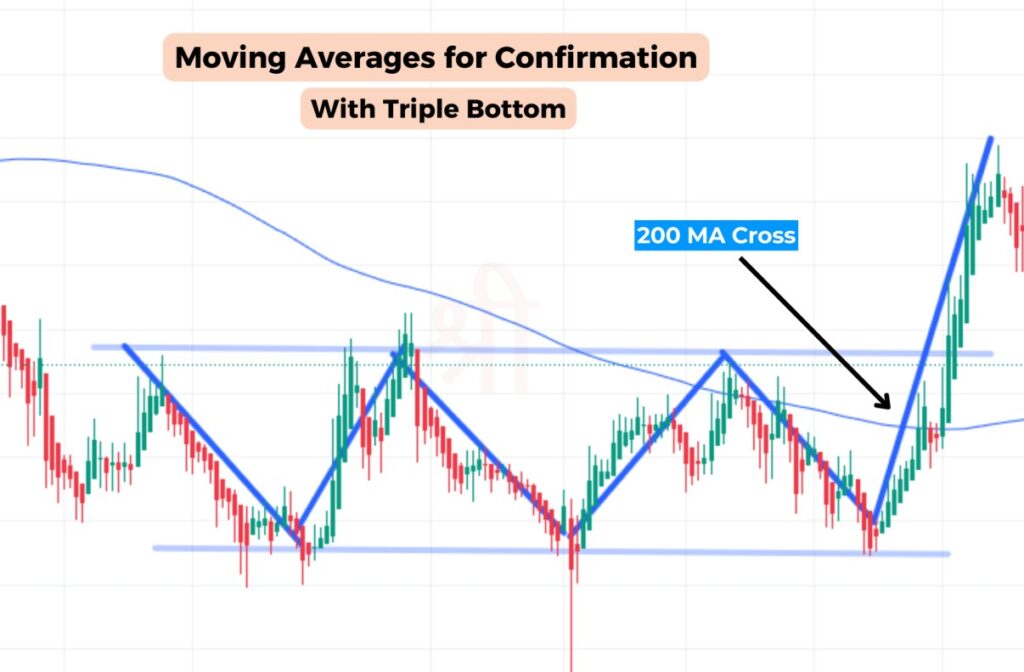
2. Add Moving Averages for Confirmation
To confirm the trend direction, apply moving averages like the 50-day or 200-day SMA. A bullish crossover or price breaking above the moving average strengthens the reliability of the pattern.
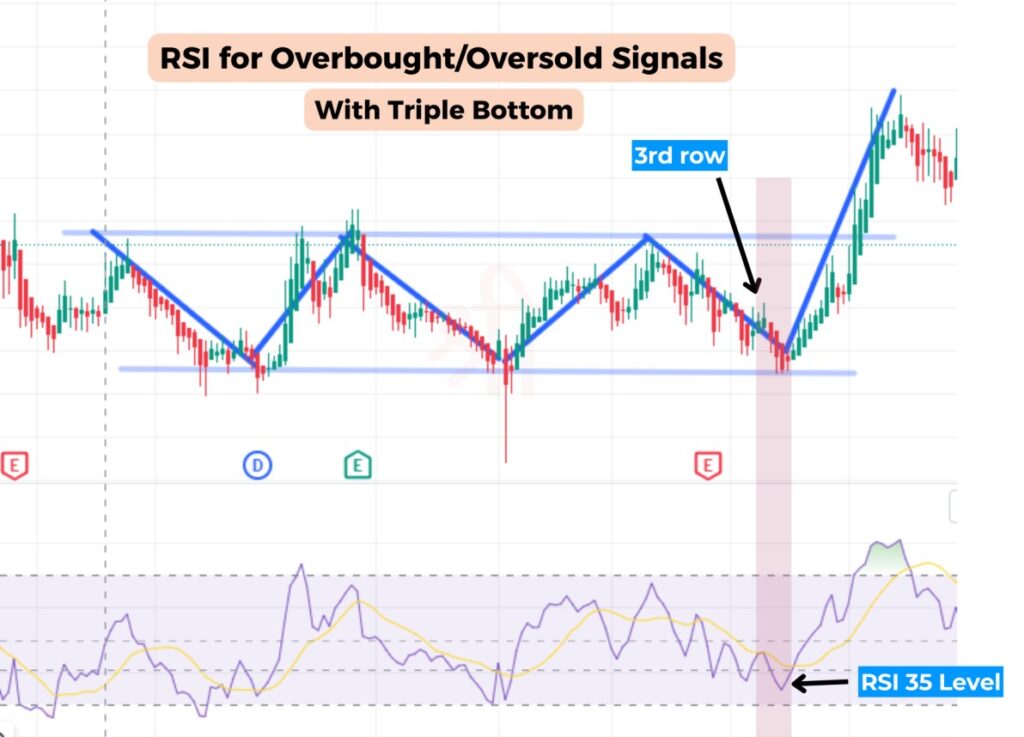
3. Utilise RSI for Overbought/Oversold Signals
RSI or Stochastic Oscillator can be used to confirm a trade. If RSI comes out of the oversold zone during the 3rd low, it’s a bullish reversal.
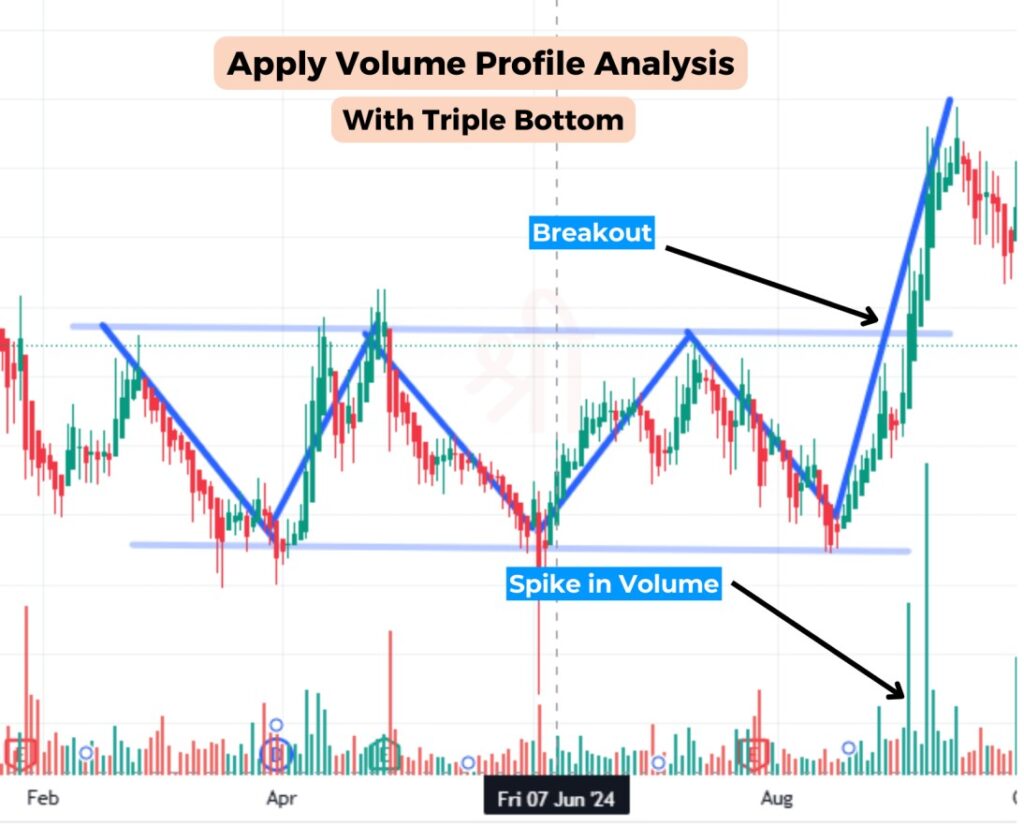
4. Apply Volume Profile Analysis
Check the volume at key points of the pattern. More volume during the breakout means more buying and less chance of a fake breakout.
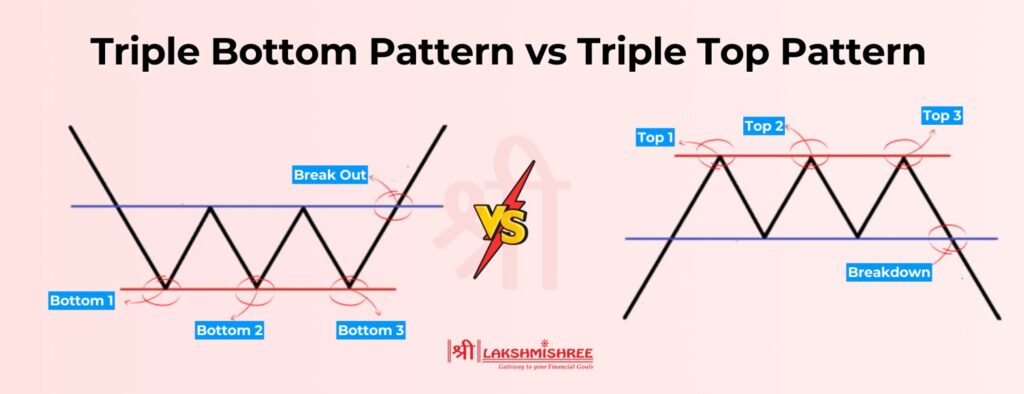
The triple bottom and triple top are opposite reversal patterns. The triple bottom is a bullish pattern that signals a potential up trend after 3 failed attempts to break a support level, and the triple top is a bearish pattern that signals a potential downtrend after 3 failed attempts to break a resistance level. The triple bottom forms at the end of a downtrend, and the triple top forms at the end of an up trend. Traders use these patterns to trade reversals, the triple bottom is for buying opportunities and the triple top is for selling opportunities.
Advantages:
Limitations:
The triple bottom indicates a trend reversal by showing the shift from sellers to buyers. As the price tests a strong support level three times without breaking down, it means selling pressure is waning. The small peaks (or swing highs) in between the lows show buyers are stepping in and interrupting the down move.
When the price finally breaks above the resistance level with high volume, it means buyers have taken over sellers, end of the downtrend and the start of the uptrend. This pattern shows how bearish turns into bullish, hence a good signal for traders to trade the reversal.
Placing a stop-loss is essential when trading the triple bottom chart pattern, as it minimises risk if the pattern fails. Here are three effective ways to position a stop-loss:
Yes, you can combine the triple bottom with other chart patterns for a stronger trade. Combining with other patterns or indicators gives you more confirmations for the trade.
For example, traders often use the breakout strategy with the triple bottom. Once the breakout above the resistance level confirms the pattern, you can enter the trade with a buy. You can also wait for the price to retest the breakout level and add more confidence to the trade setup. You can combine the triple bottom with RSI or moving averages to confirm oversold or trend reversal.
Combining double bottom, head and shoulders or Fibonacci retracements will give you more entry and exit points.
The triple bottom is a great tool for traders to spot trend reversals and buying opportunities. By seeing the 3 lows, breakout above resistance and confirm with volume, you can use this bullish pattern to ride the market. While it’s good, combining it with technicals and risk management, such as stop loss, will make it safer.
The triple bottom pattern is a bullish reversal chart pattern that signals the end of a downtrend and the potential for an upward trend. It forms when the price tests the same support level three times without breaking lower, followed by a breakout above the resistance level created by the minor peaks between the lows.
To confirm a triple bottom pattern, traders rely on indicators like trading volume, which should increase during the breakout above resistance, signalling strong buying interest. Additionally, the Relative Strength Index (RSI) can indicate oversold conditions during the third low, while a bullish MACD crossover further supports the likelihood of a trend reversal.
The target price for the triple bottom pattern is calculated by measuring the distance between the support level (three lows) and the resistance level (minor peaks). Add this distance to the breakout point to estimate the target. For example, if the support is ₹100 and the resistance is ₹110, the target would be ₹120 (₹110 + ₹10).
The triple bottom pattern is a bullish pattern. It indicates a potential reversal from a downtrend to an uptrend as buyers gain strength and sellers lose momentum, making it a reliable signal for upward price movements.
The success rate of the triple bottom pattern is generally high when confirmed by volume and additional indicators. Studies suggest that it has an accuracy rate of approximately 70%-75%, but the actual success depends on factors like market conditions and the trader's execution strategy.
Disclaimer: This article is intended for educational purposes only. Please note that the data related to the mentioned companies may change over time. The securities referenced are provided as examples and should not be considered as recommendations.