Have you ever looked at a stock chart and wondered if there's a way to predict when the market might reverse direction? If so, you're not alone! Identifying the right entry or exit point can feel like solving a tricky puzzle for traders. That’s where Hammer Candlestick Patterns come in—they act as powerful signals that a trend reversal might be on the horizon.
Understanding these patterns can give you the edge you need, whether it’s the bullish hammer pointing toward a bounce-back or the inverted hammer highlighting a potential reversal in a downtrend. In this blog, we’ll break down everything about hammer candlesticks, their types, and how you can use them to make better trading decisions.
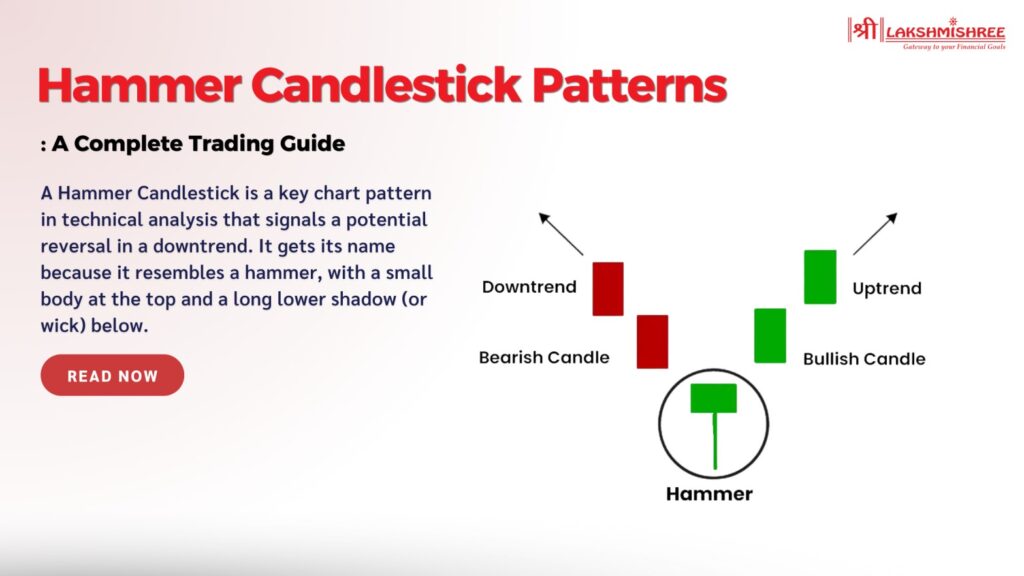
A Hammer Candlestick is a key chart pattern in technical analysis that signals a potential reversal in a downtrend. It gets its name because it resembles a hammer, with a small body at the top and a long lower shadow (or wick) below. This pattern forms when the price opens, falls significantly during the trading session, and closes near the opening price.
The long lower shadow shows sellers pushed the price down, but buyers stepped in and drove it back up before the session ended. This “hammering” action often indicates that the selling pressure is weakening, and a bullish reversal might occur. Traders use this pattern to identify buying opportunities at the end of a downtrend.
Key Points to Remember:
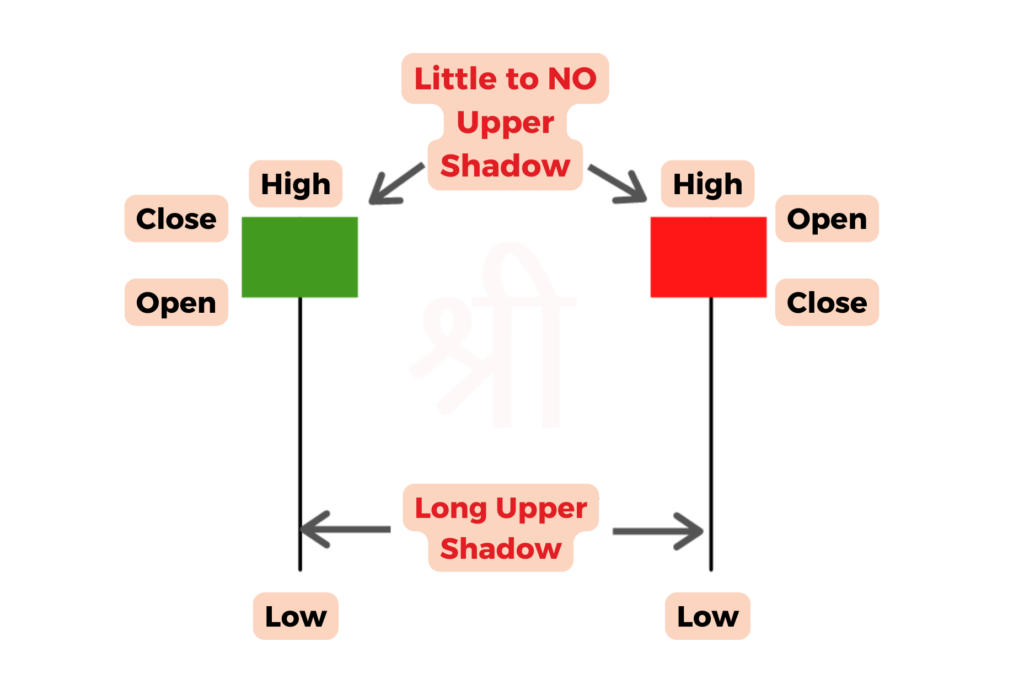
The formation of a hammer signifies that sellers attempted to dominate but failed, allowing buyers to regain control. This can often mark the beginning of a bullish reversal. While it’s most effective in stock markets, the hammer candlestick is also widely used in Forex and crypto trading for spotting market reversals.
Identifying a Hammer Pattern on a chart requires careful observation of its shape, size, and position in the trend. Here’s how you can accurately spot it:
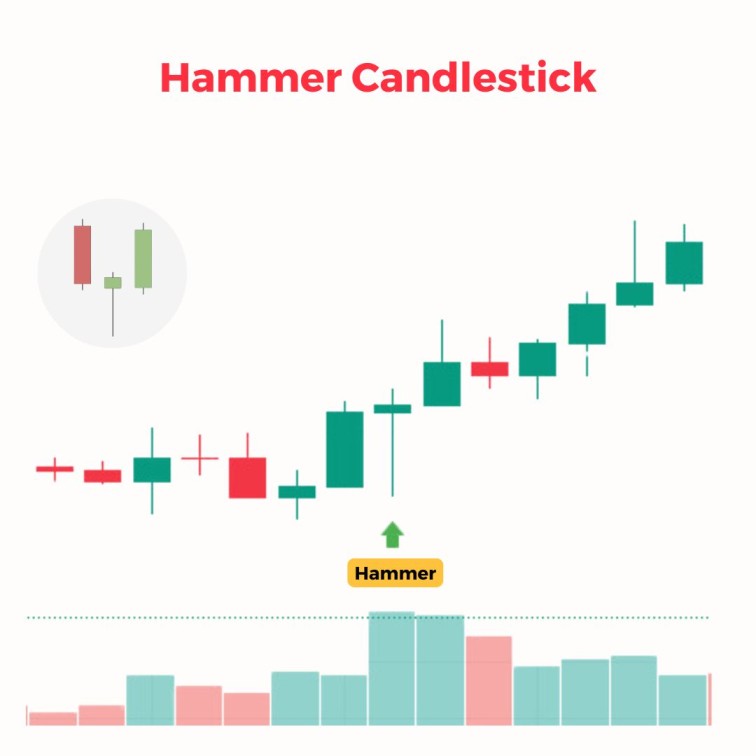
While the classic hammer is widely used, it has variations, such as the bullish hammer pattern, the bearish hammer pattern, and the inverted hammer pattern. Let’s detail each type to help you understand how they work.
The bullish hammer pattern is the most common type of hammer and typically appears at the end of a downtrend. It signals that the sellers tried to push prices lower during the session but were overpowered by buyers, causing the price to close near the opening level. This shift in control from sellers to buyers often hints at a bullish reversal.
Key Features:
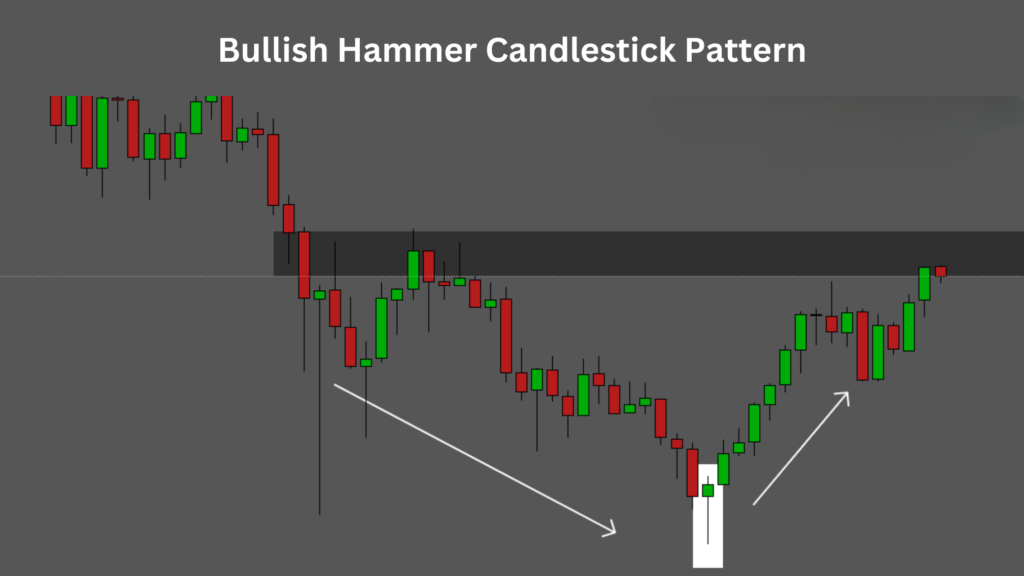
What It Tells Traders:
The bullish hammer pattern reflects that the market sentiment is changing. Sellers dominated the early part of the session, but buyers stepped in aggressively, pushing the price up. Traders often wait for a confirmation candle (a bullish candlestick that closes above the hammer) before entering a trade to reduce risks.
The bearish hammer pattern is also known as the hanging man when it appears in an uptrend. While it looks similar to a hammer, its position at the top of an uptrend makes it significant for signalling a potential reversal to the downside.
Key Features:
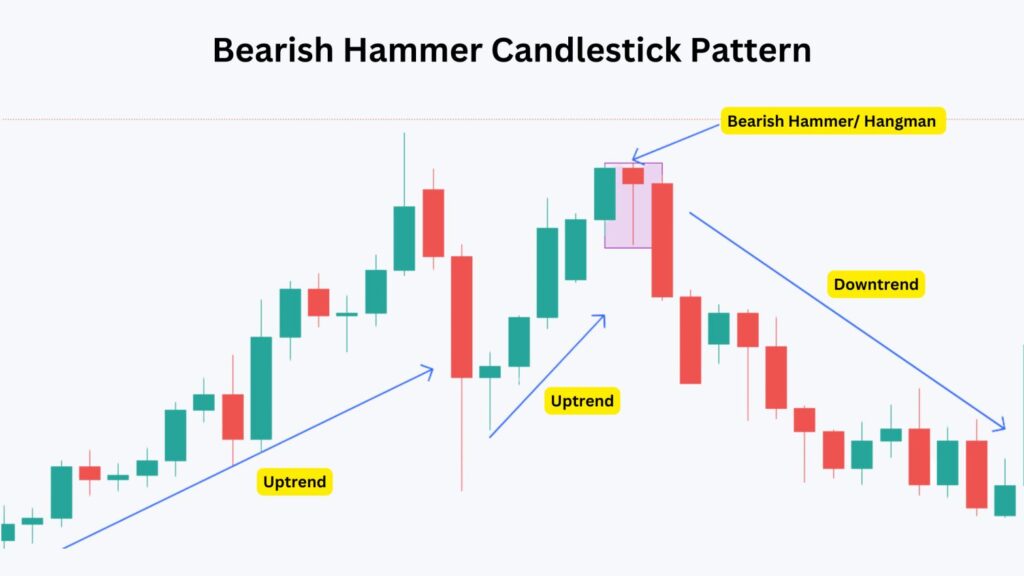
What It Tells Traders:
The bearish hammer indicates that buyers attempted to increase prices, but sellers gained control and drove prices down during the session. Although the price may close near the open, the long lower shadow suggests weakening buying pressure. Traders see this as a warning sign that the trend could reverse downward.
The inverted hammer candle appears at the end of a downtrend and signals a potential bullish reversal. Unlike the regular hammer, the inverted hammer has a small body at the bottom with a long upper shadow and little to no lower shadow. It reflects indecision in the market but hints that buying interest is increasing.
Key Features:
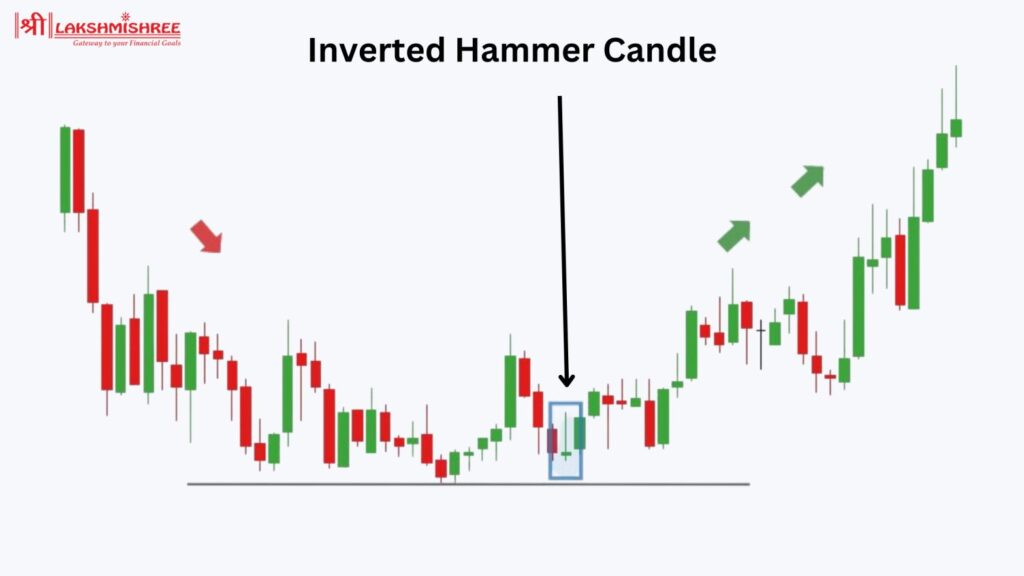
What It Tells Traders:
The inverted hammer shows buyers pushed the price higher during the session, but sellers brought it back near the open. While sellers retained some control, the upper shadow indicates buyers’ growing strength. Traders often wait for a confirmation candle (a strong bullish close) to confirm a reversal before taking action.
Let’s say a stock has been in a downtrend, with prices falling steadily. On the chart, we spot a hammer candlestick pattern forming. For instance, the stock opens at ₹200, drops to ₹190 during the session, and then rebounds to close at ₹198, near the opening price. The candlestick has a small body at the top and a long lower shadow—this is a clear sign of a hammer candlestick.
This pattern tells us that sellers initially dominated the market, pushing the price down. However, buyers stepped in, regaining control and driving the price back up toward the close. The long lower shadow represents the market's rejection of lower prices, signalling a possible bullish reversal.
The next candlestick is critical for confirmation. If the following session opens higher and closes above the hammer’s high (₹200 in this case), it confirms that buyers are in control. Traders often enter a buy position during the confirmation candle, placing a stop-loss just below the hammer’s low (₹190). If the price moves aggressively upward, some traders may tighten the stop-loss to just below the hammer’s body (₹198) to minimize risk.
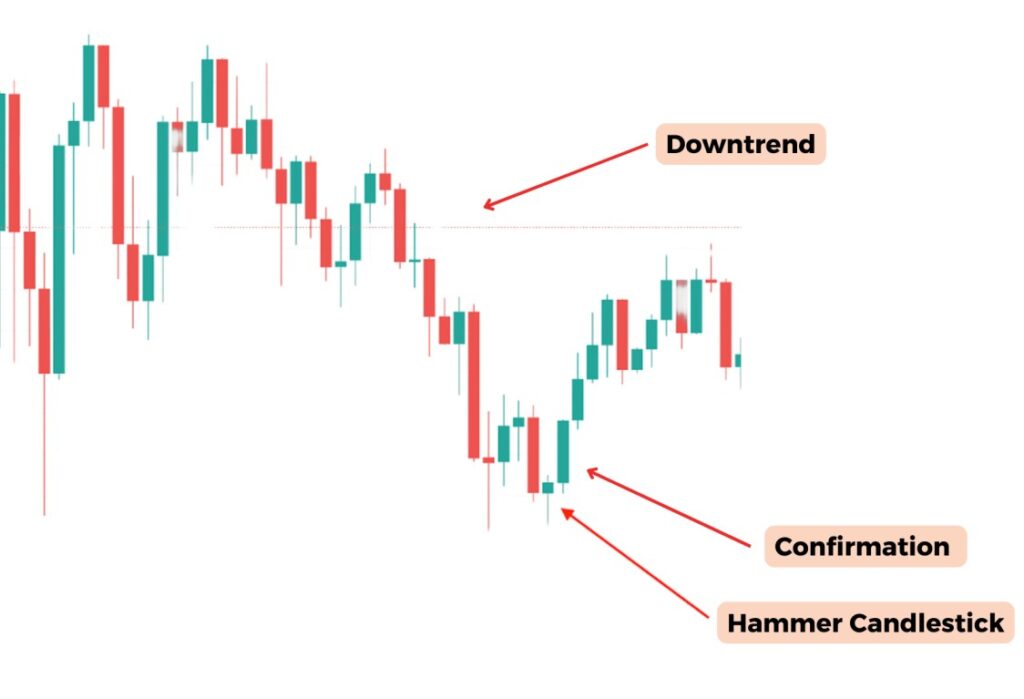
In this way, the hammer candlestick becomes a practical signal for traders to spot reversals, identify entry points, and manage risks effectively. By combining the hammer with confirmation and stop-loss strategies, traders can improve their chances of success in volatile markets.
The Hammer Candlestick and the Doji are key reversal patterns in technical analysis but differ significantly in structure and meaning. A hammer candlestick has a small body with a long lower shadow, signalling buyers regained control after sellers pushed prices lower. On the other hand, a Doji forms when the open and close prices are almost identical, showing market indecision rather than a clear reversal.

| Feature | Hammer Candlestick | Doji Candlestick |
|---|---|---|
| Shape | Small body at the top with a long lower shadow | Open and close are nearly equal; body looks like a cross |
| Shadows/Wicks | Long lower shadow, little to no upper shadow | Both upper and lower shadows can be present |
| Meaning | Indicates buyers are gaining control after a downtrend | Reflects market indecision between buyers and sellers |
| Position | Appears at the bottom of a downtrend | Can appear in uptrends, downtrends, or sideways |
| Confirmation | A bullish candle after the hammer confirms the reversal | Requires further confirmation for reliability |
In short, a hammer candlestick is a clear reversal signal, especially in downtrends, whereas a doji primarily highlights market hesitation and requires more careful analysis.
They are essential in stock market trading, especially for identifying trend reversals and potential buying opportunities. Here’s why they are important:
These benefits make hammer candlestick patterns a valuable tool for stock traders looking to improve their decision-making and spot market reversals early.
The Double Hammer Pattern is a rare but powerful reversal signal that appears when two consecutive hammer candlesticks form at the bottom of a downtrend. This pattern indicates sellers attempted to push prices lower twice, but buyers stepped in and successfully pulled prices back up. This repeated rejection of lower prices strengthens the signal for a potential bullish reversal.
The presence of two hammers reflects strong buying interest and shows that the market is preparing for an upward move. Traders often consider this pattern more reliable than a single hammer since it confirms that selling pressure is weakening further.
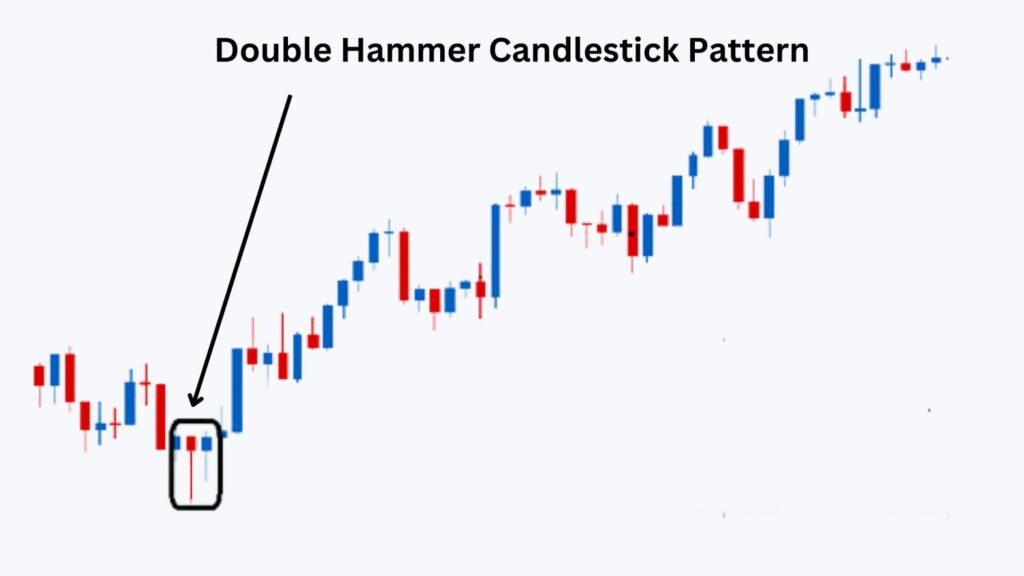
How Traders Use It:
The Hanging Man and the Hammer Candlestick may look similar, but their position in the trend and interpretation make them entirely different. While the hammer appears at the bottom of a downtrend and signals a bullish reversal, the hanging man occurs at the top of an uptrend and indicates a potential bearish reversal.
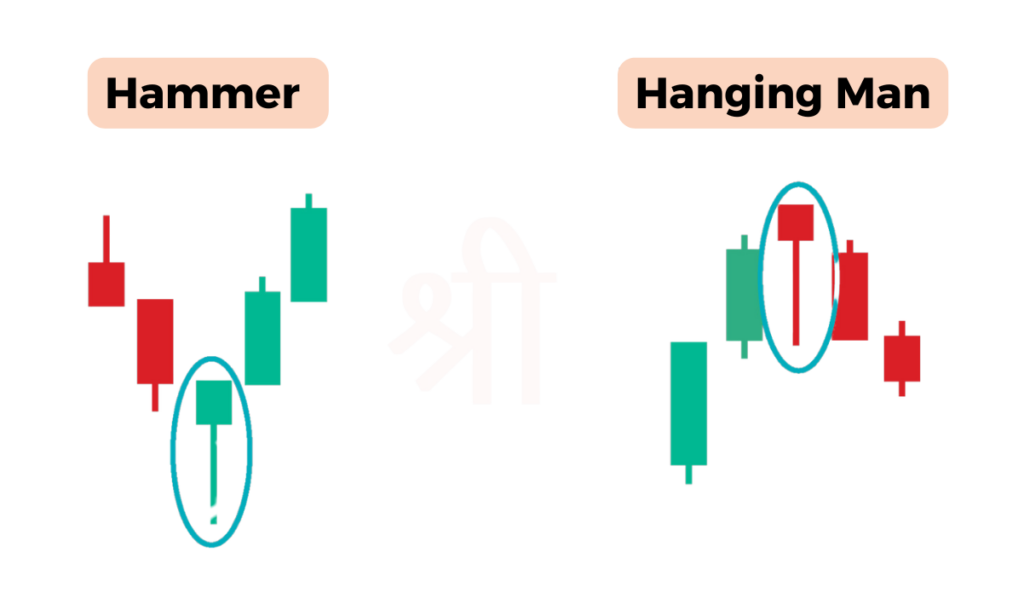
| Feature | Hammer Candlestick | Hanging Man Candlestick |
|---|---|---|
| Trend Position | Appears at the bottom of a downtrend | Appears at the top of an uptrend |
| Meaning | Signals a potential bullish reversal | Signals a potential bearish reversal |
| Shape | Small body at the top with a long lower shadow | Small body at the top with a long lower shadow |
| Market Sentiment | Shows buyers are regaining control after selling pressure | This indicates sellers are starting to dominate after buyers pushed prices up |
| Confirmation | A bullish candle after the hammer confirms the reversal | A bearish candle after the hanging man confirms the reversal |
The Hammer Candlestick Pattern is a reliable signal for traders to identify potential bullish reversals at the end of a downtrend. However, traders must use it strategically alongside confirmation signals and technical indicators to increase its accuracy. Below are some effective trading strategies to use with the hammer pattern:
By following these strategies, traders can use hammer candlestick patterns effectively to spot reversals, identify entry points, and minimise risks while trading stocks.
While the hammer candlestick pattern is a powerful tool for identifying potential reversals, it comes with certain limitations that traders must be aware of:
The Hammer Candlestick Pattern is vital for stock traders to identify potential bullish reversals in a downtrend. Its distinct shape and clear signals make it easy to spot, but it should always be used alongside confirmation and other technical indicators. By mastering patterns like the hammer and its variations, traders can make more informed decisions and reduce trading risks.
A hammer candlestick pattern is a chart formation that appears at the bottom of a downtrend and signals a potential bullish reversal. It has a small body at the top and a long lower shadow, showing that buyers have regained control after sellers pushed prices lower.
The hammer candlestick is primarily a bullish pattern, indicating the potential for a price reversal to the upside. However, the strength of the signal depends on confirmation from the next candlestick or additional indicators.
The hammer pattern has an approximate 40-60% success rate when used alone. Its reliability increases significantly when paired with confirmation signals, support levels, and technical indicators like RSI or volume.
The key difference is the position in the trend. A hammer candlestick forms at the bottom of a downtrend and signals a bullish reversal, while a hanging man candlestick appears at the top of an uptrend and warns of a potential bearish reversal.
No, a hammer candlestick is typically associated with downtrends and acts as a bullish reversal signal. In an uptrend, similar formations are usually classified as hanging man patterns, which indicate bearish potential.
Disclaimer: This article is for educational purposes only and should not be considered financial advice. Always conduct your research and consider consulting with a financial advisor before making any investment decisions.